EURUSD - 2nd potential entryEvening all
Here is a still screenshot of what I am looking for the market open on EURUSD come Sunday night after the spreads have died down on the pair.
My pending order will go directly on the FVG with my stops below the manipulation of the range.
If I get tagged in great. If I don't also great if we continue to move high I mill just manage the one position.
If I am tagged in I will give you and update with a new idea and then depending on how that idea plays out win or lose I will come back and re-visit it and break it down some more.
However I have high hopes for this trade to make it up to 1.16300
Have a great weekend
and I will speak to you all soon
EURUSD_SPT trade ideas

EURUSD - BreakdownApologies video is a bit rushed.
Wanted to get it done before the weekend arrived.
There's so much more to this video and entry reason that I have left out unintentionally like the fact we swept the Asia lows before creating a BoS. There are also a few other things like I have left out but without looking at the chart right now I cannot remember off the top of my head.
I will post the idea of this trade below so you can see that I was taking it before it played out.
Hope you all have a great weekend and a better trading week than you had this week.
Enjoy
P.S if you have any questions please do message

EURUSD On G.Force There's a lot going on in EURUSD such that it requires combination of both technical and fundamental...if you are not an experienced trader ...stay off ....there is enough money to be made and also lot more to loose

CHECK EURUSD SIGNAL READ CAPTAIONEntry: around1.15400 1.15350)✅
Take Profit1.15150 ✅
Take Profit 2: 1.14800✅
Last Target:1.14500 ✅
Stop Loss: 1.15700❌

Market next move Disruption to Bullish Scenario:
1. Resistance Zone Around 1.1540 – 1.1550
The price is approaching a psychological and potential resistance level around 1.1540–1.1550.
If the bulls fail to break this zone convincingly, a rejection could lead to a pullback or reversal.
2. Bearish Divergence in Volume
Despite upward movement in price, the volume doesn't show a strong bullish breakout. If momentum weakens while price rises, it might indicate a bearish divergence.
3. Rising Wedge Formation
The current price channel resembles a rising wedge, which is typically a bearish pattern.
A breakdown from this pattern (below the “support area” trendline) could trigger a sell-off toward 1.1500 or lower.
4. Economic Data or News Risk
Any sudden USD strength due to economic reports, Federal Reserve commentary, or geopolitical tension could flip the sentiment instantly.
Icons below the chart hint at upcoming news from the Eurozone or U.S., which could lead to volatility.
5. Overbought Condition
If technical indicators like RSI or MACD (not shown in this chart) are in overbought territory, a correction or profit-taking may happen soon.

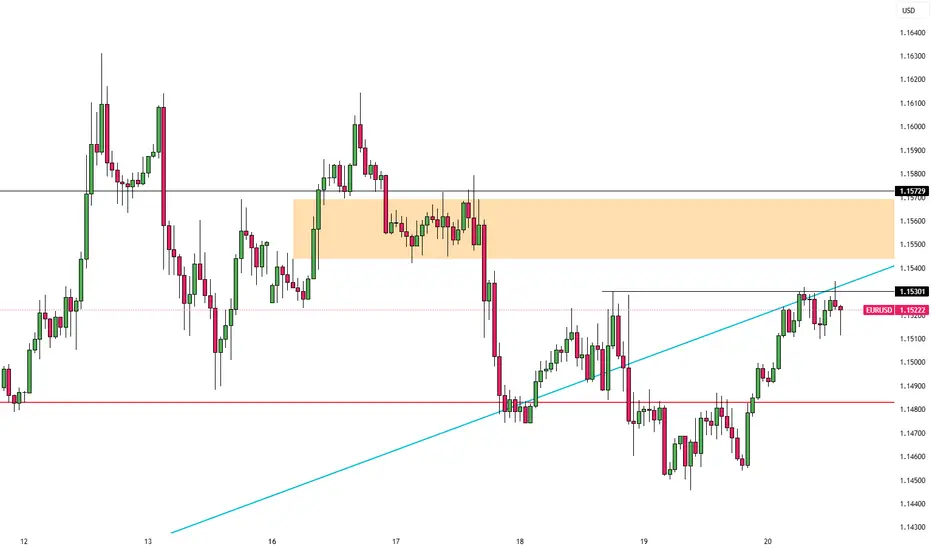
EUR/USD Slips Toward Trend SupportEuro plunged nearly 1.6% from the highs with price rebounding this week at former resistance at the 1.618% extension of the May advance. While the risk remains for a deeper correction towards the April uptrend, we’re looking for signs of support / that a low is in.
EUR/USD is trading within the confines of a proposed descending channel with price rebounding off confluent support at the lower parallel yesterday. The immediate focus is on this recovery with initial resistance eyed at the 61.8% retracement of the recent decline / the high-day close (HDC) at 1.1560/85. Ultimately, a breach / close above the 2016 high would be needed to mark uptrend resumption towards the upper parallel (currently near 1.1680s) and the August 2015 high / 78.6% retracement of the 2021 decline at 1.1714/47- both regions of interest for possible top-side exhaustion / price inflection IF reached.
Initial support rests at 1.1455 and is backed by the 38.2% retracement of the May advance at 1.1415. Note that the April trendline converges on this threshold mid-week and a break / close below this slope would be needed to suggest a more significant high weas registered las week / a larger trend correction is underway. Subsequent support rests with the objective monthly open at 1.1347 and the 2023 high / 61.8% retracement at 1.1276/82- look for a larger reaction there IF reached.
Bottom line: The Euro rally remains vulnerable to a test of uptrend support while below 1.1585. From a trading standpoint, losses would need to be limited to the April trendline IF price is heading higher on this stretch with a close above 1.1616 needed to mark uptrend resumption.
-MB

a new pullback before going upa new pullback before going up.
1.14 could be a good spot to place longs

Long position on the 1h/15m LTFThis is a position that just got filled a while ago.
It was executed using supply and demand zones on the LTF.

EUR/USD 4H Analysis – Bearish Outlook with Key Levels📉 EUR/USD 4H Analysis – Bearish Outlook with Key Levels 📊
🔍 Overview:
The EUR/USD pair on the 4-hour chart is showing signs of a potential bearish reversal after testing a strong resistance zone near 1.16000. Price action has rejected this area twice (🔴), confirming it as a significant supply zone. The chart now suggests a descending move toward the strong support zone around 1.12000.
🔑 Key Levels:
🟡 Resistance Zone: 1.15700 – 1.16000
Multiple rejections indicate strong selling pressure.
🟦 Mini Support: Around 1.14550
A minor level where price could react short-term, but not a major barrier.
🔻 Mid-Level Target: 1.13653
Potential bounce zone before continuation downward.
🟥 Strong Support Zone: 1.11500 – 1.12200
Previously held as a launch point for a major rally in May; likely to be tested again.
📈 Scenario Outlook:
Bearish Path Expected:
Price is forming a series of lower highs and appears to be losing bullish momentum.
Target Path (Blue Arrows):
A potential drop toward the 1.13653 level is expected, followed by a deeper drop toward the strong support.
Rebound Possibility:
If the strong support holds, we could see a strong bullish bounce 🔄, potentially creating a longer-term buying opportunity.
💡 Conclusion:
EUR/USD is currently in a correction phase. Traders should watch for a confirmed break below 1.14550 for bearish continuation 📉. A drop to the 1.12000 zone may offer a high-probability reversal setup 📊📍.
🔔 Trading Tip:
Use caution around mini support; aggressive sellers may enter on any weak bounce. Wait for confirmation before entering positions. 🧠📉

EURUSD Under Pressure! SELL!
My dear friends,
Please, find my technical outlook for EURUSD below:
The price is coiling around a solid key level - 1.1508
Bias - Bearish
Technical Indicators: Pivot Points Low anticipates a potential price reversal.
Super trend shows a clear sell, giving a perfect indicators' convergence.
Goal - 1.1488
About Used Indicators:
The pivot point itself is simply the average of the high, low and closing prices from the previous trading day.
Disclosure: I am part of Trade Nation's Influencer program and receive a monthly fee for using their TradingView charts in my analysis.
———————————
WISH YOU ALL LUCK

EUR/USD Approaching Key Resistance – Will Bulls Break Through?EUR/USD continues to trade within a strong uptrend, respecting the 50-day SMA while pressing against a key horizontal resistance level around 1.1576. The pair has recently pulled back modestly after testing this level but remains above the short-term moving average, suggesting buyers are still in control.
Technicals provide a mixed, but slightly bullish picture:
Trend Structure: Price action shows a series of higher highs and higher lows since mid-February, confirming a bullish trend.
Moving Averages: The 50-day SMA is above the 200-day SMA (golden cross), and price continues to close above both, reinforcing the bullish bias.
MACD: While flattening, it remains in positive territory – momentum is cooling but not reversing.
RSI: Currently near 59, suggesting bullish momentum without overbought conditions – a healthy zone for a potential continuation higher.
A breakout above the 1.1576 resistance could open the path toward the 78.6% Fibonacci retracement level near 1.1745. However, failure to clear this barrier may invite consolidation or a minor pullback toward the 50-day SMA.
Traders should watch for a daily close above 1.1576 or a bounce from the 50-day SMA to confirm the next directional move.
-MW

EURUSD is moving within the 1.14000 - 1.16330 range👀 Possible scenario:
The euro inched up near 1.1500 on June 19, supported by safe-haven flows as Israel-Iran tensions deepened and fears of U.S. involvement grew. Despite slight euro strength, demand for the U.S. dollar remained firm following the Fed’s decision to hold rates and warn of near-term inflation risks driven by Trump’s tariffs. The Fed also forecast slower growth and reaffirmed expectations for two rate cuts in 2025.
Markets now await U.S. data for further rate clues, while attention stays on the Middle East as Trump reportedly issued Iran a final ultimatum to avoid conflict.
✅ Support and Resistance Levels
Now, the support level is located at 1.14000
Resistance level is located at 1.16330

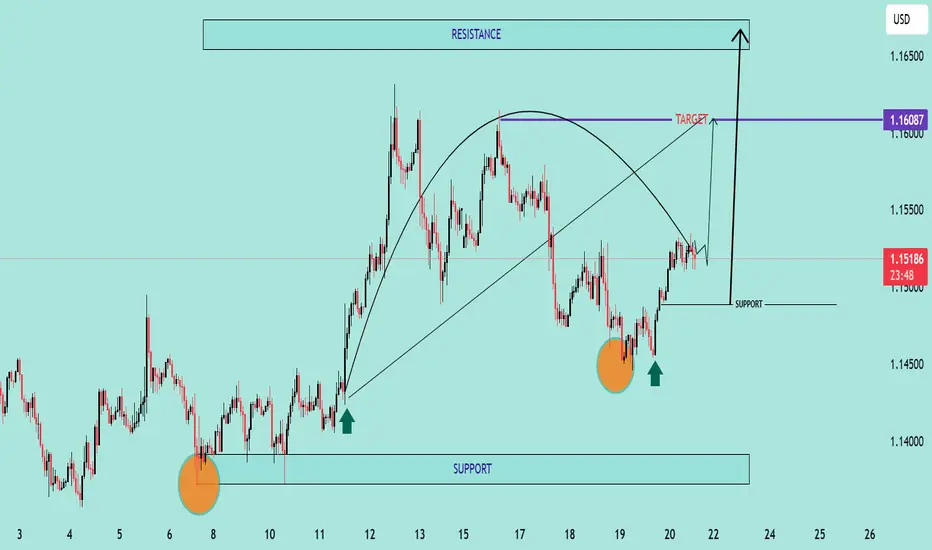
EUR/USD Bullish Reversal Breakout Pattern Technical Analysis Summary:
The chart illustrates a strong bullish reversal pattern forming on the EUR/USD pair:
🔹 Double Bottom Formation (🔶🔶):
Two clear bottom zones are marked with orange circles near the 1.14400–1.14500 area, indicating strong buying interest and support.
The second bottom confirms the double bottom pattern, often a precursor to an upward trend.
🔹 Support Zone (📉):
Firm support around 1.14450, as highlighted on the chart.
Price has respected this zone twice, bouncing back with bullish momentum each time.
🔹 Neckline Breakout (🔼):
Price is approaching the neckline zone at 1.16087, which acts as the bullish target.
A break and close above this neckline will confirm the reversal and open the way toward the resistance zone around 1.16500.
🔹 Projected Move (🎯):
If the neckline breaks, price is expected to surge towards 1.16500, aligning with the historical resistance.
This move completes the measured target projection from the double bottom structure.
🔹 Bullish Structure:
Higher lows and strong bullish candles are reinforcing the uptrend momentum.
Curved trajectory shows accumulation followed by a breakout phase.
📌 Key Levels to Watch:
Support: 1.14450 – 1.14500
Neckline/Target: 1.16087
Resistance: 1.16500
🛑 Invalidation:
A strong breakdown below support (1.14450) would invalidate this bullish setup.
EURUSD: Move Down Expected! Short!
My dear friends,
Today we will analyse EURUSD together☺️
The market is at an inflection zone and price has now reached an area around 1.15208 where previous reversals or breakouts have occurred.And a price reaction that we are seeing on multiple timeframes here could signal the next move down so we can enter on confirmation, and target the next key level of 1.15133..Stop-loss is recommended beyond the inflection zone.
❤️Sending you lots of Love and Hugs❤️

EUR/USD Slips as Fed Stays HawkishEUR/USD hovered near 1.1520 during Friday’s Asian session, extending gains for a third day as the US dollar weakened, likely due to a technical pullback. However, the greenback may rebound as safe-haven demand grows amid rising tensions between the US and Iran.
Citing senior US intelligence, The New York Times reported that Iran hasn’t yet decided to pursue nuclear weapons, despite having enriched uranium reserves. Meanwhile, the Senate Intelligence Committee Chair said President Trump is set to offer Iran one final window to negotiate before considering military action, potentially delaying any decisions for up to two weeks.
Markets are also awaiting Friday’s Monetary Policy Report from the Federal Reserve, which will provide fresh insights into the Fed’s stance. On the Euro side, the ECB’s hawkish outlook offered additional support, with President Christine Lagarde suggesting rate cuts may soon end as the central bank remains “well positioned” to handle persistent risks.
Resistance is located at 1.1530, while support is seen at 1.1450
EURUSDLarge speculators are heavily long EUR while USD longs are mild.
EUR (base) is fundamentally stronger than USD (quote), giving bullish bias for EUR/USD.

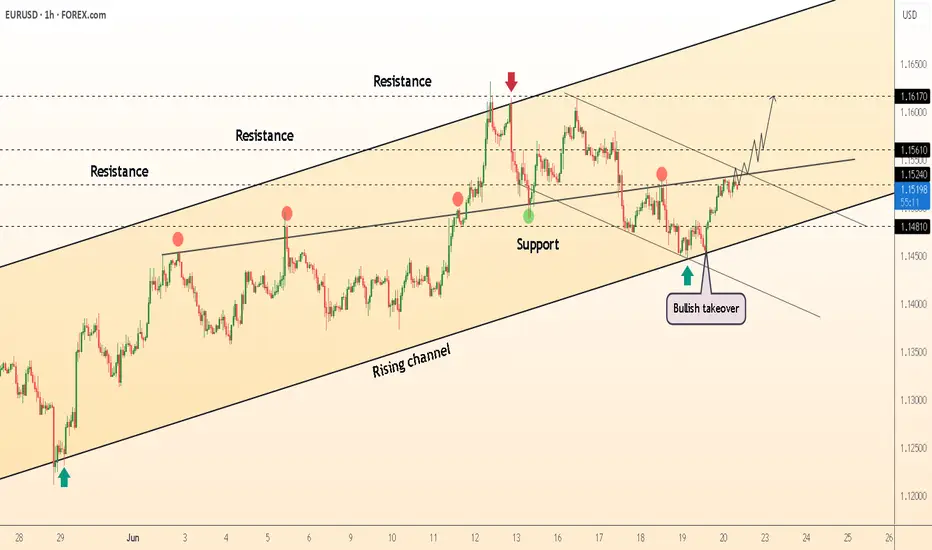
DeGRAM | EURUSD reached the resistance level📊 Technical Analysis
● Bulls defended the rising-channel mid-line (≈1.1480), turning it into support and snapping the intraday falling wedge; hourly closes now print higher highs above the reclaimed 1.1520 pivot.
● A tight bull flag is forming against 1.1560; its 1.618 swing coincides with the upper rail / 1.1617 resistance, keeping the channel’s momentum bias pointed north.
💡 Fundamental Analysis
● Softer US housing starts and a slide in 2-yr yields pulled the DXY to two-week lows, while ECB’s Knot warned “premature cuts risk inflation flare-ups,” widening the short-rate gap in the euro’s favour.
✨ Summary
Long 1.1515-1.1530; flag break >1.1560 targets 1.1617, stretch 1.1670. Bias void on an H1 close below 1.1480.
-------------------
Share your opinion in the comments and support the idea with a like. Thanks for your support
EURUSD Bullish trend breakdown ahead selling possible shortEUR/USD Technical Breakdown 🚨
The bullish trendline has been broken, along with the descending triangle support — signaling a potential shift in momentum. 📉
🔍 Entry Level: 1.14800 (Previous Resistance)
🎯 Target Zones: 1️⃣ 1.14300 – Key Demand Zone
2️⃣ 1.14000 – Next Demand Area
3️⃣ 1.13800 – Bullish Order Block (OB)
📊 Timeframe: 1H
We're watching price action closely as it approaches these zones — expect reactions! ⚠️
💬 Drop your thoughts in the

Long trade
📍 Pair: EURUSD
📅 Date: Tuesday, June 17, 2025
🕒 Time: 3:00 PM (NY Session PM)
⏱ Time Frame: 1 Hour
📈 Direction: Buyside
📊 Trade Breakdown:
Entry Price 1.14816
Profit Level 1.15696 (+0.77%)
Stop Loss 1.14640 (−0.15%)
Risk-Reward
Ratio 5:1
🧠 Context / Trade Notes:
1H Structure Entry:
Trade initiated at a key bullish order block on the 1hr timeframe, following higher-timeframe trend alignment.

EUR/USD – Technical Price Forecast🔍 EUR/USD – Technical Price Forecast
As of June 18, 2025
Current Price: 1.15040
Bias: Bearish (Short-term)
Timeframe Context: Likely 4H or Daily
🧩 Market Structure Breakdown
🔺 Trend Context
Primary Trend (recent weeks): Bullish impulse from early June
Current Phase: Retracement / potential reversal
⬇️ Recent Price Action
Lower highs forming (arrows mark swing failure at ~1.1650 and ~1.1600).
Price has broken market structure to the downside around 1.1550 with a strong bearish candle.
Current retracement is weak and corrective, lacking momentum.
📐 Key Technical Levels
Level Type Observation
1.1650 Resistance Swing high / aggressive rejection
1.1600 Resistance Lower high + supply zone
1.1550 Supply zone Breakdown area
1.1500 Current zone Minor consolidation
1.1450–1.1400 Demand zone Prior accumulation zone (support)
1.1350 Next support Clean inefficiency below
📉 Liquidity & Order Flow Insight
Sell-side liquidity likely rests below 1.1400.
The recent bullish pullback appears to be a liquidity grab, not a reversal.
Imbalance created by recent bearish move remains unfilled.
📊 Candlestick Behavior
Strong bearish engulfing candle on the move from 1.1550 to 1.1480 indicates supply absorption.
Current candles are corrective and small-bodied — suggesting weak buying and potential continuation down.
🔮 Price Prediction / Forecast
Time Horizon Forecast Summary
Short-term (1–3 days) Expect minor bullish retracement to 1.1530–1.1550, followed by rejection.
Medium-term (3–7 days) Breakdown toward 1.1450, targeting liquidity below support zone.
Extended scenario If 1.1400 breaks cleanly, expect a drop toward 1.1350 and possibly 1.1300 as next support.
📌 Invalidation Level: A daily close above 1.1600 would invalidate this bearish scenario and imply further upside potential.
🧠 Strategy Implications (Pro Traders)
Sell the rally into 1.1530–1.1550 supply with stops above 1.1600.
Take profit levels:
TP1: 1.1450
TP2: 1.1400
TP3 (extension): 1.1350
Risk Management:
Risk-to-reward ratio ≥ 2:1. Confirm entry with bearish price action on lower timeframes (e.g., 1H).
⚠️ Macro Consideration
Multiple economic events approaching (U.S. and EU flags shown) — expect volatility. Hold trades cautiously around high-impact news.

EURUSD Breaks Structure: Bullish Continuation Opportunity💶 EUR/USD Analysis – Bullish Momentum Builds 📈
Taking a look at the EUR/USD on the daily chart, it’s clear the pair is currently in a strong bullish trend 🚀. Momentum has been building consistently, reflecting underlying euro strength and continued USD weakness.
🕓 On the 4H timeframe, we’ve now seen a clear shift in market structure to the upside, confirming bullish intent. Look for a continuation entry after a retracement back into equilibrium — ideally around the 50% level of the current price swing 🔄📐.
🎯 Trade Plan Idea:
Wait for price to pull back into equilibrium 🌀
Entry: Long from the discounted zone 🟩
Stop loss: Just below the recent swing low 🔻
Target: Previous high as a logical take-profit zone 🎯📊
⚠️ Disclaimer:
This content is for educational and informational purposes only and should not be considered financial advice. Always do your own research and consult with a qualified financial advisor before making any trading decisions. 📚💼

Price action Looks like these trade have changed as I'm looking at eurusd I see trand is still bullish the last break of structure is on upside

20.06.25 Morning ForecastPairs on Watch -
FX:EURJPY
FX:EURNZD
FX:EURUSD
A short overview of the instruments I am looking at for today, multi-timeframe analysis down to what I will be looking at for an entry. Enjoy!
