EURUSD: TRADE WHAT YOU SEEThis current price has a history... that's why i advice people to navigate the market like an elephant .... watch howmany times price fell from this level in the past and how many pacent it dropped ...use a line ..do your analysis based on history...if it breacks that level ..its going straight to -61.8 or straight to the monthly trendline ...
EURUSD_SPT trade ideas

EURUSD: TRADE WHAT YOU SEEThis current price has a history... that's why i advice people to navigate the market like an elephant .... watch howmany times price fell from this level in the past and how many pacent it dropped ...use a line ..do your analysis based on history...if it breacks that level ..its going straight to -61.8 or straight to the monthly trendline ...

EURUSD: TRADE WHAT YOU SEEThis current price has a history... that's why i advice people to navigate the market like an elephant .... watch howmany times price fell from this level in the past and how many pacent it dropped ...use a line ..do your analysis based on history...if it breacks that level ..its going straight to -61.8 or straight to the monthly trendline ..

SELL EURUSDEURUSD: We should see declination in price from this are 1,6 towards 1,4.
Sell 1.5690
Take Profit 1,14151
Pattern: Double Bottom

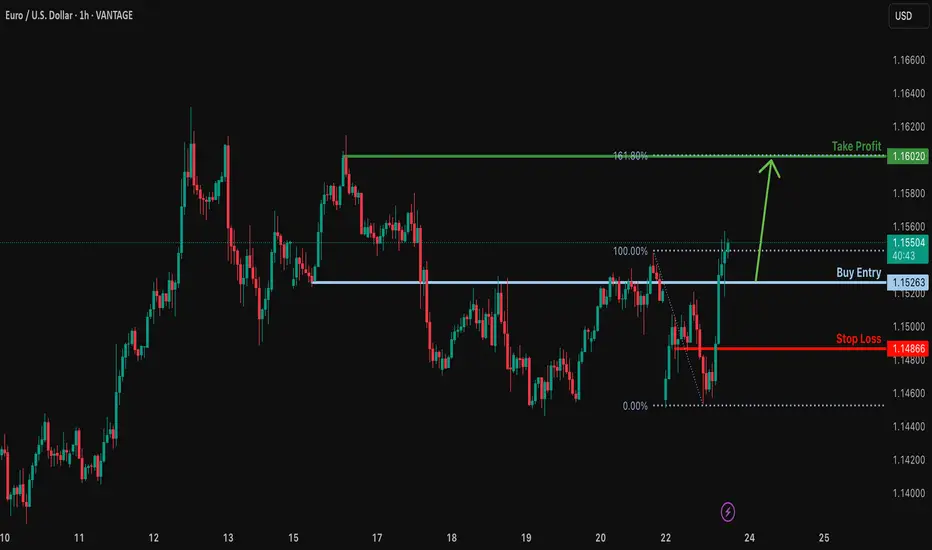
Bullish rise?EUR/USD is falling towards the support level which is an overlap support and could bounce from this level too ur take profit.
Entry: 1.1526
Why we like it:
There is an overlap support level.
Stop loss: 1.1486
Why we like it:
There is a pullback support level.
Take profit: 1.1602
Why we like it:
There is a pullback resistance level that aligns with the 161.8% Fibonacci extension.
Enjoying your TradingView experience? Review us!
Please be advised that the information presented on TradingView is provided to Vantage (‘Vantage Global Limited’, ‘we’) by a third-party provider (‘Everest Fortune Group’). Please be reminded that you are solely responsible for the trading decisions on your account. There is a very high degree of risk involved in trading. Any information and/or content is intended entirely for research, educational and informational purposes only and does not constitute investment or consultation advice or investment strategy. The information is not tailored to the investment needs of any specific person and therefore does not involve a consideration of any of the investment objectives, financial situation or needs of any viewer that may receive it. Kindly also note that past performance is not a reliable indicator of future results. Actual results may differ materially from those anticipated in forward-looking or past performance statements. We assume no liability as to the accuracy or completeness of any of the information and/or content provided herein and the Company cannot be held responsible for any omission, mistake nor for any loss or damage including without limitation to any loss of profit which may arise from reliance on any information supplied by Everest Fortune Group.
EURUSD SHORT TRADE IDEAAfter seeing some bearish pressure, we can look to enter a short trade after waiting for confirmation
LT trade: Short EU til the rest of the yearFire may burns to the europe continent. price is reaching a hypothetical resistance, it may shoot up these days and heads down

EURUSD Channel Up formed bottom. Heavily bullish.The EURUSD pair has been trading within a Channel Up since the May 12 Low. Today it hit its 4H MA100 (green trend-line) for the first time since May 12 and having just broken also above its 4H MA50 (blue trend-line), it confirmed that the pattern has already priced its bottom.
This is initiating the new Bullish Leg and based on the previous two, it should grow by at least +3.21%. We have a modest short-term Target at 1.1800.
-------------------------------------------------------------------------------
** Please LIKE 👍, FOLLOW ✅, SHARE 🙌 and COMMENT ✍ if you enjoy this idea! Also share your ideas and charts in the comments section below! This is best way to keep it relevant, support us, keep the content here free and allow the idea to reach as many people as possible. **
-------------------------------------------------------------------------------
Disclosure: I am part of Trade Nation's Influencer program and receive a monthly fee for using their TradingView charts in my analysis.
💸💸💸💸💸💸
👇 👇 👇 👇 👇 👇

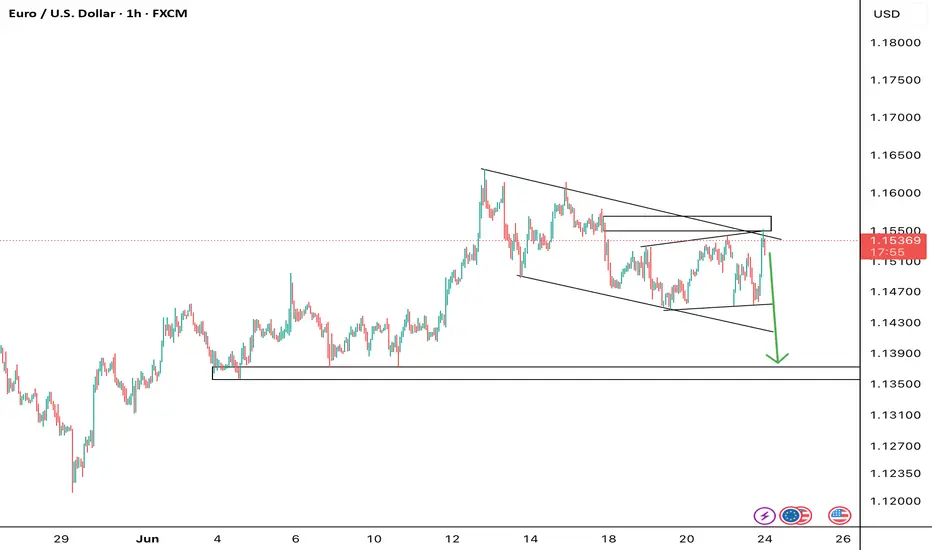
EURUSD: Bears Will Push Lower
The analysis of the EURUSD chart clearly shows us that the pair is finally about to tank due to the rising pressure from the sellers.
Disclosure: I am part of Trade Nation's Influencer program and receive a monthly fee for using their TradingView charts in my analysis.
❤️ Please, support our work with like & comment! ❤️

EURUSD: Local Bearish Bias! Short!
My dear friends,
Today we will analyse EURUSD together☺️
The in-trend continuation seems likely as the current long-term trend appears to be strong, and price is holding below a key level of 1.15261 So a bearish continuation seems plausible, targeting the next low. We should enter on confirmation, and place a stop-loss beyond the recent swing level.
❤️Sending you lots of Love and Hugs❤️
EURUSD is moving within the 1.14000 - 1.16100 range👀 Possible scenario:
The euro fell toward 1.14600 on June 23 as safe-haven flows boosted the U.S. dollar following surprise U.S. airstrikes on Iranian nuclear sites. Markets had hoped for diplomacy after Trump previously hinted at a delayed decision.
Investors remain cautious amid fears of retaliation or oil supply disruptions, lifting demand for dollar assets. Focus now turns to eurozone and U.S. PMI data. Weak European readings could push EUR/USD lower, while strong results may spark a rebound toward 1.15400.
✅ Support and Resistance Levels
Now, the support level is located at 1.14000
Resistance level is located at 1.16100

EUR/USD 2-Hour Chart Analysis2-hour candlestick chart for the Euro/U.S. Dollar (EUR/USD) currency pair, sourced from OANDA, as of June 23, 2025. The current exchange rate is 1.14705, reflecting a 0.45% decrease (-0.00517). The chart highlights recent price movements, with a marked resistance zone around 1.15218 and a support zone near 1.14483. An upward trend is indicated with an arrow, suggesting potential price action toward the resistance level.

Euro – Eyes 1.15400, Awaits Powell's ToneEuro has just filled a GAP and rebounded strongly from the FVG zone around 1.14500. It is now approaching the 1.15400 resistance area, where a descending trendline intersects with a supply FVG. The bullish momentum remains intact within the short-term correction channel, but a rejection at this level could trigger a pullback.
On the news front, US Flash Manufacturing PMI is expected to decline, while Fed Chair Jerome Powell is set to testify this week. If he adopts a dovish tone, the USD may weaken further, potentially giving EURUSD the push it needs to break through resistance.
Strategy: Wait for a clear breakout above 1.15400 to confirm further upside. If rejected, watch the 1.14000 zone as a key support.
EU bias idea Expecting something like this to playout on eu keeping in view the bullish bias of dxy which resulted due to its failure to close below the W/M fvg. Can playout during pmi release as well.
DYOR

EURUSD Is Going Down! Sell!
Please, check our technical outlook for EURUSD.
Time Frame: 1h
Current Trend: Bearish
Sentiment: Overbought (based on 7-period RSI)
Forecast: Bearish
The price is testing a key resistance 1.146.
Taking into consideration the current market trend & overbought RSI, chances will be high to see a bearish movement to the downside at least to 1.143 level.
P.S
Overbought describes a period of time where there has been a significant and consistent upward move in price over a period of time without much pullback.
Disclosure: I am part of Trade Nation's Influencer program and receive a monthly fee for using their TradingView charts in my analysis.
Like and subscribe and comment my ideas if you enjoy them!

Eurusd quick scalp Missed first entry anticipated the pullback for a re-entry and market did just that. Holding till TP for a good 1:3.5 👌

EURUSD Long As the war escalated over the weekend market gapped during Asia session invalidating our initial forecast. (Linked Idea). Looking for the long on EURUSD.

EUR/USD tests 20 EMA, Lower band of channelEUR/USD ran into resistance at 1.1630 before easing back below 1.15. However, EUR/USD continues to trade in its rising channel, holding above its 20 and 50 SMA for now. The RSI is pointing lower, suggesting momentum is losing steam.
Immediate support is at 1.1450, the 20 SMA, and the lower band of the rising channel is being tested following weak EZ PMIs and as the USD is the safe-haven of choice amid Middle East tensions. A break below here could open the door to 1.14 and 1.1280.
Buyers will look to rise back above 1.15 and 1.1580 to bring 1.1630 and fresh multi-year highs into focus.
FC

Bottom in for the dollar against the EuroI know many people are calling for the decline of the dollar and to invest in Europe, but the chart shows a different picture.
The chart shows that the dollar has bottomed against the Euro and looks set to make a run at the highs.
I think over the coming months/years, the dollar will go back above par against the Euro and will likely outperform the Euro for the coming years.
The recent decline in the dollar was just to backtest support, and now that we have done that, I think the bottom is in.
Breaking above the trend line should accelerate the bullish move.

Mechanical rangesMany traders will talk about things like "Smart Money Concepts" (SMC) and think they have found something new.
The truth is, everything in trading stems back to Liquidity.
There is no "Algo" nobody is out to get you specifically. The market is always right, where you position yourself is your own choice.
I have written several posts on mechanical trading, recorded a number of streams. The more mechanical you can make the process, the less the emotions have a chance to kick your ass.
Let me give you a very simple method of being able to identify the ranges. Ignore the timeframes as this will work on any of them, on most instruments. (I say most, as some behave differently due to how it attracts liquidity). Lets assume high end crypto such as Bitcoin (BTC) and of course Forex in the general sense, stocks, commodities etc.
This is simple - only 2 rules.
You start by zooming out and giving yourself a general feel for the trend.
Let's say this looks to be an uptrend - we now need to understand the rules.
An opposing candle can simply be defined by a different colour. If the trend is up (Green) and we see a red candle - then it's an opposing candle.
The inverse is true, if we are down and the trend is Red. Then a Green candle would be opposing.
This is only half of the story. The second rule is a pullback candle or even a sequence of candles. This simply means either the very same opposing candle that doesn't make a new high or low (depending on the trend up not making fresh highs or down not taking new lows).
In this image, you can see we have in one candle both an opposing and pullback in one candle. This means we can now mark the high of the range. Working backwards to identify the swing range low.
This easy method means I can draw a range exactly the same and mechanically every single time.
Giving me a mechanical range.
We could then get a lot more technical by looking for liquidity, 50% of the range or places such as supply or demand areas.
But these are all for other posts.
For now, getting a range on the higher timeframes means you can work down and down into a timeframe you are likely to want to trade on.
These ranges will give clues to draws and runs of liquidity.
This will also help identify changes in the character and fresh breaks of structure.
Here's another post I posted on the mechanical structures and techniques.
More in the next post.
Have a great week!
Disclaimer
This idea does not constitute as financial advice. It is for educational purposes only, our principal trader has over 25 years' experience in stocks, ETF's, and Forex. Hence each trade setup might have different hold times, entry or exit conditions, and will vary from the post/idea shared here. You can use the information from this post to make your own trading plan for the instrument discussed. Trading carries a risk; a high percentage of retail traders lose money. Please keep this in mind when entering any trade. Stay safe.

EURUSD | m15 supply playPrice broke structure with a clean CHoCH, then pulled back into a refined M15 supply zone. After rejecting the imbalance area, I executed a short aiming for the next liquidity pool below 1.14250.
🧩 Confluences:
CHoCH + Lower High confirmation 🔁
Supply zone entry + FVG rejection
3-candle mitigation + bearish pressure returning
🎯 Target: 1.14050
❌ SL above: 1.14830
“Structure breaks first, then price tells the story. Patience pays.” 🔥📉

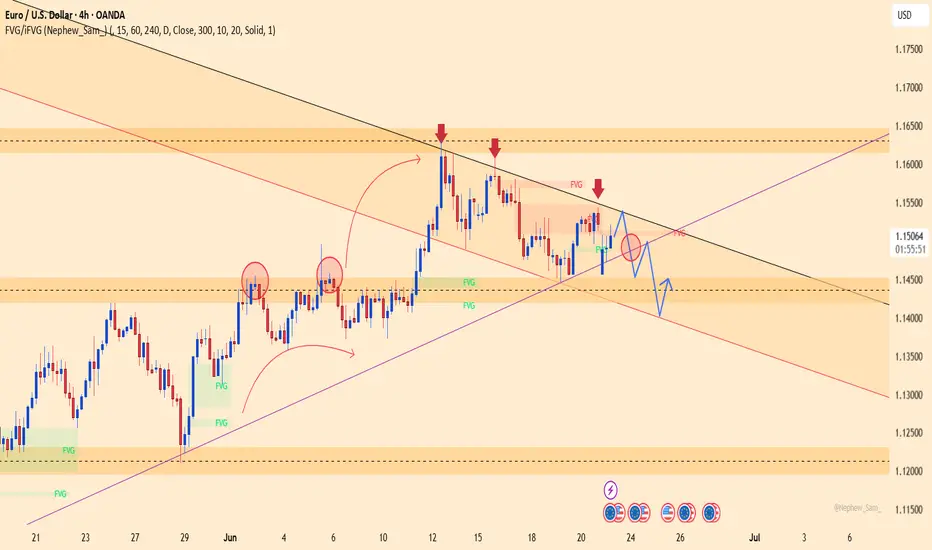
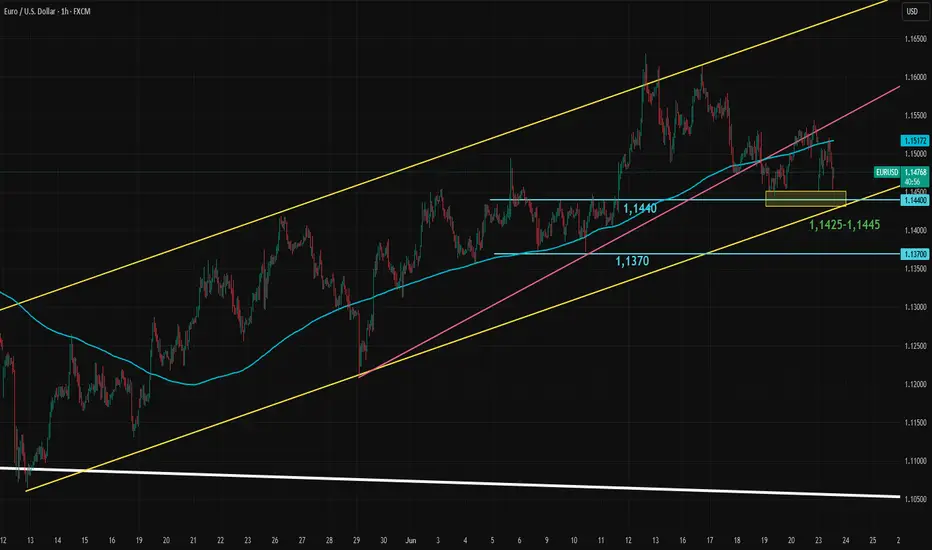
EURUSD Outlook at Risk of Changing in the Short and Medium TermEURUSD is feeling the bearish pressure as geopolitical tensions in the Middle East escalate. These risks are driving traders toward safe havens, particularly the US dollar and US government debt, which still serve as the backbone of global reserves. The sharp decline in the dollar in recent months has added to this dynamic, but it’s not over yet for euro bulls in all the short, medium, and long term.
However, the options market is flashing a rare bearish signal for EURUSD that traders should not ignore. Risk reversals across all maturities from 1 week to 1 year are falling. The 1-week risk reversal dropped sharply from 0.1075 to -1.10 since last Monday, one of the steepest moves seen recently, even though EURUSD itself has remained relatively flat.
The breakout and successful retest of the long-term downtrend from 2008 to 2025 was a key turning point. As long as EURUSD stays above this trendline, dips are likely to be seen as buying opportunities by long-term investors.
For the medium term, however, a bearish signal (for EURUSD) has emerged from the dollar index. The index broke out of the wedge formation (update the post above to see), retested it, and has since resumed its upward move, creating a strong bullish technical setup.
Now, everything comes down to short-term support. EURUSD has been in an upward trend channel since the retest of the long-term trendline and had also formed a shorter-term trend within that channel. This shorter trendline has now broken and been retested. The next critical level is the 1.1425–1.1440 support zone. If this area fails to hold, it could shift both the short- and medium-term direction to the downside.
Note: In this post, "short term" refers to up to one week, "medium term" to one to several weeks, and "long term" to several months to a few years.
EURUSD After filling a gap there which acted as our imbalance area of interest. We anticipate for price to continue shorting.
