EURUSD Outlook at Risk of Changing in the Short and Medium TermEURUSD is feeling the bearish pressure as geopolitical tensions in the Middle East escalate. These risks are driving traders toward safe havens, particularly the US dollar and US government debt, which still serve as the backbone of global reserves. The sharp decline in the dollar in recent months has added to this dynamic, but it’s not over yet for euro bulls in all the short, medium, and long term.
However, the options market is flashing a rare bearish signal for EURUSD that traders should not ignore. Risk reversals across all maturities from 1 week to 1 year are falling. The 1-week risk reversal dropped sharply from 0.1075 to -1.10 since last Monday, one of the steepest moves seen recently, even though EURUSD itself has remained relatively flat.
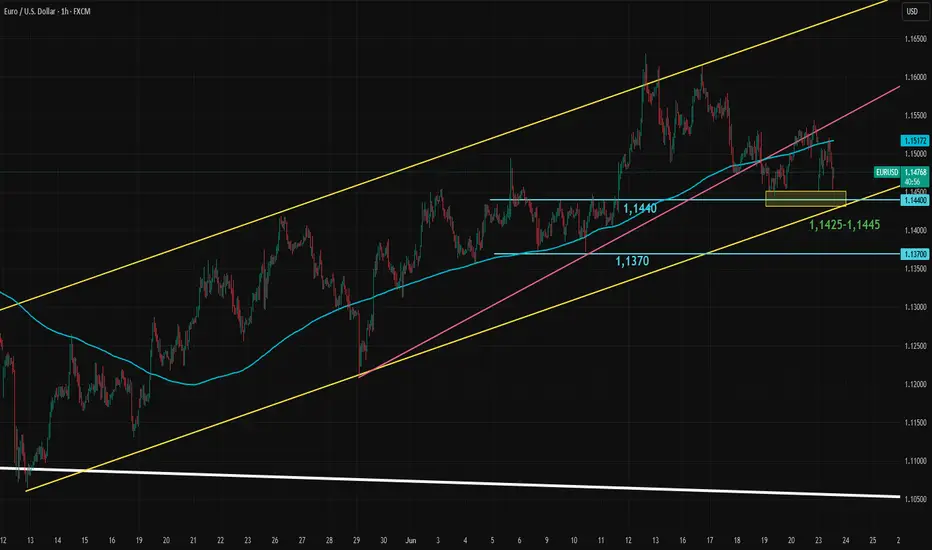
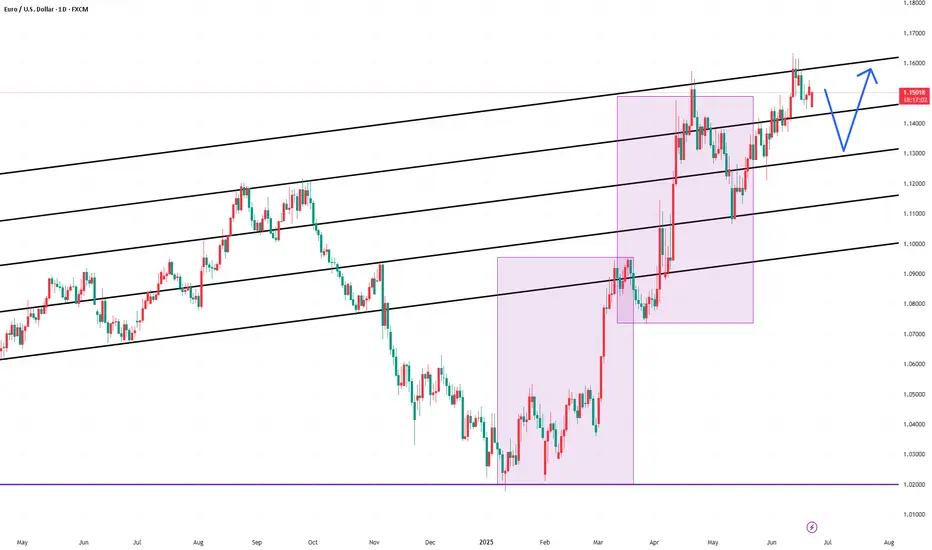
The breakout and successful retest of the long-term downtrend from 2008 to 2025 was a key turning point. As long as EURUSD stays above this trendline, dips are likely to be seen as buying opportunities by long-term investors.
For the medium term, however, a bearish signal (for EURUSD) has emerged from the dollar index. The index broke out of the wedge formation (update the post above to see), retested it, and has since resumed its upward move, creating a strong bullish technical setup.
Now, everything comes down to short-term support. EURUSD has been in an upward trend channel since the retest of the long-term trendline and had also formed a shorter-term trend within that channel. This shorter trendline has now broken and been retested. The next critical level is the 1.1425–1.1440 support zone. If this area fails to hold, it could shift both the short- and medium-term direction to the downside.
Note: In this post, "short term" refers to up to one week, "medium term" to one to several weeks, and "long term" to several months to a few years.
EURUSD_SPT trade ideas
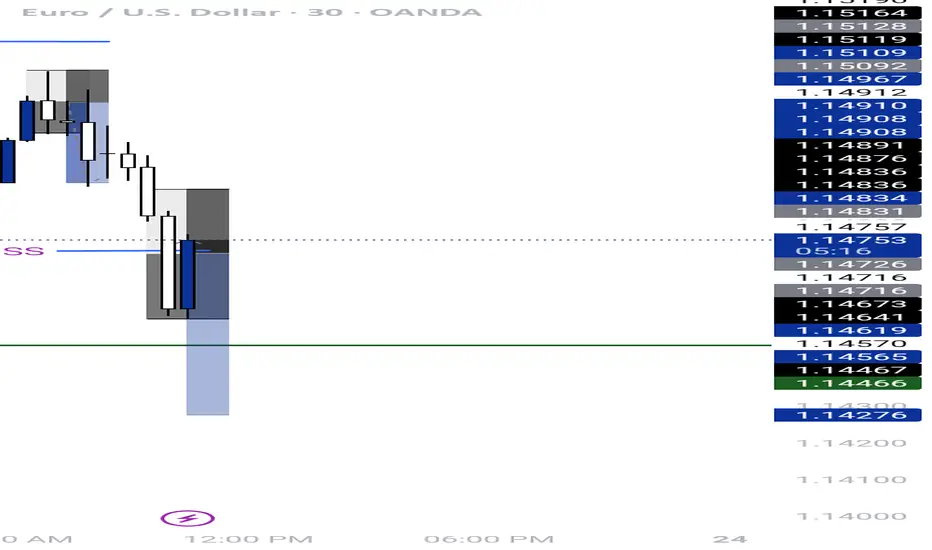
EURUSD After filling a gap there which acted as our imbalance area of interest. We anticipate for price to continue shorting.

EUR/USDScenario 1: Bullish Reversal (If current FVG support holds)
Bias: Short-term bullish, looking for a continuation of the bounce.
Rationale: The price responded positively to an earlier low and is completing an FVG at this juncture. If this FVG is supported and the price breaks out above the latest bullish order block, then a reversal may be signaled.
Entry: Wait for a clear break and test back to the current high range or a demonstrated bullish candle pattern in the FVG area being filled. An entry might be at about 1.1520-1.1530 should confirmation be observed.
Target: The following big resistance level, which could be the liquidity pool ($S) at 1.1540, and thereafter, at 1.1580-1.1600, the
Stop-Loss: Below recent low or an important support level, i.e., below 1.1500 or current Bullish OB.
Scenario 2: Continuing Bearish Pressure (In case current FVG gets filled and it fails to hold)
Bias: Short-term bearish, expecting to see a continuation of the downtrend after the FVG is filled.
Rationale: If it extends this ongoing FVG and then shows signs towards rejection (e.g., bearish candlestick patterns, failure to break through resistances), it could be signaling continuation in the prior downtrend.
Entry: Look for bearish confirmation after the FVG fills, which would be a break down through the newest low or low side of the current range. Potential entry would be at 1.1500-1.1510 on a confirmed break down.
Target: The "Bullish OB" around 1.1440-1.1450, and potentially the lower FVG around 1.1400.
Stop-Loss: At or higher than the newest swing top or key level of resistance, e.g. 1.1530-1.1540
Relevant Factors:
Risk Management: You should always use appropriate position sizing and use a stop-loss to manage your risk.
Confirmation: Hold out for firm price action confirmation before entering any trade.
News Events: Be aware of any scheduled economic news releases or events that could impact EUR/USD, potentially creating huge volatility.
Bigger Timeframes: Always consider the bigger picture context (i.e., day, week) in order to obtain a general trend.

Euro Poised for Upside: Will $1.18 Be the Next Key Level?Targets:
- T1 = $1.17075
- T2 = $1.18075
Stop Levels:
- S1 = $1.14075
- S2 = $1.13075
**Wisdom of Professional Traders:**
This analysis synthesizes insights from thousands of professional traders and market experts, leveraging collective intelligence to identify high-probability trade setups. The wisdom of crowds principle suggests that aggregated market perspectives from experienced professionals often outperform individual forecasts, reducing cognitive biases and highlighting consensus opportunities in Euro.
**Key Insights:**
The Euro is currently positioned for potential upside, supported by the European Central Bank's (ECB) cautious approach to monetary policy. ECB President Christine Lagarde’s statements regarding inflation targeting have reinforced confidence in the currency, creating a stable outlook amidst broader global uncertainty. Additionally, improvements in European economic data—particularly stronger-than-expected manufacturing PMI figures—have increased bullish sentiment among professional traders. Forex traders are closely watching upcoming inflation reports and employment statistics for additional confirmation of a continued uptrend.
Technical indicators, such as rising Relative Strength Index (RSI) levels and bullish moving average crossovers, suggest further upside momentum. Breakouts above psychological levels, such as $1.17000, could drive stronger buying activity and potentially pave the way for the Euro to test higher resistance levels.
**Recent Performance:**
The Euro has demonstrated resilience in recent weeks, hovering around the $1.15075 mark. Despite fluctuations due to mixed signals from equity and bond markets, the Euro has benefited from safe-haven inflows as geopolitical tensions brew in other parts of the world. Additionally, its stability has kept it among the top-performing currencies within the G10 forex universe.
**Expert Analysis:**
Forex market analysts are broadly in agreement about the potential near-term strength of the Euro. The ECB’s patient approach to monetary tightening is seen as providing a consistent support mechanism for the currency. Furthermore, the Euro has gained traction against traditionally weaker currencies such as the Japanese Yen and the British Pound, presenting further arbitrage opportunities for traders.
Technicians point to the importance of $1.17000 as a crucial level to test before further gains can be realized. A confirmed breakout could lead to extended upside, potentially reaching $1.18 or more. However, downside risks remain, especially if the Dollar strengthens unexpectedly due to hawkish Federal Reserve policy or significant geopolitical escalations.
**News Impact:**
Recent news surrounding improved trade agreements between the UK and Europe has reduced uncertainty and supported the Euro as bullish sentiment grows. However, traders should remain cautious of geopolitical risks, including recent tensions in the Middle East, which could create safe-haven flows into other currencies like the Swiss Franc or US Dollar. Regulatory challenges facing US technology firms in Europe are also shaping broader equity movements that could indirectly influence the Euro's performance.
**Trading Recommendation:**
Based on bullish sentiment from professional traders, improved technical metrics, and the ECB’s supportive policies, we recommend a LONG position on Euro. The current price action suggests the probability of an upside breakout, with targets of $1.17 and $1.18 offering potential rewards. Ensure stops are placed thoughtfully within the levels outlined to mitigate risks from broader market volatility. This trade provides a promising opportunity to capitalize on the Euro’s relative strength.

Sell allerst on EURUSD On my analysis I saw that price market structure has been shifted from an uptrend to an downtrend, so I look to trade the market structure shift, by taking on the candle violation block, so I am in for a sell join me, just 20 pips risk for 45 pips profit a 1:2.5 RR let's stay profitable guys it's a new week.
EUR/USD analysis and pending orderTwo days ago, there was a FED meeting, where it was stated that the benchmark interest rate will be kept at 4.25-4.50% level.
What is important is what they told - the expectations - economicp rojections are lower, and inflation is higher.
Maybe they’ll decrease rates in future?
Right now, it’s not so important. It’s summer already, and by the old “Sell in May, and go aways” mentality, I don’t expect some huge impact on the market.
I know… Iran, Israel, Trump, maybe even Putin? Anybody can do some stupit stuff and everything can go to Hell.
And it’s Friday, not very smart time to open trades, so I’m putting pending order.
I decided for EUR/USD.
Timeframe is 4h.
On my chart I can see clear uptrend in the last couple of weeks, especially in the last 3 months.
Also, I see lower highs.
Upward trend is breached… Where it could stop?
Overall, I don’t expect the pair will come near parity, even though ECB lowered rates before FED did.
But some “selloff”, probably.
I used good old Fibonacci, draw it, and the price could potentialy drop to 50% level or even ideal 61…8%-78.6% zone.
Pending entry: 1.15577
TP: 1.12645
SL: 1.1671
If it activates today, I’ll leave it over the weekend.

Trump’s Strike on Iran Lifts Dollar, Weighs on EuroEUR/USD dipped to around 1.1480 in early Asian trading Monday as the dollar strengthens following President Trump’s decision to join Israel’s war on Iran, escalating the conflict. Over the weekend, US forces struck three Iranian nuclear sites; Fordo, Natanz, and Isfahan. Trump claimed the facilities were “totally obliterated” and warned of harsher attacks unless Iran seeks peace. The escalation supports safe-haven demand for the dollar, pressuring EUR/USD.
Meanwhile, the ECB cut rates for the eighth time this year but signaled a pause in July. President Lagarde said cuts are nearing an end, which may help limit euro losses.
Resistance is located at 1.1530, while support is seen at 1.1450
EURUSD LONG FORECAST Q2 W26 D23 Y25EURUSD LONG FORECAST Q2 W26 D23 Y25
Professional Risk Managers👋
Welcome back to another FRGNT chart update📈
Diving into some Forex setups using predominantly higher time frame order blocks alongside confirmation breaks of structure.
Let’s see what price action is telling us today!
💡Here are some trade confluences📝
✅Daily order block
✅15' order block
✅Intraday breaks of structure
✅4H Order block
🔑 Remember, to participate in trading comes always with a degree of risk, therefore as professional risk managers it remains vital that we stick to our risk management plan as well as our trading strategies.
📈The rest, we leave to the balance of probabilities.
💡Fail to plan. Plan to fail.
🏆It has always been that simple.
❤️Good luck with your trading journey, I shall see you at the very top.
🎯Trade consistent, FRGNT X

EURUSD BuyThe buy zone has been shown in the chart . We will see the market structure and rejections at the zone at LTF and then we will enter.
Please follow to support me .
Thank you !

23.06.25 Morning ForecastPairs on Watch -
FX:EURAUD
FX:EURNZD
FX:EURUSD
A short overview of the instruments I am looking at for today, multi-timeframe analysis down to what I will be looking at for an entry. Enjoy!

Fundamental Market Analysis for June 23, 2025 EURUSDThe EUR/USD exchange rate fell to around 1.14900 at the start of the Asian session on Monday. The US dollar is strengthening against the euro (EUR) amid US President Donald Trump's decision to join Israel's war against Iran, which has sharply escalated the conflict. Traders will closely monitor developments surrounding the conflict in the Middle East.
Over the weekend, the US entered the conflict between Israel and Iran when American military aircraft and submarines struck three Iranian targets in Iran, Fordow, Natanz, and Isfahan. Trump said Iran's key uranium enrichment facilities had been “totally destroyed” and warned of “much more severe” strikes if Iran did not agree to peace. The rise in tensions following the US bombing of Iranian nuclear facilities is contributing to the rise in safe-haven currencies such as the US dollar and is having a negative impact on the major currency pair.
Earlier this month, the European Central Bank (ECB) cut interest rates for the eighth time this year to support the eurozone's sluggish recovery, but made it clear that there would be a pause in July. ECB President Christine Lagarde said that rate cuts are coming to an end, as the central bank is now “well positioned” to deal with the current uncertainty. The ECB's hawkish tone may help limit the euro's losses in the near term.
Trading recommendation: BUY 1.15000, SL 1.14600, TP 1.15800

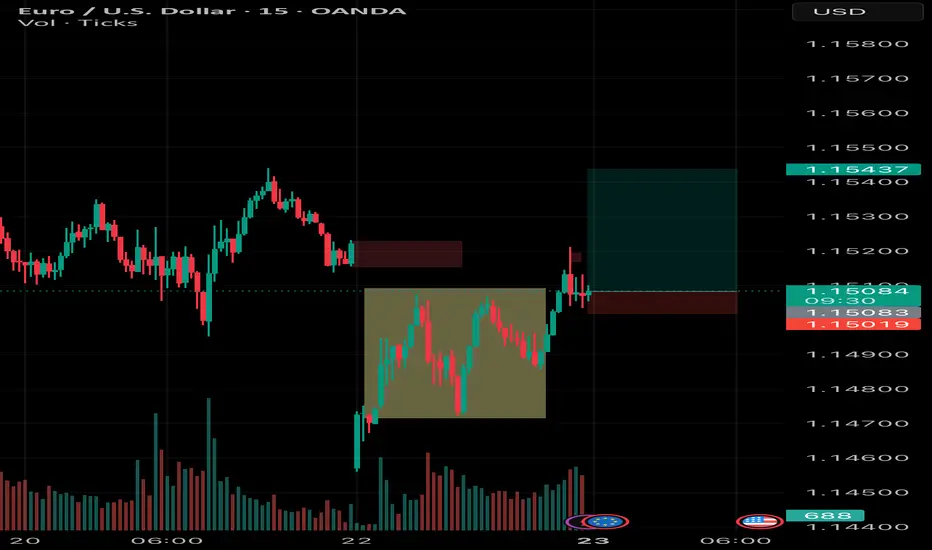
EURUSD BuyAsia session had the inducement. As we are entering London session, price should continue upward toward next liquidity point.
EURUSD: the PCE on scheduleThe FOMC meeting was the main event watched closely by investors during the previous week. The Fed left rates unchanged, as was widely expected, but still counted on two 25bps cuts till the end of this year. The main information was related to the effects of implemented trade tariffs by the US Administration, for which the Fed expects to be reflected on the economy in the coming period. Inflation is the main concern in this sense, however, it could be only a one-off effect. The Fed continues to be data-driven when it comes to their decision.
As for other macro data posted during the previous week, the Retail Sales in May dropped by -0,9% for the month, which was higher from expected -0,7%. The Industrial Production in May also dropped by -0,2% on a monthly basis, bringing the indicator to the level of 0,6% compared to the previous year. Both figures were lower from market estimates. The Building Permits preliminary in May reached 1.393M, lower from forecasted 1,43M. At the same time Housing Starts in May reached the number of 1.256M, again lower from estimated 1,36M.
The ZEW Economic Sentiment Index in June for Germany was standing at the level of 47,5, higher from market estimate of 35. The same index for the Euro Zone was at the level of 35,3, again higher from forecasted 23,5. The Inflation Rate final in May for the Euro Zone was at the level of 0% for the month and 1,9% on a yearly basis, and without changes from the previous post. The Producers Price Index in Germany in May dropped by -0,2% for the month and -1,2% for the year.
As Middle East tensions have already been priced by markets, the previous week's focus was on the Fed. The market reaction on the news was not stronger as all known facts were already priced in. The eurusd was moving in a range between 1,1613 and 1,1448 during the week. The currency pair is closing the week at the level of 1,1523. The RSI is moving closer to the overbought market side, ending the week at the level of 59. The MA50 continues to diverge from MA200, without an indication of a forthcoming potential cross.
For the week ahead, charts are pointing toward both directions, with equal probabilities. On one side, there is a potential that the currency pair will most likely test the 1,16 level for one more time, but charts are not pointing toward the potential for higher grounds, at this moment. On the opposite side, there is probability that the 1,1450 will be tested for one more time, but the targeting levels will most probably be between 1,1420 and 1,1380. In every case, fundamentals to be watched in a week ahead are the May PCE data on Friday and Fed Chair Powell`s testimony in front of the Congress on Tuesday and Wednesday. These two events might bring higher volatility in case that new information emerges, which was up to now unknown to markets.
Important news to watch during the week ahead are:
EUR: HCOB Manufacturing PMI flash for June in Germany and the Euro Zone, Ifo Business Climate in June in Germany, GfK Consumer Confidence in July for Germany,
USD: S&P Global Composite PMI flash for June, Existing Home Sales in June, Fed Chair Powell testimony in front of the Congress on Tuesday, June 24th, Durable Goods Orders in May, GDP Growth Rate q/q final for Q1, PCE Price Index in May will be posted on Friday, June 27th.

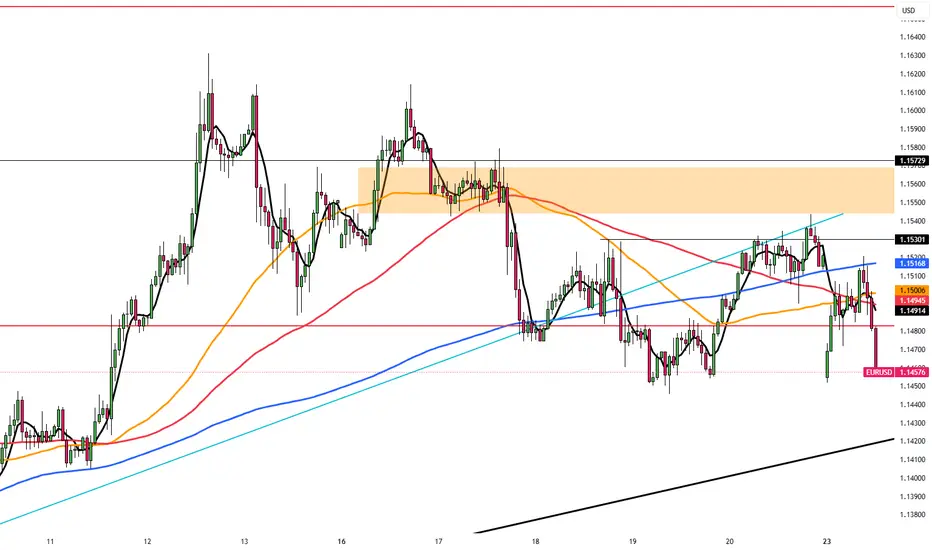
Bearish Continuation I am expecting price to continue lower from this newly formed internal supply zone with the market open gap. When the price first mitigated the daily demand zone it failed to remain bullish. Now sellers are in control of the market so I will be looking to buy only when we have MSS after the sweep of the Low.

Supply Trap Revisit Before Final Drop? | Smart Money Outlook
📉 Price has recently reacted from a strong FVG + Demand + Liquidity Start Zone (4hr) around 1.1450, confirming bullish intent temporarily.
📈 However, a corrective move is now heading into a 4hr Fair Value Gap (FVG) zone near 1.1520–1.1550, which aligns with a potential lower high setup.
Key Zones:
Supply Zone @ 1.1550 (Caution): Watch for rejection signs here—high confluence with previous imbalance.
Bearish Expectation: After liquidity grab or mitigation in FVG, expect a strong sell-off targeting the 1.1410 level (measured move and 1.618 fib extension).
⚠️ Be cautious of price pushing slightly above 1.1550 to sweep liquidity before reversing.

EURUSD Advanced Price Action PatternEURUSD is forming a price action pattern on the 5 minute timeframe, this pattern usually results in a breakout. I am thinking this breakout will be bullish and result in creating a top wick for the daily candle.

Uptrend in EURUSDEURUSD remains in a clear upward trend.
Last week, key economic events passed, but the pair failed to reach a new high.
This week, we’ll be watching for signs that the current pullback is ending and looking for potential buying opportunities.
The first support levels are the previous low and 1,1443.
The target is to test and break above the previous high!

EURUSD looking for rejection for continue BearishAs what I see, the price already touch resistance and make minor rejection.
We can stand by for swing sell, if confirmation occur at Daily timeframe.
For now, I will wait for the price at weekly zone.

EURUSD InsightWelcome, everyone!
Please feel free to share your personal thoughts in the comments. Don’t forget to hit the booster and subscribe!
Key Highlights
- Christopher Waller, a Federal Reserve Governor, stated in a CNBC interview that a rate cut in July should be considered.
- The United States has attacked three Iranian nuclear facilities located in Fordow, Natanz, and Isfahan. In response, Iran has hinted at potentially blocking the Strait of Hormuz and has warned of retaliatory action. The U.S. Department of Defense responded by warning that any retaliation would result in a much stronger counterattack.
- According to The Wall Street Journal, the Trump administration has notified that it plans to restrict the supply of U.S.-made semiconductor equipment to Samsung Electronics and SK Hynix’s factories in China.
This Week’s Key Economic Events
+ June 24: Fed Chair Jerome Powell testimony
+ June 25: Fed Chair Jerome Powell testimony
+ June 26: U.S. Q1 GDP release
+ June 27: U.S. May PCE Price Index release
EURUSD Chart Analysis
The EURUSD pair has shown a downward move after facing resistance at a recent trend high. Although it is currently experiencing a slight rebound around the 1.14500 level, the overall trend remains bearish. The next likely support level is around 1.13000, and a recovery may follow once this area is tested.
If, contrary to expectations, the price breaks above the current trend high, a new strategy will be established accordingly.
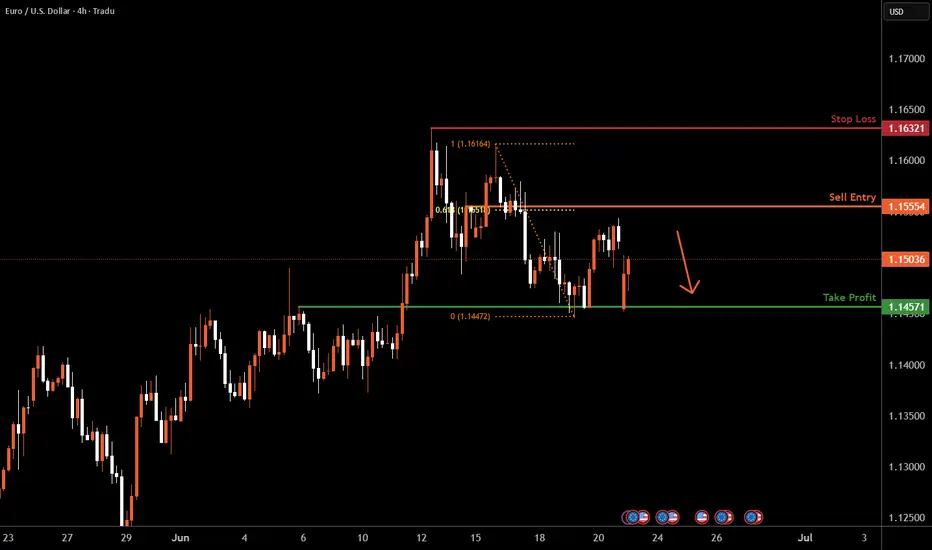
EURUSD H4 I Bearish Reversal Off the 61.8% FibBased on the H4 chart, the price is rising toward our sell entry level at 1.1555, a pullback resistance that aligns with the 61.8% Fib retracement.
Our take profit is set at 1.1457, an overlap support.
The stop loss is set at 1.1632, a swing high resistance.
High Risk Investment Warning
Trading Forex/CFDs on margin carries a high level of risk and may not be suitable for all investors. Leverage can work against you.
Stratos Markets Limited (tradu.com ):
CFDs are complex instruments and come with a high risk of losing money rapidly due to leverage. 63% of retail investor accounts lose money when trading CFDs with this provider. You should consider whether you understand how CFDs work and whether you can afford to take the high risk of losing your money.
Stratos Europe Ltd (tradu.com ):
CFDs are complex instruments and come with a high risk of losing money rapidly due to leverage. 63% of retail investor accounts lose money when trading CFDs with this provider. You should consider whether you understand how CFDs work and whether you can afford to take the high risk of losing your money.
Stratos Global LLC (tradu.com ):
Losses can exceed deposits.
Please be advised that the information presented on TradingView is provided to Tradu (‘Company’, ‘we’) by a third-party provider (‘TFA Global Pte Ltd’). Please be reminded that you are solely responsible for the trading decisions on your account. There is a very high degree of risk involved in trading. Any information and/or content is intended entirely for research, educational and informational purposes only and does not constitute investment or consultation advice or investment strategy. The information is not tailored to the investment needs of any specific person and therefore does not involve a consideration of any of the investment objectives, financial situation or needs of any viewer that may receive it. Kindly also note that past performance is not a reliable indicator of future results. Actual results may differ materially from those anticipated in forward-looking or past performance statements. We assume no liability as to the accuracy or completeness of any of the information and/or content provided herein and the Company cannot be held responsible for any omission, mistake nor for any loss or damage including without limitation to any loss of profit which may arise from reliance on any information supplied by TFA Global Pte Ltd.
The speaker(s) is neither an employee, agent nor representative of Tradu and is therefore acting independently. The opinions given are their own, constitute general market commentary, and do not constitute the opinion or advice of Tradu or any form of personal or investment advice. Tradu neither endorses nor guarantees offerings of third-party speakers, nor is Tradu responsible for the content, veracity or opinions of third-party speakers, presenters or participants.
EUR_USD RISING SUPPORT AHEAD|LONG|
✅EUR_USD is trading along the rising support
And as the pair will soon retest it
I am expecting the price to go up
To retest the supply levels above at 1.1511
LONG🚀
✅Like and subscribe to never miss a new idea!✅
Disclosure: I am part of Trade Nation's Influencer program and receive a monthly fee for using their TradingView charts in my analysis.

EURUSD Stalling—Breakout or Breakdown Next?EURUSD has been trending higher but is now flashing signs of exhaustion. While shorts remain risky without more confirmation, aggressive traders could explore them near the highs. Longs also carry increasing risk at these extended levels. Two idea paths: a cautious long continuation, or a speculative reversal trade. A clean break of key trendlines will likely invalidate short setups and resume the uptrend.

EURUSD H4 AnalysisEURUSD Showing a bullish Flag. If it breaks this zone above, Most probably can fly up to 1.15818 and higher to 1.16322. If no, Can rally between 1.14320, 1.13067 or even lower. Trading Analysis from 23-06-25 to 27-06-25. Take your risk under control and wait for market to break support or resistance on smaller time frame. Best of luck everyone and happy trading.🤗
