Market Re-Cap and Outlook for NEXT WEEKHere I am giving you a little insight as to what trades I am currently in, taken & looking to take for the week just gone and the week coming.
1 Winning trade on EU
1 Current open position on EU
EURGPB - Breakdown
AUDUSD - Breakdown
NZDUSD - Breakdown
Gold - Breakdown
If there are any pairs you would like me to share my feedback on give me a message and I will be happy to try and do so.
Thanks
Happy Hunting
EURUSD_SPT trade ideas

RSI Flashes Warning on EURUSD: Critical Level Under Watch!Good morning traders,
If the EURUSD pair breaks below the 1.16729 level due to an RSI divergence, the next potential target could be around 1.16093.
Keep in mind that a break below 1.16729 may also signal a potential trend reversal.
I've marked the pivot points for you on the chart for better clarity.
Additionally, it's crucial to keep an eye on current economic data and news releases as part of your fundamental analysis.
I meticulously prepare these analyses for you, and I sincerely appreciate your support through likes. Every like from you is my biggest motivation to continue sharing my analyses.
I’m truly grateful for each of you—love to all my followers💙💙💙

eurusd sell setup The trend on ltf is currently bearish and i have noticed a break of low plus liquidity available to grab for sells .Since its a counter trend due to HTF trend we go low risk short if given a retracement
EUR/USD Holds Above Support – Watching 1.17400 and BeyondHi Everyone,
As highlighted, a successful bounce from the near-term support at 1.16680 provided a retest of the 1.17400 zone. Looking ahead, we expect price action to revisit this level in the coming week.
A confirmed break above this resistance could open the path toward 1.18000, where we anticipate encountering dynamic resistance.
As outlined in our analysis last week, we anticipated a continued move higher toward the 1.16564 and 1.18325 levels, provided price held above 1.14483.
Price respected this level, and EUR/USD extended its rally, reaching our first key target at 1.16564 and pushing above 1.17400 — marking the highest level since February 2022.
We will provide further updates on the projected path for EUR/USD should price reach this level.
The longer-term outlook remains bullish, with expectations for the rally to extend toward the 1.2000 level, provided the price holds above the key support at 1.10649.
We will continue to update you throughout the week with how we’re managing our active ideas and positions. Thanks again for all the likes/boosts, comments and follows — we appreciate the support!
All the best for a good end to the week. Trade safe.
BluetonaFX

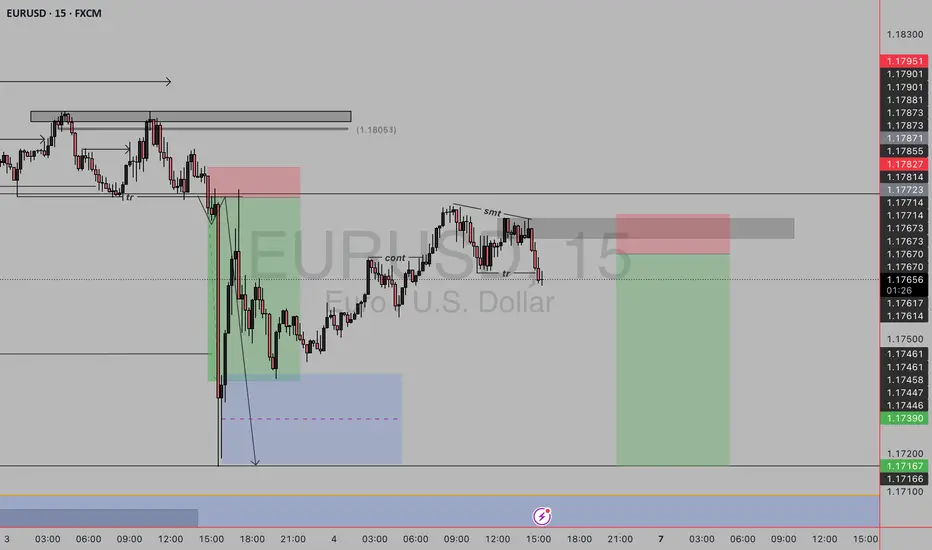
EURUSD SHORT TERM SELLOn the M15 price has given a CHOCH
Waiting patiently for a BOS to occur to ride price down to demand.
Proper risk management is advised
Keep an eye on TVC:DXY
Happy trading week.

Elliott Wave Analysis for EUR/USD - Bullish OutlookPEPPERSTONE:EURUSD
This analysis is based on the application of Elliott Wave principles for the EUR/USD market on a weekly timeframe.
💡 Wave Identification:
Corrective Cycle (ABC): After a peak marked by wave B, the market completed a 5-wave downward structure (waves 1 to 5), forming wave C, signaling a possible end of the correction.
Potential Reversal Zone (2/B): The current point is a strategic level where a bullish rebound is anticipated.
📊 Projection:
A bullish impulse is expected from point C. The initial target lies in the 1.1140 - 1.1217 zone, corresponding to key resistance levels and Fibonacci projections.
🧠 Conclusion:
A breakout above 1.0440 could confirm a significant bullish impulse, suggesting buyers are regaining control.
⚠️ Disclaimer : This analysis is not financial advice. Always conduct your own research before investing.

EURUSD..BUYAnalysis complete — scenarios outlined. The zone could be a decision point for . Price reaction here may define the next move.
If price breaks and pulls back to retest, a reversal setup might emerge.

EurUsd Scenario.This how i see eurusd for now .. Indeed Dxy is going Uppp !! While E/U is heading down .
I will see how it goes .
Hapii Trade'ing

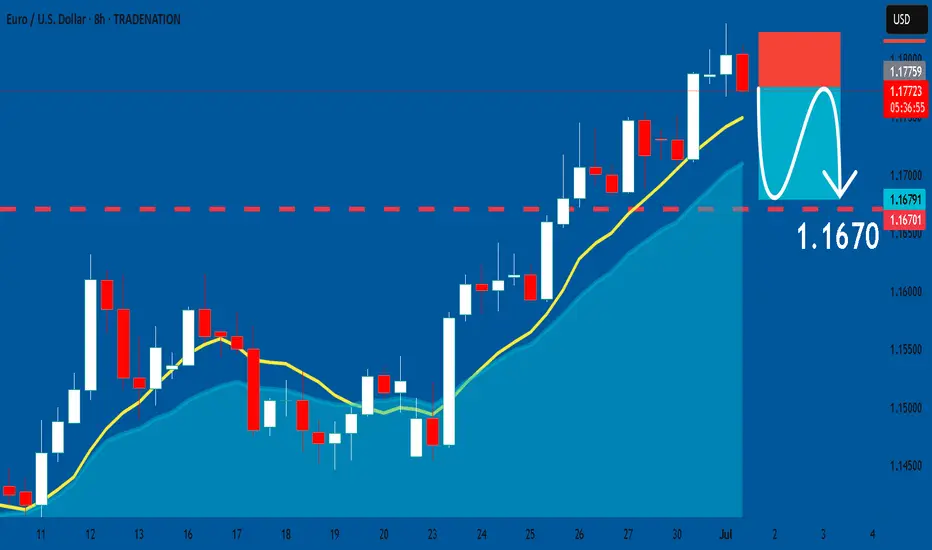
EURUSD: Short Signal Explained
EURUSD
- Classic bearish setup
- Our team expects bearish continuation
SUGGESTED TRADE:
Swing Trade
Short EURUSD
Entry Point - 1.1775
Stop Loss - 1.1822
Take Profit - 1.1670
Our Risk - 1%
Start protection of your profits from lower levels
Disclosure: I am part of Trade Nation's Influencer program and receive a monthly fee for using their TradingView charts in my analysis.
❤️ Please, support our work with like & comment! ❤️
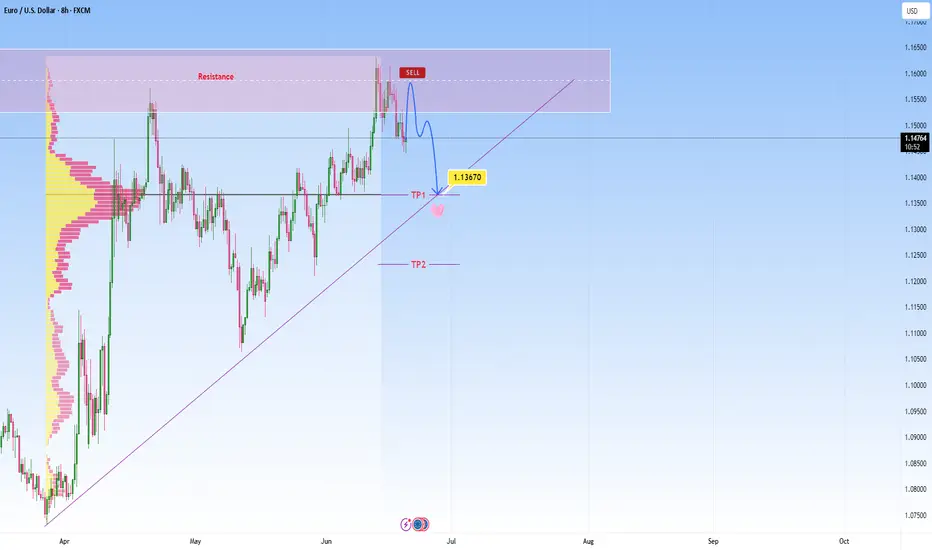
EURUSD heads towards resistance, short-term reversal expectedEURUSD has been in a strong uptrend, and we’re currently observing price action is reaching a notable resistance zone. I am watching for a reversal here as marked on my chart, not expecting a major move, but rather a short-term rejection with a downside target at around 1.13670 , which also aligns with the POC.
This is where it can become a decision point, either price finds support and bounces, or it breaks below, and that’s when we might see the move start to extend lower.
If we get a decisive breakdown through that ascending trendline, my next area of interest is marked as TP2. From there we can expect either potential accumulation or another reaction, depending on broader market sentiment at the time.
That said, we're navigating a complex backdrop currently:
The EU macro environment is under pressure, as weak economic data from Europe is contributing to cautious sentiment around the euro.
Meanwhile, a sustained USD bid continues, supported by stronger U.S. growth expectations, favorable yields, and persistent global demand. This further weighs on EURUSD.
Adding to the uncertainty, escalating tensions between Israel and Iran have rattled markets this week. This geopolitical risk could be pushing oil prices higher:
It’s important to note that if price convincingly rejects here and loses structure, especially with high volume and obvious bullish structure, this setup would become invalid. In that case, I would reassess and adapt
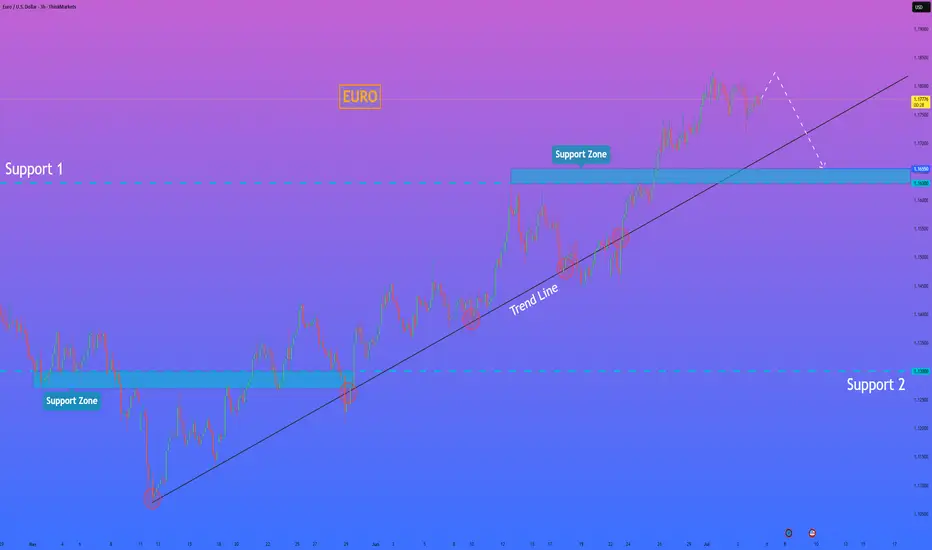
HelenP. I Euro will drop to trend line, after movement upHi folks today I'm prepared for you Euro analytics. If we look at the chart, we can see that EURUSD has been moving in a stable upward trend, supported by a clear ascending trend line. Each time the price approached this line, it rebounded and continued to grow, respecting the bullish structure. After the recent breakout from the support zone around 1.1500, the market made a strong impulse to the upside and reached a local high. Now, the momentum seems to be slowing down, which opens the possibility for a corrective movement. Given this setup, I expect that the price could first make a small upward push to trap late buyers, and then turn around to begin a decline. The trend line remains a critical technical level, and I anticipate the price will revisit it soon. For this reason, I’ve placed my goal at 1.1575 points — this area aligns with the trend line and can serve as the next support if a pullback occurs. As long as this level holds, the market remains in a bullish structure, but a correction seems likely before further growth. If you like my analytics you may support me with your like/comment.
Disclaimer: As part of ThinkMarkets’ Influencer Program, I am sponsored to share and publish their charts in my analysis.


EUR/USD: A Perfect Storm for BullsThis is a high-conviction long setup based on a powerful combination of macroeconomic divergence and a confirmed multi-year technical breakout.
The Non-Farm Payrolls report has now been released, and the resulting price dip has created what I believe is an ideal entry opportunity to align with the dominant bullish trend.
The Fundamental Why 📰
NFP Aftermath: Yesterday's NFP report was a mixed bag that ultimately reinforces the case for Fed rate cuts. The headline number beat expectations, causing an initial USD rally and a dip in EUR/USD. However, the underlying details like wage growth were soft. Crucially, the market continues to price in a 96% probability of a Fed rate cut by September, a figure that was unchanged by the data. The core driver of USD weakness—a dovish Fed—remains firmly intact.
Resilient EUR 🇪🇺: In contrast, the ECB has signaled it is at or near the end of its easing cycle. Economic data from core Eurozone countries is stabilizing, providing the Euro with relative strength.
Risk-On Sentiment 💹: The broader market remains in a "risk-on" mood, which is typically negative for the safe-haven USD. Gold is soaring and equities are near all-time highs, confirming the anti-dollar flow.
The Technical Picture 📊
The Secular Breakout 🚀: The most significant event is the breakout of a decade-long downtrend resistance line. This is a major structural shift. The pair has also achieved a monthly and quarterly close above the critical 1.1500 handle, turning a historic resistance level into a new support floor.
The Impulsive Uptrend 🌊: On the 4-hour chart, the price is in a clear ascending channel. The post-NFP dip represents a healthy correction within this uptrend, bringing price back toward key support.
Key Levels 🔑:
Support Zone: The dip has brought price directly into the key support confluence between 1.1700 and 1.1760, making this an ideal area to enter long.
Resistance Zone: Major resistance still sits at 1.1900, making it a prudent take-profit target.
Strategy & Risk Management 🧠
The stronger-than-expected NFP headline has provided the exact pullback this strategy was designed for. The dip presents a prime opportunity to buy into the dominant uptrend at a more favorable price. Instead of chasing the market, we are now positioned to enter on a technically sound correction.
Good luck, and trade safe!
Trade Parameters ✅
Pair: EUR/USD
Direction: Long / Buy 🟢
Entry Type: Limit Order
Entry Price: 1.1745
Stop-Loss: 1.1685 (60 pips) 🔴
Take-Profit: 1.1895 (150 pips) 🎯
Risk/Reward Ratio: 2.5 : 1

Master Your Edge: It’s Not About Just Being Right
Most traders obsess over being right on every trade. But the truth is, consistent profitability doesn’t come from perfect predictions—it comes from disciplined risk management.
Mark Douglas reminds us:
“Trading is not about being right or wrong. It’s about how much you make when you’re right and how much you lose when you’re wrong.”
Focus less on proving yourself right, and more on protecting your capital when you’re wrong. That’s how professionals thrive in uncertain markets.
#MJTrading
#TradingPsychology #MarkDouglas #ForexMindset #TraderMindset #EURUSD #TradingQuotes #ForexLife #RiskManagement #TradingDiscipline #ForexEducation #ChartOfTheDay #PriceAction #MindOverMarkets
EUR/USD timw to rebalance priceEUR/USD extended one side for long now , was huge buy pressure ,but it cant go forever one side, country economics would colapse. on this idea we have head and shoulders pattern on 1h time frame,plus extra confirmation of another low structure formed. now we wait to double tops get swept and we could look for short entrys , should be nice runnere to the short side

HelenP. I Euro may soon reverse and test support near $1.1655Hi folks today I'm prepared for you Euro analytics. If we look at the chart, EURUSD has been climbing steadily within an uptrend, bouncing multiple times from the trend line and making higher highs. However, despite the recent bullish structure, the pair is now showing signs of slowing momentum. The price is approaching a possible turning point near the top, and the latest candles show hesitation. Now the pair is trading near 1.1790 and still staying above the trend line, but I believe it may rise a bit more and then break down below the trend line. Once this structure is broken, I expect sellers to take control and push EURUSD toward the nearest support zone between 1.1655 and 1.1630 points. This zone acted as a key level in the past and may serve as the next area of interest for buyers. Given the extended movement and potential loss of bullish pressure, I remain bearish and expect EURUSD to move down to retest support. The level of 1.1655 is my current goal. If you like my analytics you may support me with your like/comment ❤️
Disclaimer: As part of ThinkMarkets’ Influencer Program, I am sponsored to share and publish their charts in my analysis.
EURUSD Bullish continuation supported at 1.1640The EURUSD currency pair continues to exhibit a bullish price action bias, supported by a sustained rising trend. Recent intraday movement reflects a sideways consolidation breakout, suggesting potential continuation of the broader uptrend.
Key Technical Level: 1.1640
This level marks the prior consolidation range and now acts as pivotal support. A corrective pullback toward 1.1640 followed by a bullish rejection would reinforce the bullish trend, targeting the next resistance levels at:
1.1830 – Near-term resistance
1.1900 – Minor swing high
1.1940 – Longer-term bullish objective
On the other hand, a decisive daily close below 1.1640 would invalidate the bullish setup, shifting the outlook to bearish in the short term. This could trigger a deeper retracement toward:
1.1590 – Initial support
1.1530 – Key downside target
Conclusion:
As long as 1.1640 holds as support, the technical outlook remains bullish, favoring long positions on dips. A confirmed break below this level would signal a shift in sentiment and open the door to a corrective pullback phase.
This communication is for informational purposes only and should not be viewed as any form of recommendation as to a particular course of action or as investment advice. It is not intended as an offer or solicitation for the purchase or sale of any financial instrument or as an official confirmation of any transaction. Opinions, estimates and assumptions expressed herein are made as of the date of this communication and are subject to change without notice. This communication has been prepared based upon information, including market prices, data and other information, believed to be reliable; however, Trade Nation does not warrant its completeness or accuracy. All market prices and market data contained in or attached to this communication are indicative and subject to change without notice.

More upside for EUHi traders,
Last week EU started with a gap down. After the fill it swept the lows and after that it made the next impulsive wave up.
So next week after the finish of the correction down we could see more upside.
Let's see what the market does and react.
Trade idea: Wait for the finish of the correction down and a change in orderflow to bullish on a lower time frame. After a small correction down you could trade longs again.
If you want to learn more about trading with FVG's, liquidity sweeps and Wave analysis, then make sure to follow me.
This shared post is only my point of view on what could be the next move in this pair based on my technical analysis.
Don't be emotional, just trade your plan!
Eduwave

Do you think ill hit my TP?What do you guys think will I hit my TP at 1.17544. I set up a buy for 1.17389 but not sure if ill keep it there, just depends.

EURUSD ( AB Algorithm Setup) 30.06.2025 - 04.07.2025 While everyone is waiting for a pullback or a downward correction, or expecting this aggressive trend to break and lead to a sharp drop, the market will continue to rise. Because a trend is sustained by those who don't believe in it

SMC Entry Models Cheatsheet✅ Smart Money Concepts & Liquidity Checklist
1. Market Structure
🔹 Identify HTF Trend (H4 or H1): bullish, bearish, or range
🔹 Confirm Break of Structure (BOS) or Change of Character (CHoCH) on M15–M5
🔹 Look for lower highs/lows (downtrend) or higher highs/lows (uptrend)
2. Liquidity Zones
🔹 Look for equal highs/lows (liquidity pools)
🔹 Asian highs/lows — common targets during London/NY session
🔹 Recent internal range liquidity
🔹 Trendline liquidity — fakeouts often occur here
3. Premium & Discount Zones (PD Arrays)
🔹 Use Fibonacci from recent swing high to low
🔹 Look for entries at Discount (Longs) or Premium (Shorts) pricing
🔹 Ideal entries happen between 0.62–0.79 retracement
4. Supply & Demand Zones
🔹 Find fresh OBs (Order Blocks) that caused a break of structure
🔹 Use last bullish candle before strong drop (for short) or last bearish candle before strong rally (for long)
🔹 Confirm zone isn’t mitigated yet
5. Imbalance / Fair Value Gaps (FVG)
🔹 Identify large imbalanced candles (no wick overlap)
🔹 Ideal entries are inside the FVG aligned with direction
🔹 High probability if FVG is within OB or confluence with structure/liquidity
6. Confluences for Entry
🔹 Entry aligns with liquidity sweep or FVG/OB tap
🔹 Volume spike or rejection wick confirms interest
🔹 RSI divergence or exhaustion = bonus confirmation
🔹 Use M1/M5 for entry trigger after setup is formed on M15–H1
7. Entry Trigger
🔹 CHoCH or BOS on lower timeframe (M1-M5)
🔹 Confirmation with engulfing candle, FVG fill, or break/retest
🔹 SL below/above recent swing or OB boundary
8. TP/Exit Zones
🔹 TP1: After BOS/structure shift + partial
🔹 TP2: Next liquidity level (equal high/low or OB)
🔹 TP3: Opposite OB or major FVG
🔹 Adjust SL to breakeven after reaching TP1
9. Session Timing (Important)
🔹 Asian range → look for liquidity setup
🔹 London Open (3PM–6PM PH))→ manipulative move (liquidity grab)
🔹 NY Open (8PM–11PM PH) → continuation or reversal opportunity
🔹 Avoid high-impact news releases unless breakout
🔹 Use Forex Factory / MyFXBook for news calendar
10. Post-Trade Journaling:
🔹Screenshot HTF → LTF Setup (H4 > M15 > M1)
🔹Don’t skip journaling — it’s your #1 improvement tool.

Eurusd bos/making LL swingsAs you can see on the 1 hr tf there's a bos creating a lower low, I think the market made new highs but in the short term i'm expecting the market to balance out fvg before rallying higher. Current bias : bearish short term and bullish long term

#AN014: Ursula von der Leyen No Confidence Motion, Market Crisis
Hello, I am Andrea Russo, a Forex trader and today I want to focus on an explosive news that has hit Brussels in the last 24 hours: the motion of no confidence against the President of the European Commission Ursula von der Leyen. I thank in advance the Official Broker Partner PEPPERSTONE for the support in carrying out this analysis.
The fact: Motion of No Confidence in the European Parliament
On July 1st, several MEPs from both conservative right and far left groups formally presented a motion of no confidence against Ursula von der Leyen, accusing her of: Non-transparent agreements with Emmanuel Macron, Opaque management of the new “Pact for Europe”, Conditioning of key appointments within the Commission and the Council and above all the violation of the democratic principle of balance of powers.
Although the motion does not seem to have the numbers to pass, it represents a direct attack on the political legitimacy of the outgoing president, just when she is trying to obtain a second term.
The suspicion is that this move is not so much to bring down von der Leyen, but to: Weaken her negotiating position, Force her to make political concessions and reopen the game on the strategic EU appointments 2024–2029.
This internal crisis comes at the worst possible time. A crisis of internal legitimacy in this context can undermine institutional stability and slow down all the economic reforms expected by the markets.
Impact on Forex
1. EUR under pressure
European political risk is back in the spotlight. Even if there was no immediate shock to the euro, institutional trading rooms are already pricing in more internal instability. This translates into:
Downward pressure on EUR/USD, especially if the motion receives more votes than expected (even if it does not pass).
EUR/CHF at risk of retracement, as the Swiss franc is seen as a safe haven currency in the event of EU institutional crises.
EUR/GBP with potential loss of strength, especially if London takes advantage of the crisis to relaunch bilateral agreements.
2. Push for safe haven currencies
JPY, USD and CHF have shown anomalous movements in the last few hours: political uncertainty is pushing traders to seek safe havens. The EUR/USD futures curve also shows a slight downward revaluation.
3. Upcoming events to monitor
The real threat will be if the number of votes in favor of the no-confidence motion exceeds 30–35% of Parliament → in that case, even if the motion does not pass, von der Leyen will be delegitimized.
The euro, in this case, could undergo a technical correction extended up to 1.0650, especially if accompanied by weak macro data.
Follow me, if you like, for other updates.