EURUSD Under Pressure Amid Geopolitical TensionsEURUSD – Technical Overview
EUR/USD is currently trading below the pivot zone at 1.1530, indicating a continuation of the bearish trend.
If the price remains below 1.1450, we may see an extension of the downtrend toward 1.1373, and potentially 1.1270.
However, if the pair holds above 1.1450, it may regain bullish momentum toward 1.1558 and 1.1625.
Geopolitical tensions in the Middle East could impact EUR/USD if the situation escalates, increasing risk-off sentiment and USD demand.
Key Levels:
• Pivot: 1.1530
• Support: 1.1450 / 1.1373 / 1.1270
• Resistance: 1.1558 / 1.1625 / 1.1675
EURUSD_SPT trade ideas

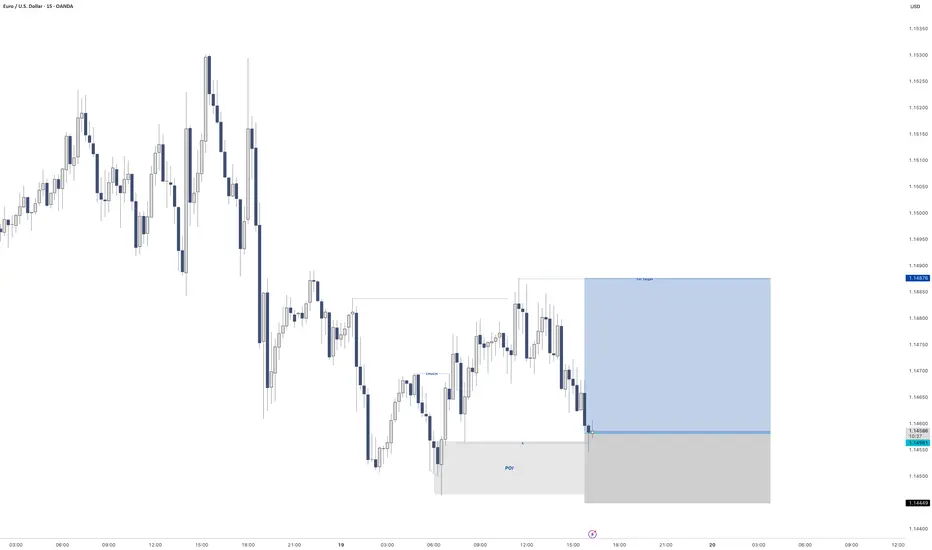
EURUSD - LongGreat set. Very close to Demand on the HTF to the left.
CHoCH on the 15min that left behind some liquidity.
Also created some liquidity to the right.
Very nice set up for me.
Triggered into the trade
Lets see how we go
EURUSD IDEAueururueruruafadfsdfgsarwfdshgfts4ertsgdfgdf
bearish div on higher timeframe, bearish orderflow and fvgs being respected, but current price is looking like it wants to form a choch after sweeping day fvg and liquidities, so.... idk man

# EURUSD H1 SUPPLY WITH LIQUIDITY # EURUSD H1 Supply with mss with proper Liquidity entry with little pips of sl and big tp

EURUSD Under Pressure! SELL!
My dear friends,
Please, find my technical outlook for EURUSD below:
The instrument tests an important psychological level 1.1551
Bias - Bearish
Technical Indicators: Supper Trend gives a precise Bearish signal, while Pivot Point HL predicts price changes and potential reversals in the market.
Target - 1.1458
Recommended Stop Loss - 1.1608
About Used Indicators:
Super-trend indicator is more useful in trending markets where there are clear uptrends and downtrends in price.
Disclosure: I am part of Trade Nation's Influencer program and receive a monthly fee for using their TradingView charts in my analysis.
———————————
WISH YOU ALL LUCK

EURUSD The Target Is DOWN! SELL!
My dear subscribers,
This is my opinion on the EURUSD next move:
The instrument tests an important psychological level 1.1588
Bias - Bearish
Technical Indicators: Supper Trend gives a precise Bearish signal, while Pivot Point HL predicts price changes and potential reversals in the market.
Target - 1.1555
About Used Indicators:
On the subsequent day, trading above the pivot point is thought to indicate ongoing bullish sentiment, while trading below the pivot point indicates bearish sentiment.
Disclosure: I am part of Trade Nation's Influencer program and receive a monthly fee for using their TradingView charts in my analysis.
———————————
WISH YOU ALL LUCK

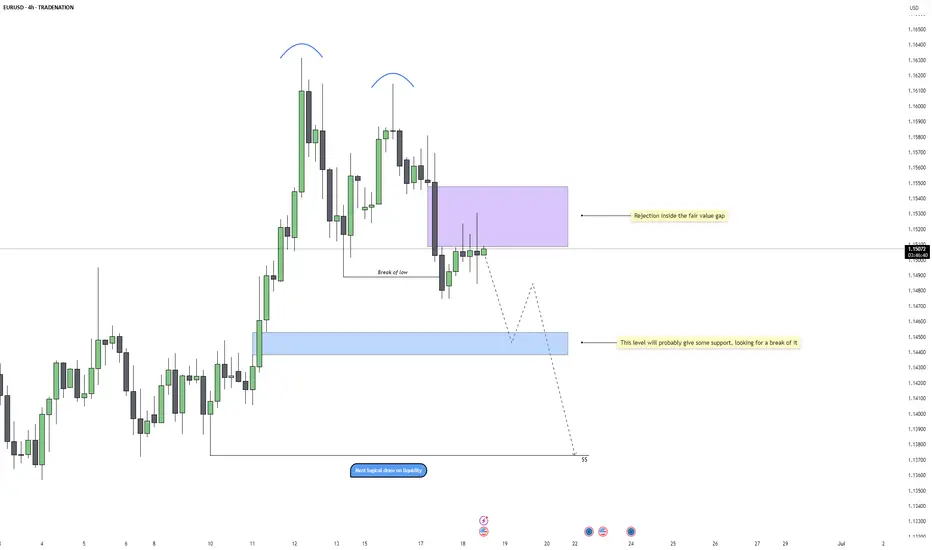
EURUSD - FVG Rejection and Bearish Continuation PlayEURUSD has been showing consistent bearish pressure on the 4H chart, with a clear shift in momentum after forming a double top near 1.162. That marked the beginning of a structural change, which was confirmed once price broke the most recent higher low. Since then, the market has transitioned into a bearish structure, with lower highs forming consecutively. This suggests that the bullish trend is over for now, and the market is more likely to seek liquidity below.
Rejection at Fair Value Gap
After the low was broken, price retraced back into a 4H fair value gap, which has now acted as resistance. This is typical smart money behavior, sweep liquidity, shift structure, then retest an imbalance before continuing lower. The wick rejection inside the purple FVG zone is a strong signal that this area is being respected and that sellers are defending it. The rejection aligns with the overall bearish market flow and suggests that the market has likely completed its retest.
Short-Term Support and Liquidity Target
The light blue FVG around 1.144 could offer temporary support, but the bias remains bearish. That level sits right at the midpoint of the recent bullish leg that was already violated, and while price may pause here, the more logical draw on liquidity sits deeper. Unless there’s a sudden shift in market structure or high-impact fundamental news, this area is expected to eventually give way.
Liquidity Below and Final Target
The cleanest and most obvious liquidity pool rests around the 1.137 zone. This is where price previously consolidated before initiating the impulsive move higher, and it remains unmitigated. If the current bearish structure holds, the market will likely target this area next. The path there might not be linear, we could see a short-term bounce off 1.144, but as long as price remains below the 1.153 FVG rejection, the bearish continuation remains valid.
Trade Expectation and Risk Context
This setup aligns well with typical displacement-retest-continuation behavior. The risk is clearly defined above the FVG rejection, and as long as lower highs continue forming beneath that zone, the bearish thesis remains intact. Key downside targets are 1.144 for partials, and 1.137 as the final draw on liquidity. This setup offers both precision and strong narrative confluence, ideal for swing or intraday positioning.
Conclusion
Price has shifted bearish on the 4H, confirmed by a break of structure and rejection from a clear FVG. As long as we remain below that imbalance, the market should continue hunting liquidity to the downside. 1.144 may act as short-term support, but the real magnet sits at 1.137. Patience and risk control will be key in riding this move effectively.
Disclosure: I am part of Trade Nation's Influencer program and receive a monthly fee for using their TradingView charts in my analysis.
___________________________________
Thanks for your support!
If you found this idea helpful or learned something new, drop a like 👍 and leave a comment, I’d love to hear your thoughts! 🚀
EURUSD: The Market Is Looking Up! Long!
My dear friends,
Today we will analyse EURUSD together☺️
The market is at an inflection zone and price has now reached an area around 1.14672 where previous reversals or breakouts have occurred.And a price reaction that we are seeing on multiple timeframes here could signal the next move up so we can enter on confirmation, and target the next key level of 1.14789.Stop-loss is recommended beyond the inflection zone.
❤️Sending you lots of Love and Hugs❤️

EURUSD: Market of Buyers
The charts are full of distraction, disturbance and are a graveyard of fear and greed which shall not cloud our judgement on the current state of affairs in the EURUSD pair price action which suggests a high likelihood of a coming move up.
Disclosure: I am part of Trade Nation's Influencer program and receive a monthly fee for using their TradingView charts in my analysis.
❤️ Please, support our work with like & comment! ❤️

EURUSD SELL OPPORTUNITY Sell opportunity on EURUSD
Entry: 1.14800
Stoploss:1.14900
Takeprofit: 1.14150
Comment your opinion
Need someone to manage your fund. DM on X @shajudeakinoba1

Euro can fall to support area and then rebound upHello traders, I want share with you my opinion about Euro. Observing this chart, we can see how the price, after a period of sideways trading, the price started to grow gradually and formed a consistent bullish structure. The trend was supported by regular bounces from the support line, confirming the bullish sentiment. At some point, price made a temporary drop below the support area, but this move was short-lived; bulls quickly stepped in, and the pair recovered. After that, EURUSD returned back into the channel and began forming higher highs and higher lows again, confirming the continuation of the trend. Right now, the price is declining slightly and approaching the support area again, which is located between 1.1455 and 1.1430. This zone has shown itself as a strong support during previous moves and is now being retested from above. Given the current structure and the upward channel in play, I expect the Euro to rebound from this support area and continue growing toward the 1.1580 points - that’s my current TP 1. Please share this idea with your friends and click Boost 🚀
Disclaimer: As part of ThinkMarkets’ Influencer Program, I am sponsored to share and publish their charts in my analysis.

EURUSD pushing away from 2025 highsAfter creating a new 2025 high last week, MARKETSCOM:EURUSD is now in a slight correction mode. Will the bears take control from here? Let's have a look.
FX_IDC:EURUSD
Let us know what you think in the comments below.
Thank you.
77.3% of retail investor accounts lose money when trading CFDs with this provider. You should consider whether you understand how CFDs work and whether you can afford to take the high risk of losing your money. Past performance is not necessarily indicative of future results. The value of investments may fall as well as rise and the investor may not get back the amount initially invested. This content is not intended for nor applicable to residents of the UK. Cryptocurrency CFDs and spread bets are restricted in the UK for all retail clients.

EURUSD +3% Trade Recap 17th June 2025A short position taken on EURUSD for +3%, full explanation as to why I executed on this position and made the decision to manually close at the level I did.
Any questions you have just drop them below 👇

EURUSD ||| Elite traders see the trap
EUR/USD 4H 🔍 – Greenfire Forex Outlook
🟦 Rising channel structure spotted
🔸 Liquidity zones mapped
🟪 Buyer blocks identified (1.137 & 1.117)
📉 Let price dive deeper into the trap...
📈 Then catch the reversal with precision.
This is not a prediction, it's a reaction plan based on price behavior.
🔥 Structure + Zones + Patience = Greenfire Setup
.
#EURUSD #SmartMoneyConcepts #ForexAnalysis #ElliottWave #SMC #PriceAction #ForexIndia #4HChart

EURUSD: at key resistance: Will price rebound to 11300?Quick recap on EURUSD, seriously déjà vu of my previous analysis on EURUSD - once again we see the price coming towards the same resistance level. This is a level where it has struggled to break through and reversed nicely to the downside as expected. For me it's definitely one to monitor, especially for anyone considering short trades.
If we start seeing signs that the price is getting rejected here: like long wicks, bearish candles, or buyers starting to lose momentum, I think we could see a move down toward the 1.11300 level. I am targeting a slight bounce like before, nothing major. But if price cleanly breaks out, that would rule out the bearish outlook and suggest even further upside will follow.
This area is pretty important and could give us a better idea of where price is headed next.
Just sharing my thoughts on support and resistance, this isn’t financial advice. Always confirm your setups and manage your risk properly.

EURUSD Will Go Lower! Sell!
Here is our detailed technical review for EURUSD.
Time Frame: 1h
Current Trend: Bearish
Sentiment: Overbought (based on 7-period RSI)
Forecast: Bearish
The market is trading around a solid horizontal structure 1.148.
Taking into consideration the structure & trend analysis, I believe that the market will reach 1.143 level soon.
P.S
Please, note that an oversold/overbought condition can last for a long time, and therefore being oversold/overbought doesn't mean a price rally will come soon, or at all.
Disclosure: I am part of Trade Nation's Influencer program and receive a monthly fee for using their TradingView charts in my analysis.
Like and subscribe and comment my ideas if you enjoy them!

EUR?USD correctional sellsAfter anticipating the E/U buys with our previous trade market went against us after collecting Liquidity and we are currently looking for seller into our Point of interest on the qhr timeframe... trade is a bit more riskier bcoz of mininum cornfirmation given

CHECK EURUSD SIGNAL READ CAPTAIN(eurusd) buy zone
(trade satup)
entry point (1.14800) to (1.14700) 📊
first target (1.15000)📊
2nd target (1.15350) 📊
last target (1.15700) 📊
stop loss (1.14400)❌

EUR/USD TrendlineEUR/USD remains under pressure after breaking its ascending trendline. Price is currently testing resistance between 1.14782 – 1.14985, a zone that could act as a ceiling for a new bearish leg.
If rejection holds, potential targets on the downside are 1.14465 and 1.14311.
A break and hold above 1.14985 would invalidate this bearish idea.

EURUSDLooking to sell the EUR USD on Long Term, the unfolding butterfly is currently almost complete with leg D due, so we selling based on the unfolding leg D and the support that's been broken, however tight with Risk Management on this one as it might make it rain for us if we carefully handle this, observe and decide.

EURUSD bullish swing setup on 1HWe have bullish bias on EURUSD, daily and all TF bellow are bullish. Currently we sitting at low point and good idea to pick buy trade. We have 15 min bullish divergence. We already on breakeven.

insight on eurusdbased on higher TF FVG Zone this is a valid buy trade, lot of conflueces influenced this entry. feel free to jump on it.

EUR_USD BULLISH BIAS|LONG|
✅EUR_USD is trading in an uptrend
With the pair set to retest
The rising support line
From where I think the growth will continue
LONG🚀
✅Like and subscribe to never miss a new idea!✅
Disclosure: I am part of Trade Nation's Influencer program and receive a monthly fee for using their TradingView charts in my analysis.
