I'm selling EURUSD, you should too!!!War is always bullish Dxy and bearish Eur. Technically too, a high has been taken and expecting retracement.
TP1 @ 1.147
TP2 @ 1 137
Follow me as most of my trades are market orders, so you'll see them on time and enter the trades on time. I want you to recover the money you lost to the market and make so much more
Ya gazie
EURUSD_SPT trade ideas

Opportunity for buying EURUSDEURUSD touched strong support, so I think it will rise further, as shown.

Still keeping a close eye on a potential USD pop...Although the EUR/USD and GBP/USD popped higher late last week, I'm still keeping a close eye to stay short on the EUR/USD considering the bearish rising broadening pattern coupled with a yearly pivot point inter-median level and negative divergence on the MACD. This is all based on the daily chart.
Many factors are in play right now with what's going on between Israel and Iran along with FOMC this week and Tariffs still in play.
On a purely technical analysis point of view, I potentially expect a bullish retracement in the USD while remaining long term bearish across the board.
we'll see how this one develops.
Good Luck & Trade Safe.

EUR/USD Retesting Broken Resistance
EUR/USD has recently broken above the ascending channel and is now retesting the previous breakout zone between 1.15205 and 1.15325. This area may act as new support.
If the level holds, we may see continuation toward 1.15701, with potential extension to 1.16309 if bullish momentum continues.
A confirmed break back below 1.1520 would invalidate the bullish idea and suggest a false breakout.
🔹 Support zone (retest): 1.15205 – 1.15325
🔹 Target 1: 1.15701
🔹 Target 2: 1.16309
🔹 Timeframe: 1H
🔹 Structure: Retest of breakout level

Week of 6/15/25: EU AnalysisEU continues to have clean market structure and has all time frames aligned for bullish movement. Looking for price to retrace to the prime 1h POI for an A+ setup.
Major News:
FOMC - Wednesday

EUR/USD – Bullish Continuation Setup Ahead of Retest Zone
As of today, I’m maintaining a bullish stance on EUR/USD going into mid-2025. Back on May 22, I marked the support zone around 1.10649, and since then price action has respected that zone beautifully, forming higher lows and gaining steady upside momentum.
Looking at current structure across the 11H, 20H, and 16D timeframes, I do not see any strong bearish momentum. If anything, the most recent pullback seems like a natural setup for continuation rather than reversal.
🟡 Key zones to watch:
Support: 1.13636 (20HR Support)
Demand reaction zone: 1.14443 – 1.15407
Resistance/Next target zone: 1.15729 – 1.16311 (Previous swing high)
Upper target potential: 1.16921
We’ve already cleared the minor consolidation and are now holding above the support band. If we get a proper retest of the 1.14948 zone and hold, I expect continuation toward 1.16311, and potentially a breakout above 1.16921 if momentum follows through.
✅ Momentum Outlook: Bullish
📍 Bias: Long
🕰️ Trend: Mid-Term Swing (Higher Time Frame Confluence)
If no macro news disrupts momentum, the technicals point toward a healthy continuation. Let's see if the retest confirms the move. 📊

Potential long setup EURUSDTook almost two months for us to take April high well done for those who caught the move. This analysis will probably take a lot less time to play out.
Friday closed with an inside bar which means you would have to go onto lower timeframes to see which direction makes more sense to go.
I have not been given any reason fundamentally or technically to be bearish on the pair just yet so I will be targeting the high.
The daily FVG is a key area to look at and if it fails and we start making bearish FVGs that could be a sign that we will start getting a weekly or even a monthly pullback.
That's all I can say for now stay safe and flow with the markets.

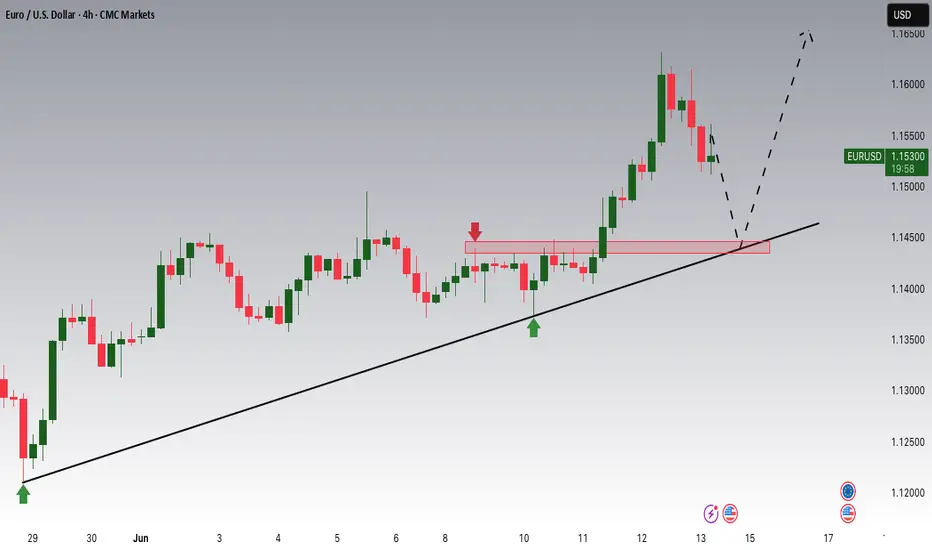
EURUSD Potential UpsidesHey Traders, in today's trading session we are monitoring EURUSD for a buying opportunity around 1.14500 zone, EURUSD is trading in an uptrend and currently is in a correction phase in which it is approaching the trend at 1.14500 support and resistance area.
Trade safe, Joe.
Eurusd Will Drop Its PricesEUR/USD continues to recover ground lost and now extends the rebound to the 1.1550 zone on Friday. Meanwhile, the US Dollar maintain its bullish bias intact in response to a significant flight to safety amid increasing geopolitical concerns, while positive consumer sentiment data also contribute to the daily uptick.

EURUSD TRADE SETUPWait for retest the entry level and bullish momentum candle then take a trade for Buy otherwise skip this setup

EURUSD - Medium term prediction - 16/06/25For this long off 1.1193 targeting 1.1909 vs. a retrace back under 1.1193, I’d peg the probabilities roughly as:
Outcome Probability
Rally above 1.1909 first ~75%
Drop below 1.1193 first ~25%
Rationale
Bullish breakout: EUR/USD has convincingly flipped 1.115–1.120 into support and cleared the 1.15–1.16 ceiling with follow‐through.
Momentum: Daily candles show clean advances with little upper‐wick rejection; RSI/MACD remain in bullish territory without overbought exhaustion.
Bear case stretch: To return under 1.1193, price would need to wipe out the entire breakout and break multiple support layers (1.1550, 1.1400, 1.1200) — a lower‐probability scenario absent a major macro shock.

EURUSD ||| '' W '' PATTERN IDENTIFIED . ✅ Harmonic Formation (Bearish Potential)
⚠️ Selling Bias forming soon
---
🧩 Pattern Breakdown:
A Bearish Harmonic Pattern (likely Butterfly or Deep Crab) has been identified and is now nearing completion at the D point.
Current price is approaching key resistance / reversal zone, precisely around the 0.786 - 0.886 fib area (highlighted red).
The Risk-to-Reward is clearly mapped:
🔺 Stop Loss: 1.19405
✅ Entry Zone: Around 1.17106
🎯 Target: 1.09588
Potential short setup if price respects the harmonic symmetry and fails to break above resistance.

EURUSD Monday BearsExpecting a EURUSD price to descend at market open. The overall trend is bullish as we can see a bullish flag is in formation however, within the bullish flag, a smaller bearish flag has formed and will push price to retest support trend line.

EURUSD POTENTIAL SHORT OPPORTUNITYHello Everyone!
How are you all?
EurUsd is a pair to watch in the coming days/weeks, because it is shaping up very nicely for a short trend reversal that we can capitalize on.
So, I will be looking for a sell opportunity because of the following reasons:
1. The price has formed a sell reversal structure with two lows and a potential third touch at the high.
2. The price is approaching a value area.
Game Plan:
If the price comes to the VA, and rejects at that level or sweeps the High, and makes a bearish impulse followed by a H1 flag with two highs and lows.
Entry : will look for a risk sell entry within the flag or a reduced risk entry on the breakout of the flag.

EURUSD: Bearish Continuation is Highly Probable! Here is Why:
Remember that we can not, and should not impose our will on the market but rather listen to its whims and make profit by following it. And thus shall be done today on the EURUSD pair which is likely to be pushed down by the bears so we will sell!
Disclosure: I am part of Trade Nation's Influencer program and receive a monthly fee for using their TradingView charts in my analysis.
❤️ Please, support our work with like & comment! ❤️

EUR/USD Elliott Wave Outlook – Expanded Flat Playing Out?EUR/USD appears to be unfolding a classic expanded flat correction for wave (4):
Wave A formed as a 3-wave zigzag
Wave B retraced beyond the start of A — a key trait of expanded flats
Now looking for a 5-wave C-leg decline toward the 1.1122 – 1.1002 area
Aligned with 1.0–1.618 extensions of A
RSI + MACD divergence adds bearish confirmation at the B top
Potential bullish reversal zone into late June / early July
As long as price holds below the B high (~1.1650), the bearish path in wave C remains in play.
📍 Target zone: 1.1122–1.1002
📈 Bias: Bearish short-term, bullish long-term (wave 5 up next)

Projected Price Path (White Lines)showing technical analysis and a projected price path. Here’s a breakdown of what’s visible:
🔍 Chart Overview
Pair: EUR/USD
Timeframe: 4H (4-hour)
Current Price: ~1.15881
Date/Time: Around June 13, 2025, 3:47 AM (UTC+3)
🟩 Highlighted Zones
Upper Supply Zone (resistance area):
Around 1.15150 – 1.15300
Price previously reacted and broke above this zone.
Lower Demand Zone (support area):
Between 1.13600 – 1.13900
Price bounced from this level in the past.
Intermediate Zone (recent consolidation):
Around 1.14300 – 1.14500
Possibly an area of minor structure or reaccumulation.
📈 Price Action
Price made a strong bullish move, breaking through previous resistance zones.
Bearish pin bar (rejection wick) at the top suggests potential reversal or pullback.
🔮 Projected Price Path (White Lines)
The drawn projection suggests:
Short-term pullback, possibly to retest the 1.15300–1.15150 area.
A minor lower high forms.
Deeper drop expected toward the demand zone at 1.13800 or lower.
🧠 Analysis Implication
This is likely a swing trader’s roadmap, anticipating a reversal after an overextended move.
The analysis could be based on liquidity sweep above highs and return to structure.

EURUSD: Move Up Ahead?! 🇪🇺🇺🇸
EURUSD nicely respected the underlined key horizontal support.
A strong rejection from that and a formation of a bullish imbalance candle
indicate a highly probably bullish continuation next week.
Goal - 1.1608
❤️Please, support my work with like, thank you!❤️
I am part of Trade Nation's Influencer program and receive a monthly fee for using their TradingView charts in my analysis.

EURUSD in bullish trendprice action seems quite bullish on bigger TFs which gives opportunity to earn decent RR, with latest bullish divergence it seems that trend will likely mark new HH as on 30 min TF trend is following bullish Dow theory. There can be 2 bullish setups which i have also opened on the chart.
Beware of Mon gaps!!!

EURUSD: FOMC meeting ahead Previous week on the US market was focused on inflation data. The inflation rate in May was standing at 0,1% for the month, below market expectations of 0,2%. At the same time the US core inflation was also below market estimate at the level of 0,1%, while the market forecasted 0,3% for the month. Inflation rate on a yearly basis in May was standing at 2,3% and core inflation was 2,8%. The Producers Price Index in May was at the level of 0,1% for the month, same as core PPI. Both figures were modestly below market estimates. University of Michigan Consumer Sentiment preliminary for June showed some modest relaxation in the inflation expectations. The indicator reached the level of 60,5 which was better from the market estimate of 53,5. The inflation expectations for this year at the beginning of June were standing at 5,1%, and were decreased from 6,6% posted previously. The five year inflation expectations modestly decreased from 4,2% to 4,1%.
During the previous week there has not been too much currently significant data posted for the Euro Zone and Germany, its largest economy. The wholesale prices in Germany in May dropped by -0,3% for the month, bringing the indicator to the level of 0,4% on a yearly basis. Both figures were in line with market forecasts. The balance of trade in the Euro Zone in April ended the month with a surplus of euro 9,9B, which was significantly below market estimate of euro 18,2B. The Industrial Production in the Euro Zone surprisingly dropped in April by -2,4% for the month, which was higher from estimated -1,7%. The IP on a yearly basis stands at 0,8% in April, again below market consensus of 1,4%.
Although the inflation in the US is evidently slowing down, as well as long term inflation expectations, still, newly emerged tensions in the Middle East made investors prefer long positions in gold rather than USD. In this sense, USD weakened as of the end of the previous week to the lowest weekly level against euro at 1,1624. Still, the currency pair closed the week at 1,1553. The RSI has not reached the clear overbought market side, reaching the highest level at 66. This leaves some space for eurusd to move further to the higher grounds until the clear overbought market side is reached. The MA50 continues to strongly diverge from MA200, without an indication that the potential cross is near in the future.
Usually after a strong push of financial assets toward one side, follows the time when the market is searching the equilibrium level. Depending on further developments on the Middle East crisis, there is a potential that eurusd will start the week ahead with a modest consolidation. The 1,15 resistance line was clearly breached during the previous week, indicating probability that the currency pair will revert a bit back to test for one more time this level. On the opposite side, the 1,16 was shortly tested, but the potential for further upside will depend on weekly fundamentals. The most important event for the week ahead is scheduled for Wednesday, June 16th, when the FOMC meeting is scheduled, as well as US economic projections. This day will most certainly bring some higher volatility on markets. Currently, it is widely expected that the Fed will hold interest rates unchanged at this meeting, and leave the planned rate cut for September. However, what the market is expecting to hear are projections for the future period, especially how the Fed perceives the impact of implemented trade tariffs on the US economy.
Important news to watch during the week ahead are:
EUR: ZEW Economic Sentiment Index for Germany in June, Inflation rate final in May for the Euro Zone, PPI in Germany in May, HCOB Manufacturing PMI flash in June, in both Germany and the Euro Zone,
USD: Retail Sales in May, Industrial Production in May, Building Permits preliminary in May, Housing starts in May, the FOMC meeting and interest rate decision will be held on Wednesday, June 18th, the FOMC economic projections will be posted the same day, Fed press conference after the FOMC meeting on Wednesday. The week ends with data regarding Existing Home Sales in May on Friday.

EU Loading the Next Leg Up| Bullish Bias in MotionEU gave that clean 4H high break — strong bullish intent locked in.
Zoomed into the 30M and spotted that refined structure doing what it does.
Now just sitting tight, waiting on market open to see if price wants to bless the kid with that next leg up.
High timeframe bias is bullish.
Mid-timeframe structure aligned.
It’s patience time — sniper mentality 🧠🎯
Bless Trading!


Long IdeaWhen this occurs, it is not uncommon to see price approach the line, and
"throw a spike" over the line. At other times price might approach but not
quite reach the previous high or low. This tells you that the current price is
already on the correct side. You will therefore expect the price to "bounce
down” or “bounce up" as the case may be. This will most often occur
around the time of the London open. You should recall that this is likely to
be part of the market makers aim of keeping traders trapped. If they've
already made a high for instance, and there are positions trapped here then
they will not want to push price above it again but will then approach it,
perhaps even spike with an enlarged spread and pull away again.
