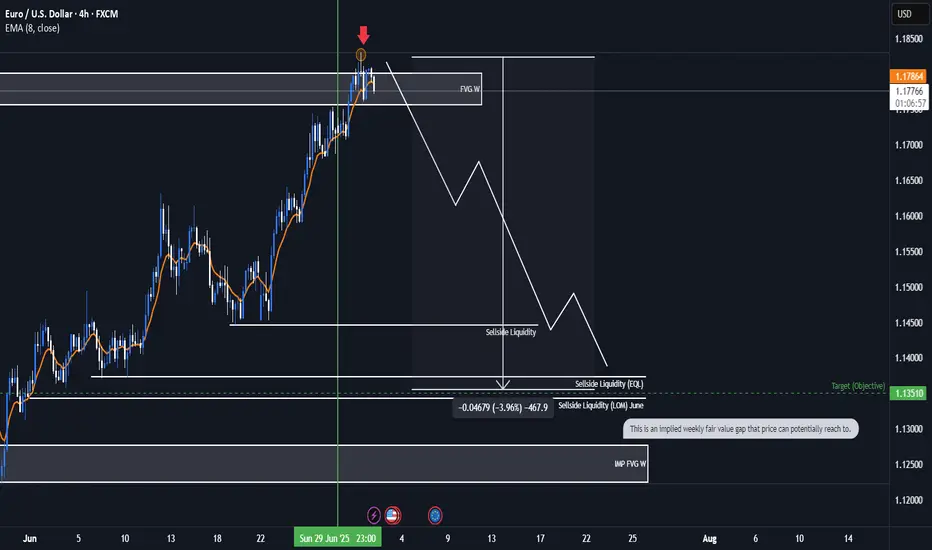
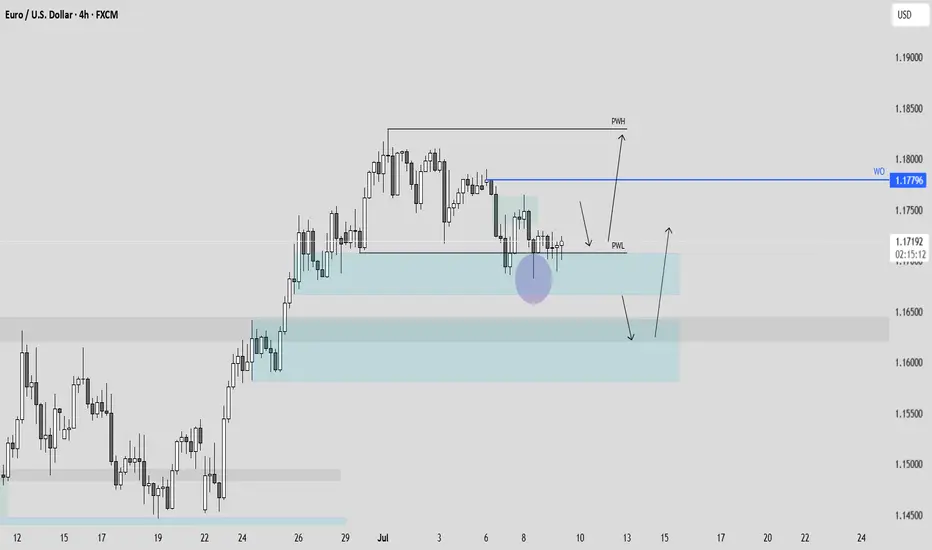
EURUSD Bearish ideaWe are in a weekly fair value gap that we have balance and potentially collected orders to prepare for a potential drop in price. We are anticipating a quarterly shift for the month of July were we could be targeting downside liquidity that is in open float.
* Fundamentals:
-Interest rate differentials shows us that USD interest rate of 4.5 is higher than the interest rate EUR 2.15 which lead to the longer fundamental frame work of price correcting to the higher dollar rate to the euro.
-The COT report also indicates to us that there is huge buying of Dollar by the commercials and a huge amount of selling of the EUR by commercials which can lead us to assume potential weaker dollar.
*Targeting:
-We are looking for the low of last month (June) to be taken out as well as even potentially reaching to the implied weekly fair value gap.
EURUSD_SPT trade ideas
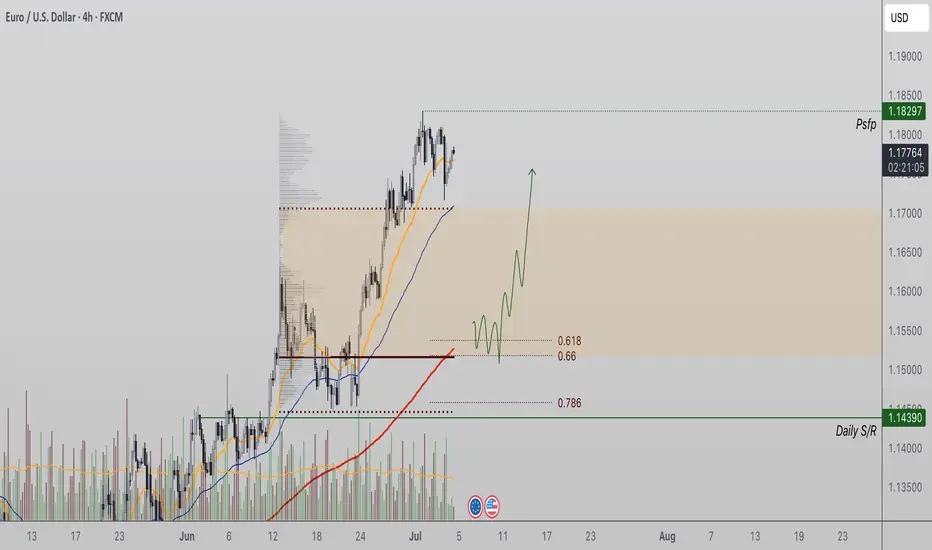
EURUSD Healthy Correction Could Set Up Next Bullish LegEURUSD continues to trade within a strong bullish structure, marked by a consistent sequence of higher highs and higher lows across multiple timeframes. The pair recently tested a significant resistance zone around $1.18, which acted as a swing high and has since been defended by sellers. This rejection has led to a short-term pause in the uptrend, with price now consolidating around the value area high, a critical area on the volume profile that typically precedes either continuation or a corrective move.
From a technical standpoint, a pullback from the current level would be healthy, especially given the extended nature of the recent move. The ideal retracement zone lies between the 0.618 Fibonacci level, the point of control (POC), and the 200-period moving average — all of which converge to form a strong demand region. A revisit of this zone would offer a textbook opportunity for the formation of a higher low, which would preserve the existing bullish structure and invite renewed buying interest.
A correction into this region would not indicate weakness but rather reinforce the strength of the trend. It allows for momentum reset and offers a more sustainable base for the next potential move higher, potentially targeting a breakout above the $1.18 swing high.
As long as price action remains above the previous higher low and these key support zones hold, the bullish bias remains intact, and traders may look for long opportunities on signs of a reversal within the corrective zone.
EURUSD - Macro Trend Shift Soon?Hello TradingView Family / Fellow Traders. This is Richard, also known as theSignalyst.
📈From a macro perspective, EURUSD has been bearish trading within the falling red channel.
Medium-term, EURUSD has been in a correction phase trading within the rising channel in orange.
Moreover, the green zone is a massive monthly resistance.
🏹 Thus, the highlighted red circle is a strong area to look for sell setups as it is the intersection of the upper red and orange trendlines and resistance.
📚 As per my trading style:
As #EURUSD is around the red circle zone, I will be looking for bearish reversal setups (like a double top pattern, trendline break , and so on...)
📚 Always follow your trading plan regarding entry, risk management, and trade management.
Good luck!
All Strategies Are Good; If Managed Properly!
~Rich
Disclosure: I am part of Trade Nation's Influencer program and receive a monthly fee for using their TradingView charts in my analysis.

EUR/USD Analysis: US Dollar Strengthens at the Start of the WeekEUR/USD Analysis: US Dollar Strengthens at the Start of the Week
On 2 July, on the EUR/USD chart, we noted that the rally—during which the pair had gained more than 6% since mid-May—was under threat, citing several technical signals, including:
→ proximity of the price to the upper boundary of the ascending channel;
→ overbought conditions on the RSI indicator;
→ nearby resistance from the Fibonacci Extension levels, around 1.18500.
Trading at the start of the week points to renewed US dollar strength. This became particularly evident with the opening of the European session, which triggered a decline in EUR/USD to the 1.17500 area.
It is reasonable to assume that the dollar’s strength against the euro is linked to early-week positioning by traders, who are anticipating news regarding US trade agreements.
According to Reuters, the United States is close to finalising several trade deals in the coming days and is expected to notify 12 other countries today about higher tariffs.
EUR/USD Technical Chart Analysis
The ascending channel established last week remains in play, with the following developments:
→ a dashed midline within the upper half of the channel has been breached by bearish pressure (as indicated by the arrow);
→ a series of lower highs in recent sessions suggests the formation of a downward trajectory, within which the price could move towards the channel median—or potentially test its lower boundary.
P.S. In the longer term, analysts at Morgan Stanley maintain a bullish outlook, forecasting that EUR/USD could rise to 1.2700 by the end of 2027.
This article represents the opinion of the Companies operating under the FXOpen brand only. It is not to be construed as an offer, solicitation, or recommendation with respect to products and services provided by the Companies operating under the FXOpen brand, nor is it to be considered financial advice.

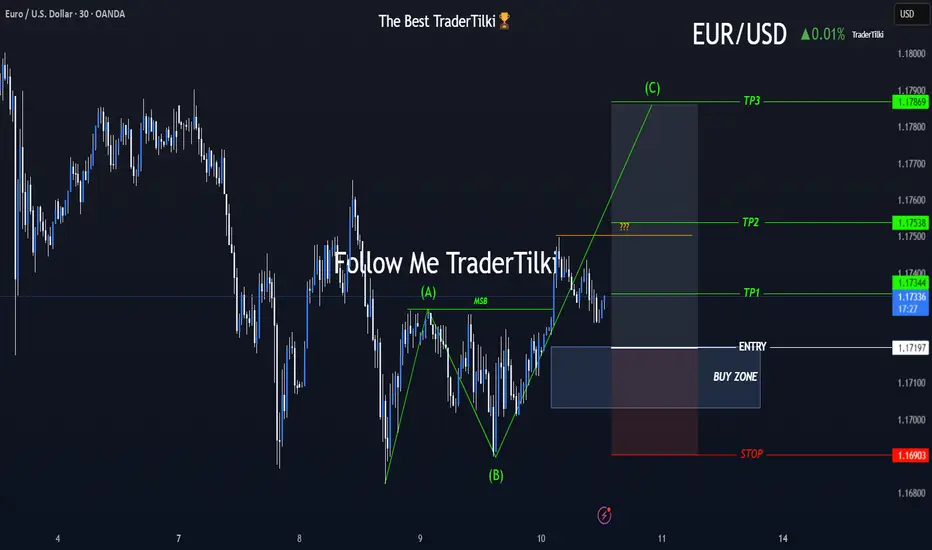
A New Chapter Begins with EURUSD’s ABC Wave Formation!🎯 Hey Guys,
I’ve prepared a fresh EURUSD analysis for you.
The market has shifted direction, and an ABC wave structure has emerged.
I’ve placed a Buy Limit order based on my entry level.
Below, you’ll find my detailed target zones and entry specifics:
🟩 Buy Limit Order: 1.17197
🟥 Stop Loss: 1.16903
📌 Targets:
🔹 TP1: 1.17344
🔹 TP2: 1.17538
🔹 TP3: 1.17869
📊 Risk/Reward Ratio: 2.27
Your likes and support are what keep me motivated to share these analyses consistently.
Huge thanks to everyone who shows love and appreciation! 🙏
121Hello awesome traders! 👑✨
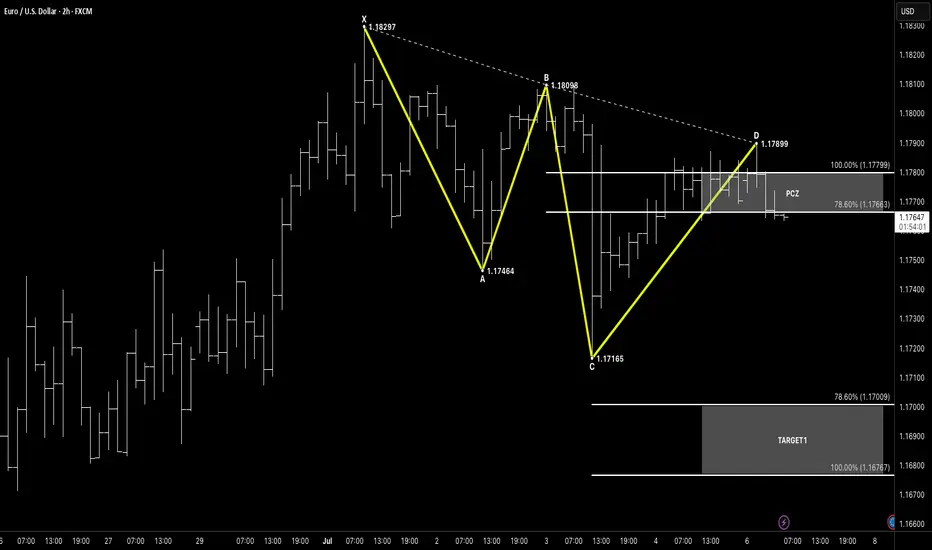
Let’s kick off the week with a EUR/USD 2-Hour chart — spotting a high-probability 121 Bearish reversal to ride lower.
🧠 Setup Breakdown
Pattern Type: 121 Bearish Reversal
X → A: Downtrend from 1.18297 → 1.17464
A → B: Retracement up to 1.18098
B → C: Drop to 1.17165
C → D: Leg up into 1.17899 completing the 121
PRZ / PCZ: Confluence of 78.6% & 100% of BC at 1.17663–1.17799
✅ Why This Works
Clean 121 structure with two distinct retracements
Amplitude Symmetry: AB ≈ CD in price distance (~130 pips each)
Horizontal resistance from the prior B-swing lines up with PCZ
⚔️ Entry & Risk Management
Entry Zone: Short within 1.1766–1.1780 (PCZ)
Stop-Loss: Above swing high D at 1.17899, 5–10 pips higher (~1.1805)
Risk: ≤ 1–2 % of account per trade
🎯 Target Zones
Target Zone 1: 78.6%–100% retracement of C→D → 1.17009–1.16767
Target Zone 2: 127.2%–161.8% extension of C→D → 1.16459–1.16067
🔍 Confirmation & Invalid
Candlestick Rejection: Watch for bearish pin-bar or engulfing at PCZ
Structure Break: Close back below C→D trendline adds conviction
Invalidation: A decisive close above 1.1805 (above PCZ & D) negates the setup
💡 Keep It Simple:
Pattern → Spot 121 Bearish
PCZ → Wait for 78.6–100 % retracement of BC
Trigger → Bearish price action at D
Continuation → Ride the move into your Target Zones
🔔 Monitor ECB speak and risk-sentiment for broader catalysts.
Wishing everyone a profitable week ahead — stay disciplined, manage risk, and let structure lead, not emotions! 🚀
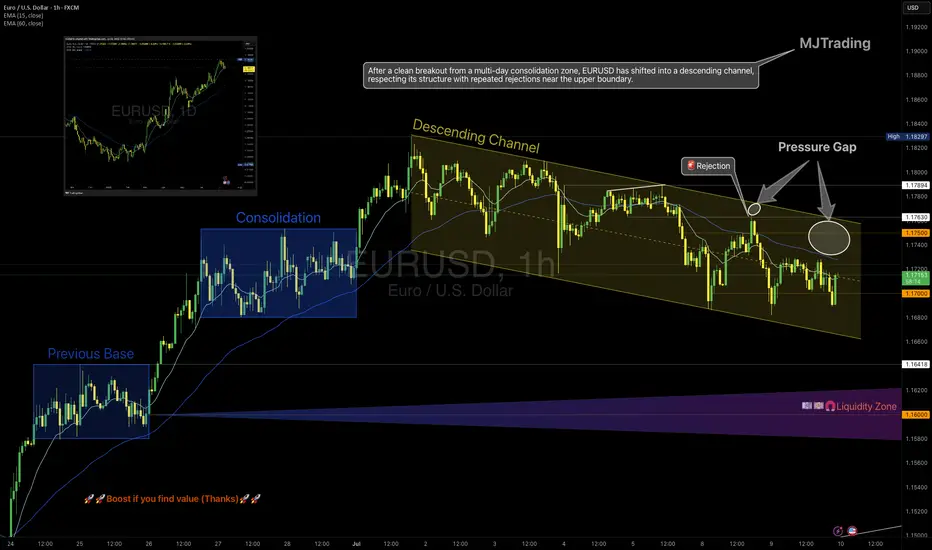
EURUSD – From Structure to Shift
1H Technical Outlook by MJTrading
EURUSD moved cleanly through a sequence of structural phases:
• Previous Base
• Multi-day Consolidation (potential quiet accumulation)
• Transition into a well-respected Descending Channel
Price has since shown repeated rejections from the upper boundary, including a decisive selloff from the 1.1750 zone, forming what we now label a "Pressure Gap" — a space where aggressive sellers overwhelmed price.
🧭 Key Scenarios Ahead:
🔻 Bearish Continuation:
Breakdown below 1.1700 opens room toward:
• 1.1640 (channel bottom)
• 1.1600 Liquidity Zone
Watch for impulsive sell candles + EMA rejection
🔁 Short-Term Bounce or Trap:
Holding above 1.1700 could spark a rebound toward 1.1750
This may serve as a final test before another leg lower
Only a clean break and hold above 1.1763 flips structure bullish
🔍 Bonus Confluence:
1D Chart shows broader bullish context (inset)
EMAs tightening = expect volatility burst
Well-defined structure gives clear invalidation and targets
Every trend tells a story — from base building to breakout, and now a possible breakdown. Trade the structure, not the prediction.
#EURUSD #Forex #TradingView #TechnicalAnalysis #PriceAction #DescendingChannel #LiquidityZone #SmartMoney #MJTrading
EURUSD CONSOLIDATION BEFORE A BULLISH CONTINUATION?I've been bearish on TVC:DXY for the past months. Not only technically but also fundamentally. If you know DOLLAR AND CMCMARKETS:EURUSD have a negative correlation. In this case a bearish dollar means a bullish EU. Currently looking for more price action to confirm potential buy trades. If dollar decides to retrace more we will adapt and change the biais
WHAT DO YOU THINK?
EUR/USD 2-Hour Chart - OANDA2-hour performance of the Euro/U.S. Dollar (EUR/USD) currency pair on the OANDA platform as of July 08, 2025. The current exchange rate is 1.17365, reflecting a 0.24% increase (+0.00279). The chart includes a recent sharp decline highlighted in a shaded area, with buy and sell signals at 1.17375 and 1.17357 respectively. Key price levels are marked, ranging from 1.1500 to 1.1850, with a focus on the recent market movement.

EURO to see a MAJOR DECLINE as US$ RALLIES The chart posted is that of the Euro as you can see the targets based on fib relationship was just seen ! I have moved LONG DXY 96.70 and will remain Long dxy until I see an ALT otherwise the DXY should rally into OCT 10th best of trades WAVETIMER

EURUSD - Potential sell at LDN or NY openLooking for sell from the POI highlighted
We have raided buy side liquidity so now its time to look at the origin of the move and see if we can further capitalise on a similar set up I took yesterday in order to bank a lovely 8.5% profit on this single trade.
Will post the trade below

EurUsd - This is the deadly breakout!EurUsd - FX:EURUSD - is about to fly:
(click chart above to see the in depth analysis👆🏻)
EurUsd has been rallying about +15% over the past couple of months. Additionally the breakout at the current resistance trendline is about to be confirmed. Subsequently EurUsd is setting up for another major move higher, which will be painful for all European traders.
Levels to watch: $1.23, $1.11
Keep your long term vision🙏🙏
Philip (BasicTrading)

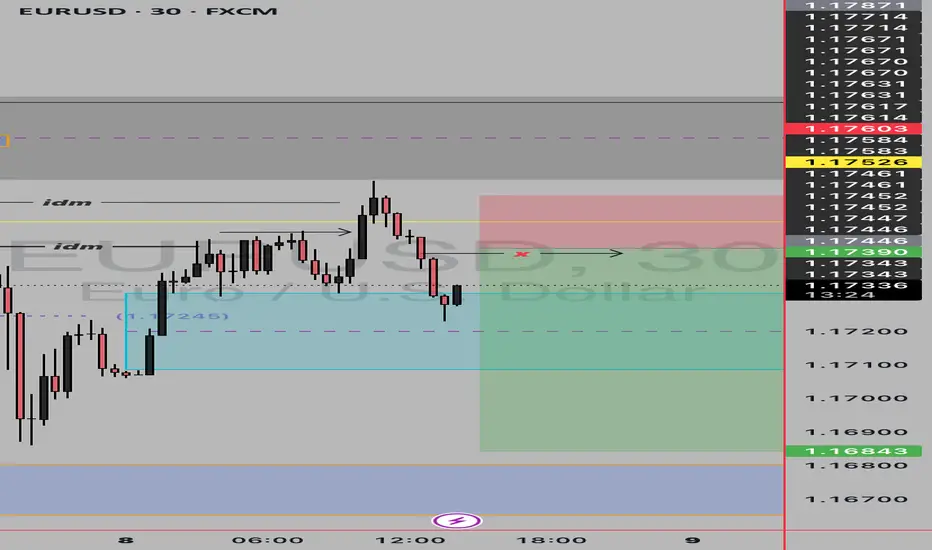
30M Insight: EURUSD Buy Limit ReadyGood Mornıng Traders;☀️
Based on a 30-minute analysis, I’ve identified a shift in EURUSD market structure. I’ll be waiting for price to reach my level with a buy limit order.
📥 BUY LIMIT ORDER: 1.17180
🛑 STOP LOSS: 1.16946
🎯 TP1: 1.17275
🎯 TP2: 1.17412
🎯 TP3: 1.17649
📊 Risk / Reward Ratio: 2.00
Patience meets precision. Let the market come to you.
🧠 Master your mindset with iron discipline.
Never fear the trade—let the trade fear you.
Keep your motivation high and your focus sharper than ever.
-----
Your likes and support are what keep me motivated to share these analyses consistently.
Huge thanks to everyone who shows love and appreciation! 🙏

EURUSD: overboughtFriday was a non-working day in the US, as the country was celebrating Independence Day. The most important weekly macro data was related to US jobs data. At the start of the week JOLTs job openings in May were posted with a figure of 7.769M, significantly higher from market estimate of 7,3M. The next day the NFPs and Unemployment rate was published. As per data, the unemployment rate dropped by 0,1pp to the level of 4,1%, which missed market expectations of 4,2%. The Non-farm payrolls in June added 147K new jobs, again better from forecasted 110K. The average hourly earnings were higher by 0,2% in June, or 3,7% on a yearly basis, modestly below the forecasted 3,9%. Other weekly macro data including ISM Manufacturing PMI in June reached 49,0 a bit higher from estimated 48,8. The ISM Services PMI in June was standing at 50,8 in line with market estimates.
Retail Sales in Germany dropped by an additional -1,6% in May, bringing the indicator to the level of +1,6% on a yearly basis. Both figures were lower from the market estimate of +0,5% for May and +3,3% for the year. Inflation rate in Germany preliminary in June was 2% a bit lower from forecasted 2,2%. Inflation for the month was standing at 0%. Preliminary inflation data for the Euro Zone in June was 0,3% for the month and 2% for the year. EuroZone core inflation was standing at 2,3% in June, exactly in line with market estimates. The unemployment rate in the Euro Zone in May was modestly increased by 0,1pp to the level of 6,3%, while the market was expecting to remain flat at 6,2%.
The US Dollar continued its decline against the euro during the previous week. The highest weekly level was at 1,1825, but the currency pair closed the week at 1,1776. The RSI reached the level of 73, signalling a clear overbought market side, increasing the probability of a short term reversal in the coming period. The MA50 continues to diverge from MA200, indicating low probability of a potential cross in the future period.
The eurusd daily chart is showing that the currency pair had formed a sort of channel with an uptrend during the past period. If lows from end of February, mid March and end of March are connected, the indication for a next potential level of eurusd might be somewhere above the 1,16 level. The 1,1620 was the highest level achieved in mid July this year, which aligns well with the previous indication. Indicators are currently showing higher probability of a short term reversal. The week ahead is not bringing any currently significant news with respect to the US economy, in which sense, it could be expected that the market will slow down a bit during the week. Short reversal is quite possible, where the level of 1,1620 might be shortly tested. Just in case that the market decides to continue movement toward the higher grounds, then 1,18 resistance will be tested, before the market continues its road toward the 1,19 level.
Important news to watch during the week ahead are:
EUR: Industrial Production in May in Germany, Retail Sales in the Euro Zone for May, Balance of Trade in Germany in May, Inflation rate final for May in Germany,
USD: FOMC Meeting minutes.

SELL EURUSD for bullish divergence trend reversal STOP LOSS: 1.1SELL EURUSD for bullish divergence trend reversal STOP LOSS: 1.1747
Regular Bearish Divergence
In case of Regular Bearish Divergence:
* The Indicator shows Lower Highs
* Actual Market Price shows Higher Highs
We can see a strong divergence on the MACD already and There is a strong trend reversal on the daily time frame chart.....
The daily time frame is showing strength of trend reversal from this level resistance so we are looking for the trend reversal and correction push from here .....
TAKE PROFIT: take profit will be when the trend comes to an end, feel from to send me a direct DM if you have any question about take profit or anything
Remember to risk only what you are comfortable with........trading with the trend, patient and good risk management is the key to success here...

EURUSD and Elliott Wave PrinciplesWe are currently on a Wave 5 that started when Wave 4(Red) completed. This 5th Wave expresses itself in 5 waves that are shown in Black. Our Wave 2 was a Zigzag and and we should expect a Flat correction for our Wave 4. When Wave 3 is complete an A Wave retests on the 261.8% Fib. level. Wave B goes beyond the end of Wave 3 and retests the confirms at the 423.6% Fib. level. This indicates the end of Wave B and the start of Wave C of the Flat, hence our Wave 4.

How to Trade Liquidity Sweep in Forex Market (SMC Trading)
I will show you a real example of trading liquidity sweep with Smart Money Concepts.
You will learn the essential SMC liquidity basics, a simple and profitable strategy to identify and trade liquidity sweep.
I will share with you an accurate entry confirmation signal that works perfectly on any Forex pair.
Liquidity Basics
In order to trade liquidity sweeps profitably, you should learn to identify significant liquidity zones.
To spot them, analyze a historic price action and find clusters of important historic key levels.
Examine a price action on EURUSD on an hourly time frame.
I underlined multiple horizontal key levels.
The price respected each level, found support on them, and rebounded.
What is so specific about these levels is that they are lying close to each other, composing a liquidity cluster.
That fact that EURUSD strongly bounced from these levels suggests that buying interest and high buying volumes were concentrated around them.
We can unite these levels and treat them as a single demand zone that has just been broken and turned into a supply zone.
After we found a valid liquidity zone, we can look for a liquidity sweep.
First, we should let the price approach that area and look for a specific price behavior then.
That is a perfect example of a liquidity sweep.
You can see that the price formed a wide range candle with a long tail.
Its high went way beyond the underlined area, but its body closed within.
In order to understand, why a liquidity sweep occurred, let's zoom in our chart and try to understand a behavior of the market participants.
Our supply zone concentrated selling orders , we assume that sellers were placing their orders across its entire length.
Their stop losses were presumably lying above that area.
Smart Money know that and with a liquidity sweep they manipulate the market, making sellers close their positions in a loss (buying back their positions from the market) and providing a liquidity for big players.
After a formation of a such a candlestick, a reliable confirmation of a saturation of the Smart Money is a formation of a strong bearish candle - a clear sign of strength of the sellers.
A bearish engulfing candle above confirmed a completion of a liquidity sweep and indicates a highly probable bearish continuation.
Your perfect sell entry is immediately after a close of such a candlestick.
Stop loss should strictly lie above the high of a liquidity sweep.
Take profit is based on a local low.
Look, how quickly the price reached the goal.
Your strategy of trading liquidity sweeps of demand zones is absolutely the same.
Let the price test a demand zone, wait for a formation of wide range bearish candle with a tail going below its lows.
Wait for a bullish imbalance candle and buy immediately then.
Stop loss will be below the low of a liquidity sweep, take profit - a local high.
This SMC strategy works on any time frame and can be applied for trading any Forex pair, Gold, Silver, Crypto and commodities.
Try it by your own and let me know your results.
❤️Please, support my work with like, thank you!❤️
I am part of Trade Nation's Influencer program and receive a monthly fee for using their TradingView charts in my analysis.

Bearish Bias on EURUSD Down trend line respected
D= pullback 4H= Bearish - low high form
1H = Bearish at LH
- short term down trend is over
- Bearish engulfing candle
- both 14 and 50 ema above price at a LH
= short entry

Bearish drop for the Fiber?The price is rising towards the pivot which acts as an overlap resistance and could drop to the 1st support.
Entry: 1.1743
1st Support: 1.1631
1st Resistance: 1.1833
Risk Warning:
Trading Forex and CFDs carries a high level of risk to your capital and you should only trade with money you can afford to lose. Trading Forex and CFDs may not be suitable for all investors, so please ensure that you fully understand the risks involved and seek independent advice if necessary.
Disclaimer:
The above opinions given constitute general market commentary, and do not constitute the opinion or advice of IC Markets or any form of personal or investment advice.
Any opinions, news, research, analyses, prices, other information, or links to third-party sites contained on this website are provided on an "as-is" basis, are intended only to be informative, is not an advice nor a recommendation, nor research, or a record of our trading prices, or an offer of, or solicitation for a transaction in any financial instrument and thus should not be treated as such. The information provided does not involve any specific investment objectives, financial situation and needs of any specific person who may receive it. Please be aware, that past performance is not a reliable indicator of future performance and/or results. Past Performance or Forward-looking scenarios based upon the reasonable beliefs of the third-party provider are not a guarantee of future performance. Actual results may differ materially from those anticipated in forward-looking or past performance statements. IC Markets makes no representation or warranty and assumes no liability as to the accuracy or completeness of the information provided, nor any loss arising from any investment based on a recommendation, forecast or any information supplied by any third-party.

EURUSD TRADES BEARISH
Last week, due to a fail of holding above the 1.18000 level, we saw a huge 1-hour decline of 0.39% on big selling volumes, which is not typical for such instruments as EURUSD. Since that time, the price has been moving within a descending channel and has formed a possible pennant yesterday. All of the factors "vote" for going bearish in this asset.
So, what will be the possible scenario? We may go market sell right immediately, or wait till the breakout of the pennant pattern. In this case we may set
🔽 a sell stop order at 1.17400 with
❌a stop loss at 1.17670 and
🤑a take profit at 1.16915
Additionally, EURUSD may go even further downstairs, next to a 1.16000 support level. For this case we may preserve some minor part of our position with a take profit set nearby this level.

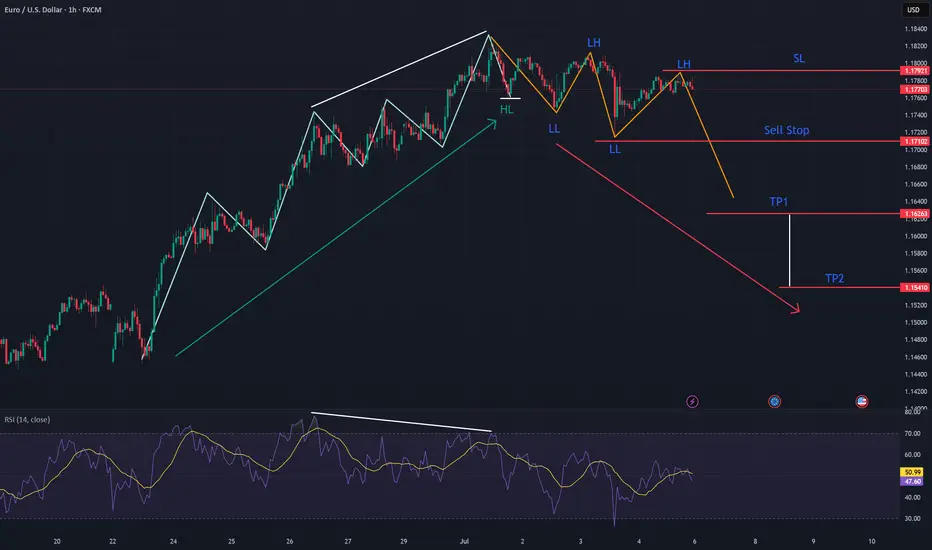
EURUSD: Potential Trend Reversal BrewingEURUSD is exhibiting clear signs of a potential trend reversal, having recently broken its previous Higher Low and subsequently establishing a sequence of Lower Highs and Lower Lows. This shift in market structure from bullish to bearish is a strong indicator of weakening upside momentum. Further confirming this outlook, the RSI is displaying a notable bearish divergence, where price registers higher highs while the RSI prints lower highs, signaling diminishing bullish strength at these elevated price levels. Considering this confluence of technical factors, a potential short setup is present.
Eurusd sellwe have retested daily where we broke previous candle open and currently changed structure currently waiting for retracement to the 50% and premium zone to short
EURUSD Will Go Down!
HI,Traders !
#EURUSD is making a
Bullish rebound after a
Bearish breakout but the
Pair will soon hit a new
Horizontal resistance
Of 1.17489 from where
We will be expecting a
Further move down !
Comment and subscribe to help us grow !
