EURUSD WEEKLY HTF FORECAST Q2 W25 Y25EURUSD WEEKLY HTF FORECAST Q2 W25 Y25
Professional Risk Managers👋
Welcome back to another FRGNT chart update📈
Diving into some Forex setups using predominantly higher time frame order blocks alongside confirmation breaks of structure.
💭NOTE- If price closes above the key weekly/ daily order block with daily close- re evaluation will be required.
🔑 Remember, to participate in trading comes always with a degree of risk, therefore as professional risk managers it remains vital that we stick to our risk management plan as well as our trading strategies.
📈The rest, we leave to the balance of probabilities.
💡Fail to plan. Plan to fail.
🏆It has always been that simple.
❤️Good luck with your trading journey, I shall see you at the very top.
🎯Trade consistent, FRGNT X
EURUSD_SPT trade ideas

EURUSD Buy indicationThe setup for Euro usd looks quiet strong where the fundamentals and technicals also give it a chance to follow the upside wave.

EURUSD shortClear liquidity grab today... let's wait for the opportunity and look what the market does the first hour of ny-session opening! ;)
!Trade safe!

My Thoughts #016HTF
The pair is in a bullish trend
In the trend it's currently making a new HH on the lower time frame.
LTF
Since it's making a HH it means it's in a bullish trend
Currently in the bullish it's making a HL
It could sell and drop lower to invalidate the set up
Use proper risk management
Let's do the most

EURUSD ANALYSIS - LONGPrice has successfully broken out of the falling wedge on both the daily and weekly charts, signaling strong bullish momentum. After hitting resistance around 1.1555 (61.8% Fib), we’re seeing a healthy pullback towards 1.1500-1.1488 support. As long as bulls defend 1.1400, I’m looking for continuation towards 1.1555 and 1.1894 swing targets. Watching price action closely at the current pullback zone for potential long entries.
EURUSD Buyers In Panic! SELL!
My dear subscribers,
EURUSD looks like it will make a good move, and here are the details:
The market is trading on 1.1441 pivot level.
Bias - Bearish
Technical Indicators: Both Super Trend & Pivot HL indicate a highly probable Bearish continuation.
Target - 1.1424
About Used Indicators:
The average true range (ATR) plays an important role in 'Supertrend' as the indicator uses ATR to calculate its value. The ATR indicator signals the degree of price volatility.
Disclosure: I am part of Trade Nation's Influencer program and receive a monthly fee for using their TradingView charts in my analysis.
———————————
WISH YOU ALL LUCK

HelenP. I Euro may break suppot level and drop to trend lineHi folks today I'm prepared for you Euro analytics. Observing this chart, we can see how the price strongly declined and reached the trend line, where it found solid support and reversed. From that point, EUR began to grow, forming a clear upward pennant structure. This movement included a break above the local support level at 1.1485, indicating temporary bullish strength. However, despite this breakout, the price failed to secure a strong push through the resistance zone between 1.1485 and 1.1530, instead consolidating just below it. Now the chart shows clear signs of slowing upward momentum. The price remains inside the pennant, but current movement suggests potential weakness near the top boundary. Given the structure and previous reaction points, I expect EURUSD to break below the support level and move toward the trend line again. This would be a natural retest of the lower boundary of the pennant. That’s why I’ve set my target at 1.1365, a level that coincides perfectly with the trend line, offering a realistic area for price to react once more. If you like my analytics you may support me with your like/comment ❤️
Disclaimer: As part of ThinkMarkets’ Influencer Program, I am sponsored to share and publish their charts in my analysis.

Euro can reach resistance line of channel and make correctionHello traders, I want share with you my opinion about Euro. Previously, price was trading inside a downward channel, gradually declining from the resistance line while forming a series of lower highs and lower lows. During that phase, sellers were clearly in control, and every attempt to grow was met with pressure near the channel’s upper boundary. However, that trend shifted once the price broke through the resistance line, confirming the end of the bearish momentum and the start of a new upward structure. After the breakout, EUR entered an upward channel, supported by multiple bullish impulses and consistent reactions near the support line. Price continued to rise, pushing through the support area and current support level around 1.1420. This upward movement showed strong bullish conviction, especially after the clean breakout and consolidation inside the channel body. Now the pair has approached the resistance line of the rising channel, where previous impulses typically slowed down or reversed. Given the channel geometry and past market behavior, I expect Euro to react to this upper boundary and move downward. For this reason, I set my TP at 1.1325, which aligns with the support line of the upward channel. Please share this idea with your friends and click Boost 🚀
Disclaimer: As part of ThinkMarkets’ Influencer Program, I am sponsored to share and publish their charts in my analysis.

EURUSD DOWNSIDE BIAS WITH 3 CONFLUENCESMY ANALYSIS AND PROJECTIONS FOR EURUSD NEXT TARGETS FOR THE WEEK JUNE 16TH TO 21ST
I have a strong downside bias going into this week for the EURUSD.
On the daily chart it has currently made a double top while clearing the 1.16 level and making a nearyy 4 year high for the pair. The next movement I believe would be to complete that downward stroke of the M pattern and this is supported by 2 other confluences.
1. There are overbought conditions for the EURUSD and there is a 0.5% Fibonacci target of retracement for the pair for its Strong bullish move from 1.02 to 1.16,Spanning from February till June 2025.
That target is at around 1.09 price level
2. Another important confluence is fundamentally driven and this is due to the Iran/Isreal war and middle East tensions which would drive the US dollar buying making it stronger and bullish due to its safe haven status.

EURUSD COT and Liquidity AnalysisHey what up traders welcome to the COT data and Liquidity report. It's always good to go with those who move the market here is what I see in their cards. I share my COT - order flow views every weekend.
🎯 Non Commercials added significant longs and closed shorts at the same time. So for that reason I see the highs as a liquidity for their longs profits taking.
COT Data Commentary – EURUSD (Last 5 Weeks)
EURUSD climbed steadily from 1.11 to 1.15 over the past five weeks, and the COT reports consistently showed market makers increasing their long positions during this period. This steady accumulation aligns with the bullish price action and reinforces the strength behind the uptrend. Institutional interest seems to be backing the move, suggesting continued upside potential as long as positioning remains supportive.
📍Please be aware that institutions report data to the SEC on Tuesdays and data are reported on Fridays - so again we as retail traders have disadvantage, but there is possibility to read between the lines. Remember in the report is what they want you to see, that's why mostly price reverse on Wednesday after the report so their cards are hidden as long as possible. However if the trend is running you can read it and use for your advantage.
💊 Tip
if the level has confluence with the high volume on COT it can be strong support / Resistance.
👍 Hit like if you find this analysis helpful, and don't hesitate to comment with your opinions, charts or any questions.
Analysis done on the Tradenation Charts
Disclosure: I am part of Trade Nation's Influencer program and receive a monthly fee for using their TradingView charts in my analysis.
"Adapt what is useful, reject what is useless, and add what is specifically your own."
— David Perk aka Dave FX Hunter ⚔️

More upside for EUHi traders,
Last week EU made a small correction to the downside but after that it went up again.
This could be wave 3 (red).
So if this is true, next week we could see more upside to finish wave 3 into the Weekly FVG.
Let's see what the market does and react.
Trade idea: Wait for the finish of a small correction down on a lower time frame to trade longs.
If you want to learn more about trading with FVG's, liquidity sweeps and Wave analysis, then make sure to follow me.
This shared post is only my point of view on what could be the next move in this pair based on my technical analysis.
Don't be emotional, just trade your plan!
Eduwave

EUR/USD Daily Chart Analysis For Week of June 13, 2025Technical Analysis and Outlook:
During the current trading session, the Eurodollar has exhibited notable volatility, mirroring patterns observed in the preceding week. The currency has surpassed both the Mean Resistance level of 1.145 and the Key Resistance level of 1.151, subsequently retesting the significant completed Outer Currency Rally level at 1.157.
Recent analyses indicate that the Euro is likely to revisit both the Key Resistance and the completed Outer Currency Rally and expand further to the next Outer Currency Rally of 1.177 in the forthcoming trading session(s). However, there exists a potential for a continuation of the downward trend from the current level, which could lead to the price action targeting the Mean Support level at 1.149 and possibly a further extension to the Mean Support level at 1.140.

EUR/USD Bulls in Control... But the Trap Is Set at 1.1600? 🇺🇸 EUR/USD – Technical & Macro Outlook
EUR/USD has posted an impressive rally over the past few weeks, driven by a combination of technical and macro factors. It is currently trading around 1.1586, right at the edge of a major supply zone where previous sharp rejections and reversals have taken place.
🔍 Technical Analysis
Price action remains within a well-defined ascending channel that began in mid-April, fueling the bullish move from the 1.07 lows.
The current daily candle is showing signs of exhaustion within the 1.1550–1.1600 resistance zone, with upper wicks and declining volume.
RSI is in a high-neutral zone but not yet overbought, leaving room for more upside — but also increasing the probability of a technical pullback.
🔁 Key Levels:
Primary resistance: 1.1600 (multi-touch supply area)
Support 1: 1.1460–1.1430 (previous resistance, now potential support)
Support 2: 1.1300–1.1270 (demand zone + channel base)
📉 COT Report – June 3, 2025
Non-Commercials (speculators) remain net-long with over 200,000 contracts, though both long (-1,540) and short (-4,830) positions saw reductions. This suggests a bullish structure with early signs of profit-taking.
Commercials are heavily net-short, with 575,000 short contracts versus 437,000 long — a structurally bearish stance from physical market participants.
Open interest increased significantly by +20,813, pointing to renewed speculative participation and potential volatility.
🧭 Retail Sentiment
Retail traders are heavily short (80%) with an average entry around 1.1253.
This contrarian behavior is typically supportive of continued upside pressure — especially if price holds above key supports.
📅 Seasonality – June
Historical averages over 10, 15, and 20 years show a slightly bullish tendency in June.
The 2- and 5-year patterns suggest more neutral to mildly bearish behavior.
This supports a consolidation or corrective pullback, without ruling out higher moves during the summer rally.
🎯 Trading Conclusion
Current bias: Moderately bullish, with rising pullback risks near 1.1600
Possible setup: Tactical short between 1.1580–1.1610 if confirmed by bearish price action
Target: 1.1430–1.1300
Bullish scenario remains valid unless we break below 1.1270
📌 Summary
The bullish trend is strong but technically extended. Speculative positions remain net-long but are starting to unwind. The retail crowd is still betting against the move, which favors bulls. However, structural resistance calls for caution — a pullback could be imminent.

EURUSD is continuing its uptrendEURUSD is still in a strong uptrend. There was a drop in the Asian and European sessions on Friday but that was not enough to reverse the pair. The end of the US session saw the price being pushed up by the bulls from the 1.155 price zone and is stuck in this resistance zone.
The price continues to increase when breaking 1.155 will head towards the resistance of 1.161, the highest peak of last week. If there is a retest of 1.155, the price will head towards 1.166 next week to be able to use short-term SELL strategies
The BUY strategy is still prioritized as the EU is still in an uptrend. The main BUY zone of the pair is still waiting for 1.150 and lower is the breakout zone of 1.145
Resistance: 1.161, 1.166
Support: 1.150, 1.145

EURUSD is in uptrend within up channelEURUSD is in uptrend within up channel. US dollar is continously weakening due to political crisis in cities.

Caught EU clean today. Waited patiently for that textbook 30M liquidity sweep, then stalked the LTF entry like a sniper. No rushing—just letting price do its thing until it stopped running. Then we pounced. 💥
Execution was sharp. Setup was smooth.
This is how we trade over here—precision, patience, and purpose.
📉 Stay tuned for the breakdown and upcoming analysis.
Would love to hear y’all thoughts on this one 👀👇
#SMC #Forex #InducementKing #EUTrade #SmartMoneyFlow
Bless Trading!

Long run……📈 EURUSD 4H – From Long to Short: Managing the Full Move
This chart shows the power of the ELFIEDT RSI + Reversion Strategy not only in identifying strong short-term reversion trades but also in guiding traders through longer-term swing positions when holding a trade from exhaustion signal to exhaustion signal.
⸻
🟢 Buy Signal – Early Reversal Opportunity
Back on the left of the chart, the strategy printed an “UP” signal after a heavy selloff:
• Price had broken well below the lower volatility band
• RSI entered deeply oversold territory
• A strong bounce followed, confirming the shift in momentum
This setup offered a great opportunity for position traders to enter early on a larger move — and it played out exceptionally well.
⸻
🔺 Trend Continuation Through Higher Lows
After the buy signal, price continued to climb with higher highs and higher lows, allowing the position to be managed with:
• A trailing stop-loss below swing lows
• Partial profit-taking along the way
• Or simply holding for a strategy-based exit
⸻
🔻 Sell Signal – Opposite Reversion Appears
Eventually, the price topped out after a steep rally, and the strategy printed a clear “DOWN” signal:
• Price had pushed far above the upper deviation band
• RSI signaled overbought exhaustion
• A pullback quickly followed
This offered two strategic options for long-term traders:
1. Close the long position fully, locking in gains from the original buy signal
2. Flip the bias and enter a short reversion trade, following the same principles in reverse
⸻
📌 Trade Management Commentary:
• Holding from “UP” to “DOWN” would have captured the full reversion-to-reversion swing — a large, clean multi-week trend
• No need to predict tops or bottoms — just follow the signals and let the market guide you
• For traders who prefer swing or position strategies, using the ELFIEDT signal pairs (buy → sell or sell → buy) can offer a rule-based exit system tied directly to volatility and momentum extremes
⸻
🎯 Takeaway:
The ELFIEDT RSI + Reversion Strategy is not just for scalps or intraday setups — it can also support longer-term trend plays, providing clear visual signals that help eliminate emotional exits and allow trades to mature naturally.

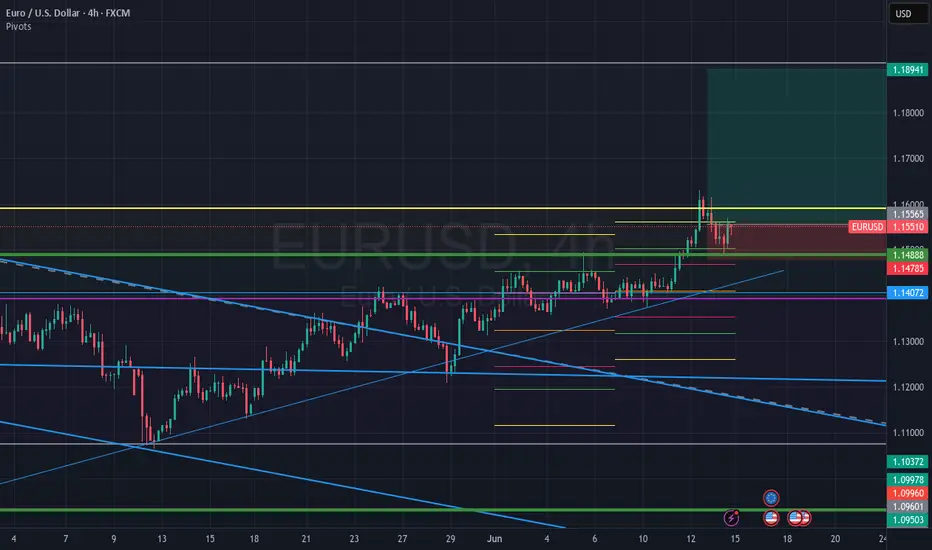
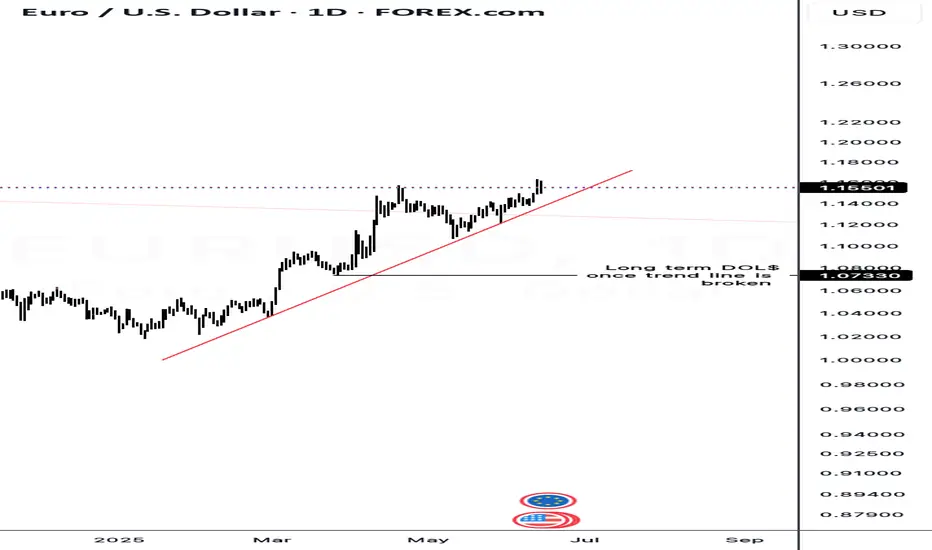
Waiting liquidity once trend line is broken.Once the daily trend line is broken, price will move to take out the long term sell side liquidity waiting below to continue the uptrend.
EURUSD Set To Fall! SELL!
My dear friends,
EURUSD looks like it will make a good move, and here are the details:
The market is trading on 1.1596 pivot level.
Bias - Bearish
Technical Indicators: Supper Trend generates a clear short signal while Pivot Point HL is currently determining the overall Bearish trend of the market.
Goal - 1.1533
About Used Indicators:
Pivot points are a great way to identify areas of support and resistance, but they work best when combined with other kinds of technical analysis
Disclosure: I am part of Trade Nation's Influencer program and receive a monthly fee for using their TradingView charts in my analysis.
———————————
WISH YOU ALL LUCK

EURUSD Wave Analysis – 13 June 2025- EURUSD reversed from the resistance level 1.1575
- Likely to fall to support level 1.1400
EURUSD currency pair recently reversed down from the resistance level 1.1575, which stopped the previous sharp impulse wave (1) in the middle of April.
The resistance zone near the resistance level 1.1575 was strengthened by the upper daily Bollinger Band.
EURUSD currency pair can be expected to fall to the next support level 1.1400 (which stopped the previous correction ii).

EURUSD, GBPUSD - Outlook for next weekEURUSD - So we have 2x 4 hour POI's (Points Of Interest). Will be looking at potential reversals at both POI's however, within the first POI we have an area of potential liquidity that could look to be taken before we make out move back to the upside.
Therefor, the second POI could look to be our more solid option for our buying options at some point next week.
GBPUSD - This pair looks to be building its liquidity now for potential trades to the upside as today on the lower TF's it was setting quite a few traps for the potential longs and the traders that would have been shorting the breaks below structure to the left.
If you have any questions for me please do let me know

EURUSD LONG SCAPLE5 Minutes timeframe
Entry:1.15182
Stoploss:1.15006
Takeprofit:1.16148
Entry model we identified a 5 minutes BISI and market is currently in the distribution phase we anticipate a reversal to the accumilation phase not financial advice but i risked 0.50% on this trade as im waiting for NQ! to present

EURUSD entry long 1h*The content on this analysis is subject to change at any time without notice, and is provided for the sole purpose of assisting traders to make independent investment decisions.
