POST NEWS📰 CPI News-Based Trade | EUR/USD Buy
We entered a long position on EUR/USD following the release of the US CPI data, which showed a significant deviation from expectations:
Actual CPI m/m: 0.2% below forecast
This meets our market-moving threshold of ±0.2%, indicating potential USD weakness
Weak CPI data reduces Fed rate hike expectations, leading to dollar depreciation
📈 Trade Setup:
Direction: Buy EUR/USD
Entry Reason: CPI m/m came in lower than forecast, signaling USD weakness
Strategy: News-based momentum trade
Stop Loss: 1.5 × 15-min ATR
Take Profit: 2 × ATR (risk-reward ~1:1.33)
🎯 Objective: Catch the post-news directional move based on fundamental weakness in USD. ATR-based risk management ensures volatility-adjusted levels.
EURUSD_SPT trade ideas

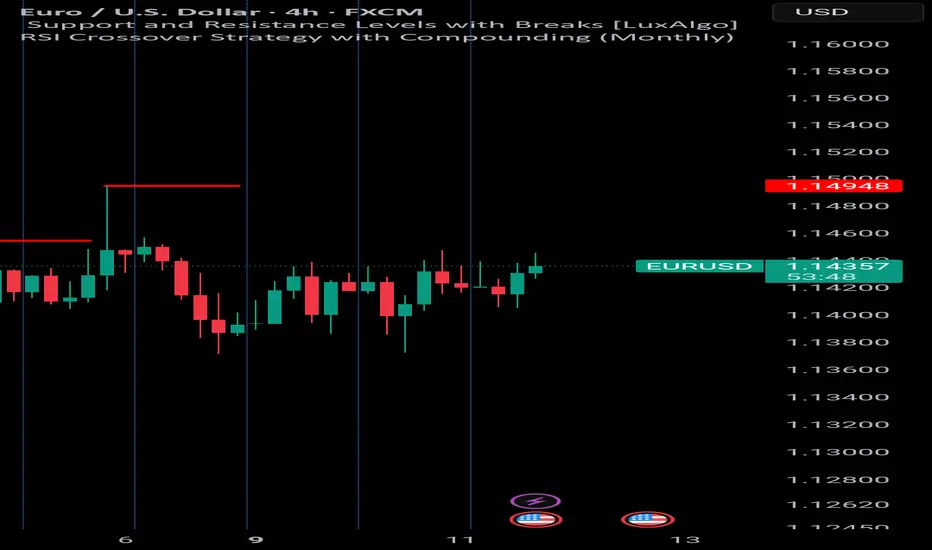
Today's EUR/USD Trend Analysis and Trading RecommendationsThe EUR/USD is trading at the upper end of its recent range, having hit an intraday high of around 1.1440 and remaining near that level. The US Dollar strengthened in the early session due to optimism about the easing of Sino-US trade tensions, but later declined as European stocks fluctuated. Technically, the daily chart shows bulls remain in control, with the 20-day SMA rising gently at 1.1330. In the short term, the pair is range-bound around the 20-day SMA, yet to confirm a bullish breakout, while the 100-day and 200-day SMAs support the overall upward trend.
EUR/USD
buy@1.14200-1.14300
tp:1.14600-1.14900

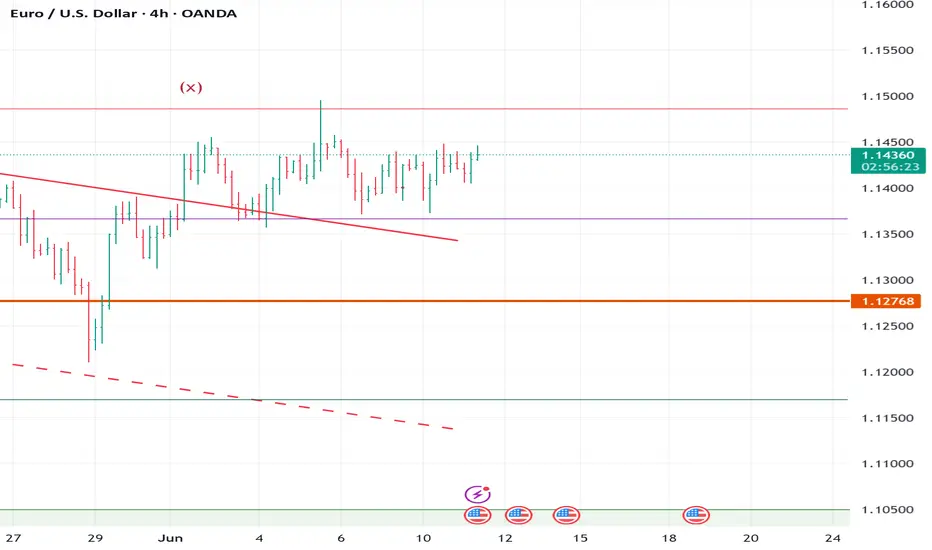
Euro may reach seller zone and then continue to declineHello traders, I want share with you my opinion about Euro. In this chart, the price started to grow, bouncing from the support line, and soon reached the support level, which coincided with the buyer zone. Then it declined to support line, making the correction and then made an impulse up from this line to the resistance level, breaking the 1.1070 level. After this movement, the Euro made a correction and then continued to grow and broke the resistance level, which coincided with the seller zone, and even rose higher than the seller zone. But soon Euro turned around and started to decline and broke the 1.1455 level again, after which it declined to the support line inside the range. Price little grew near this line, but later broke the support line and continued to decline. It fell to the support level, which is the bottom part of the range, and then started to grow. Euro later reached the top part of the range, which is the resistance level, and not long time ago turned around and started to decline. So, after looking for this chart, I think that the Euro may enter to seller zone and then continue to decline inside the range. For this case, I set my TP at 1.1250 points. Please share this idea with your friends and click Boost 🚀
Disclaimer: As part of ThinkMarkets’ Influencer Program, I am sponsored to share and publish their charts in my analysis.

EURUSD SNIPER Smart Money
🎯 EUR/USD – Sniper Smart Money Setup | June 11, 2025
By Talion-Promosale
Pair: EUR/USD
Timeframe: 1H / 4H
Bias: Bullish (Smart Money Shift in Play)
Current Price: ~1.1435
🔍 Smart Money Breakdown:
Market Structure:
Internal structure has shifted bullish after a break of structure (BOS) at 1.1415.
Last significant swing low at 1.1380 has been liquidity swept (sell-side taken).
Now in a reaccumulation phase with bullish intent.
Liquidity Pools:
Resting buy-side liquidity above equal highs at 1.1460–1.1470
Clean sell-side liquidity was taken below 1.1380 (classic manipulation sweep)
Order Blocks (OB):
1H Bullish OB at 1.1405–1.1420
Price is currently reacting from this OB with displacement and market structure shift
Fair Value Gaps (FVG):
Imbalance (FVG) from 1.1430 to 1.1450
Potential short retracement into OB zone, before filling imbalance and expansion
🎯 Sniper Entry Plan:
📌 Long Setup:
Entry: 1.1420 (inside 1H OB)
Stop Loss: 1.1395 (below OB)
TP1: 1.1460 (liquidity grab)
TP2: 1.1500–1.1520 (premium array zone)
Risk: 1:2 to 1:3
Entry confirmation tools:
Displacement candle from OB
BOS after mitigation
RSI divergence confirmation optional
---
,🏂 Smart Note from Talion-Promosale:
This is a classic Sniper-style setup:
✅ Liquidity sweep
✅ OB mitigation
✅ Break of structure
✅ FVG to be filled
I'm anticipating EUR/USD to run the highs above 1.1460 once 1.1420 is confirmed as a valid mitigation point.
---
📈 Remember: Wait for confirmation. Let price come to your level. The sniper doesn’t chase — he waits. 🥷
#SmartMoney #EURUSD #SniperTrading #OrderBlock #LiquiditySweep #FVG #PriceAction #Forex #TalionPromosale #ICTStyle #TradingView
Talion-promosale
EURUSD: Bears Will Push
The recent price action on the EURUSD pair was keeping me on the fence, however, my bias is slowly but surely changing into the bearish one and I think we will see the price go down.
Disclosure: I am part of Trade Nation's Influencer program and receive a monthly fee for using their TradingView charts in my analysis.
❤️ Please, support our work with like & comment! ❤️


EURUSD | Bearish Bias Below 1.1450, Eyes on 1.1372EURUSD | OVERVIEW
The pair maintains a bearish momentum as long as it trades below the pivot level at 1.1450, targeting the support at 1.1372. A clear break below this level would reinforce the downtrend, potentially extending the decline toward 1.1270.
Alternative Scenario:
A confirmed 1-hour candle close above 1.1450 would indicate a potential shift to a bullish trend, with upside targets at 1.1535, and possibly 1.1625.
Support Levels: 1.1372, 1.1270
Resistance Levels: 1.1535, 1.1625

ELLIOTT WAVE EURUSD H4 update
EW Trade Set Up H4
minute wave (ii) running
is not already clear wheter it will develope in a sideway or sharp correction usually wave 2 is sharp in a zigzag to 0.618 retracement value.
short term key levels (area)
1.1445
1.1425
1.1365 POC
1.1320
1.1220
EURUSD in bullish trend EURUSD in bullish trend expected trend reversal as RSI diversion can be seen.

EURUSD - Longs Today
📉 How This Trade Could Have Played Out – EURUSD, 15min Chart
This chart demonstrates a textbook example of how to use the ELFIEDT RSI + 3SD Reversion Strategy with additional RSI divergence to identify a high-probability reversal setup.
🟢 What Happened Here:
✅ Buy Signal Triggered
The script printed a green "UP" signal as price dipped sharply — closing beyond the lower volatility band with momentum in oversold territory and a spike in volume. This marked the initial mean reversion opportunity.
📉 RSI Divergence Formed
Just after the price made a lower low, the RSI formed a higher low — classic bullish divergence, showing underlying strength even as price dropped. This added confluence to the signal.
💡 Divergence-Based Entry Zone
With price recovering above the signal bar and RSI breaking upward, traders could use this divergence as a secondary confirmation entry — improving timing and confidence.
📈 Momentum Followed Through
After the signal and confirmation, price reversed strongly upward with a clear multi-candle move, offering multiple reward opportunities depending on your exit style.
✅ How to Trade It (Step-by-Step)
Wait for a signal label (green/red) from the script — this marks a statistically stretched price condition with volume support.
Add the RSI indicator to your chart.
Watch for divergence (price making a new low, but RSI not confirming) near the signal — this gives you a stronger reason to enter.
Look for a reversal candle (like a bullish engulfing, pin bar, or inside bar) for clean entry timing.
Use the previous low as a stop and target a 1:2 or better reward-risk ratio based on price structure.
🔁 Pro Tip: Top-Down Boost
This exact signal is even more powerful if a similar setup appears on the 1-hour and 5-minute charts around the same area.
✅ When multiple timeframes agree, it’s a higher-probability zone to enter.
🧠 This approach blends statistics, momentum, and price action — giving you structure and flexibility as a trader.

Eurusd D Updatei buy eurusd 3 time{yellow line]
now we hit first take profit so we put stop loss on entry price and we keep eurusd for next take profit

EURUSD shortThe Setup:
1. A-B: Strong impulsive drop on increasing volume → clear evidence of real selling pressure.
2. B-C: Pullback forms on decreasing volume → classic corrective behavior, not buyer aggression.
3. C-D: Entry just below point C as new volume confirms sellers stepping back in.
4. Targeting >3R with stop tucked above C — logical structure, clean invalidation.
✅ Volume confirms the trend
✅ Structure is tight, no randomness
✅ Timing aligns with volatility spike (news at the bottom?)
✅ Clear bearish continuation pattern
what do you think of this a head of cpi?

EURUSD SHORT FORECAST Q2 W24 D11 Y25EURUSD SHORT FORECAST Q2 W24 D11 Y25
Professional Risk Managers👋
Welcome back to another FRGNT chart update📈
Diving into some Forex setups using predominantly higher time frame order blocks alongside confirmation breaks of structure.
Let’s see what price action is telling us today!
💡Here are some trade confluences📝
✅Weekly order block
✅15' order block
✅4 hour order block
✅Tokyo ranges to be filled
🔑 Remember, to participate in trading comes always with a degree of risk, therefore as professional risk managers it remains vital that we stick to our risk management plan as well as our trading strategies.
📈The rest, we leave to the balance of probabilities.
💡Fail to plan. Plan to fail.
🏆It has always been that simple.
❤️Good luck with your trading journey, I shall see you at the very top.
🎯Trade consistent, FRGNT X

Possibility of uptrend It is expected that after some fluctuations and corrections within the current range, the continuation of the upward trend will take place. Confirmation of the upward trend will be the consolidation of the price above the resistance range. Otherwise, the continuation of the downward trend to the specified support ranges will be possible.

Latest Published Ideas by UsersThis is not a trading idea, but some form of representing my desire, about to see again on TradingView, the great function that can help and improve the vision and knowledge about the current situation on the market, so effectively.
If you an individual user, member, and friend of TradingView, like this idea,
Click Boost Symbol!
Thank you! Have a great day.

EURUSD is bearish, I'm selling now!EURUSD is showing signs of bearishness, join the sellers early. Today is also CPI, it should push the market lower faster
TP1 @ 1.137
TP2 @ 1.135
Follow me so you'll see my trades on time and enter on time. Check my earlier posts and see for yourself

EURUSD SHORTDollar strength this week and month looks promising we have had some good meetings with China this week and there’s a lot of optimism around the dollar . However there’s a many stop losses above as we have many sell positions so i belive we will see a rally up and a big rejection and this trade could happen quickly .
We already had a successful setup with this thought process yesterday and i caught a long and a short however the real moves should kick in today .

Bearish drop?Fiber (EUR/USD) has reacted off the pivot which is a pullback resistance and could drop to the 1st support which is an overlap support.
Pivot: 1.1449
1st Support: 1.1371
1st Resistance: 1.1496
Risk Warning:
Trading Forex and CFDs carries a high level of risk to your capital and you should only trade with money you can afford to lose. Trading Forex and CFDs may not be suitable for all investors, so please ensure that you fully understand the risks involved and seek independent advice if necessary.
Disclaimer:
The above opinions given constitute general market commentary, and do not constitute the opinion or advice of IC Markets or any form of personal or investment advice.
Any opinions, news, research, analyses, prices, other information, or links to third-party sites contained on this website are provided on an "as-is" basis, are intended only to be informative, is not an advice nor a recommendation, nor research, or a record of our trading prices, or an offer of, or solicitation for a transaction in any financial instrument and thus should not be treated as such. The information provided does not involve any specific investment objectives, financial situation and needs of any specific person who may receive it. Please be aware, that past performance is not a reliable indicator of future performance and/or results. Past Performance or Forward-looking scenarios based upon the reasonable beliefs of the third-party provider are not a guarantee of future performance. Actual results may differ materially from those anticipated in forward-looking or past performance statements. IC Markets makes no representation or warranty and assumes no liability as to the accuracy or completeness of the information provided, nor any loss arising from any investment based on a recommendation, forecast or any information supplied by any third-party.

Important EURUSD UpdateYesterday, EURUSD continued to move sideways, with the market waiting for key news.
Today at 1:30 p.m. (London time), U.S. inflation data will be released.
This report has a strong impact and is likely to determine the next major move.
It is advisable not to open any new positions before the news is published.

Fiber holds Bullish (but not for long)## 1 Hour (Intraday)
!
1. **Order-block / Fair-Value Gap**
* The small 1H consolidation you’ve boxed (roughly 1.1420–1.1450) is a late-hour fair-value gap (FVG) that often resolves with a quick run to its edge.
* A drop into the lower end (1.137–1.138) gives you liquidity for your long and aligns with the 1D 50 % retrace (1.13475).
2. **Pending Entries**
* **Buy-limit @ 1.1300**: Still unfilled. If price dips there, it converges the 1D 62 %–70.5 % zones (1.1312–1.1287) plus the old daily high → high-probability long.
* **Sell-limit @ 1.1600**: Above today’s high, overlapping the 6 M FVG at 1.1575 and the 3 M opposing block.
3. **Probability & Timeline**
* **To 1.1300**: \~30 % shot over the next 24–48 h as banks chase stops under 1.135.
* **To 1.1600**: \~25 % chance intraday if FOMC jitters push USD weaker post-June 18.
---
## 1 Month (Position)
!
1. **Longer-term Fib & Time-zones**
* The full trough-to-peak fib (0 %→100 %) defines the 127 % extension at \~1.310, 227 % at \~1.214, 327 % at \~1.246.
* Your current clip sits just above the 127 % (1.310) retracement zone on a mini scale; the next *real* hurdle is the 227 % zone near 1.214/1.234 (old highs).
2. **Macro-Blocks**
* **3-month OB @1.1600**, **6-month FVG @1.1575**: your first “stop‐runs” on the way to the big opposing block at 1.2750 (500 %).
* Seasonal tailwinds tend to kick in around July–August as EU carry trades re-enter.
3. **Timeline & Odds**
* **Lift into 1.1575–1.1600**: \~60 % chance by late June → early July.
* **Extension toward 1.214–1.234** (long-term target): \~30 % chance by Q4 2025, assuming US yields peak and EUR carry resumes.
---
### Live-Data Check (Today ≈ 1.1415)
* **Above 1.1375** (daily 50 %) → bullish tilt until proven otherwise.
* **Below 1.1450** (1H FVG top) → still in consolidation zone; gives you a low-risk long if you see a wick down to 1.137–1.138.
* **No invalidation**: you’ve got room to run both your buy and sell limits without being stopped out today.
---
## Overall Probability & Path
| Leg | Zone | Prob. | Target Window |
| -------------- | --------------------------- | ----- | -------------- |
| Intraday sweep | 1.137→1.145 consolidation | 70 %↑ | next 1–2 days |
| Buy-zone test | 1.1300 (62–70 % daily fib) | 30 % | next 24–48 h |
| Swing rally | 1.1575–1.1600 (6 M FVG/OB) | 55 % | June 18–July 5 |
| Position drive | 1.214–1.234 (227–327 % fib) | 30 % | Q3–Q4 2025 |
1. **Catalysts**:
* **June 18 FOMC** (watch the red line) will likely ignite the swing leg.
* **July seasonal flows** (month-end rebalancing) give the first bump into your fair-value blocks.
2. **Risk management**:
* Keep your stops below 1.1340 for intraday longs, or below 1.1250 for the monthly swing.
* Scale out 50 % at 1.1575, trail the rest into the big opposing block.
---
— S.Atrial
EURUSD SHORTFrom April 7th to June 2nd 2025, the market have been rejected at the monthly S/R/PP aera many times and now sells have step into the mkt and they are pushing the mkt to the down side. On the daily time frame at the monthly support resistance piovt point aera the mkt form an INSIDE BAR CANDLESTICK PATTERN that shows that there is a consolidation going on on the 1h TF, so at this point the mkt is telling me that is time to go down 👇. My own thought

EUR/USDTRADE 5 again eu has hit a level and i believe it to go short, this doesnt mean jump into the trade im just looking at where price could go. i belive it to be a good move and we can start to catch these small moves and make profit from them but for now we will just keep are eye on the supply and demand box and see what happends with it
