POTENTIAL EURUSD SHORT OPPORTUNITY...POSITION TRADEHello hello TradingView family! Hope you guys are doing amazingly well! Just wanted to come on here and make another post for a potential longer term opportunity I am seeing on the major currency pair EURUSD. So put your seat belts on and let's dive in!!
OK so I'm going to keep this very very simple. Not because I don't want to go in depth but because my trading is very simple and I'm just going to give it to you straight. So here are the points
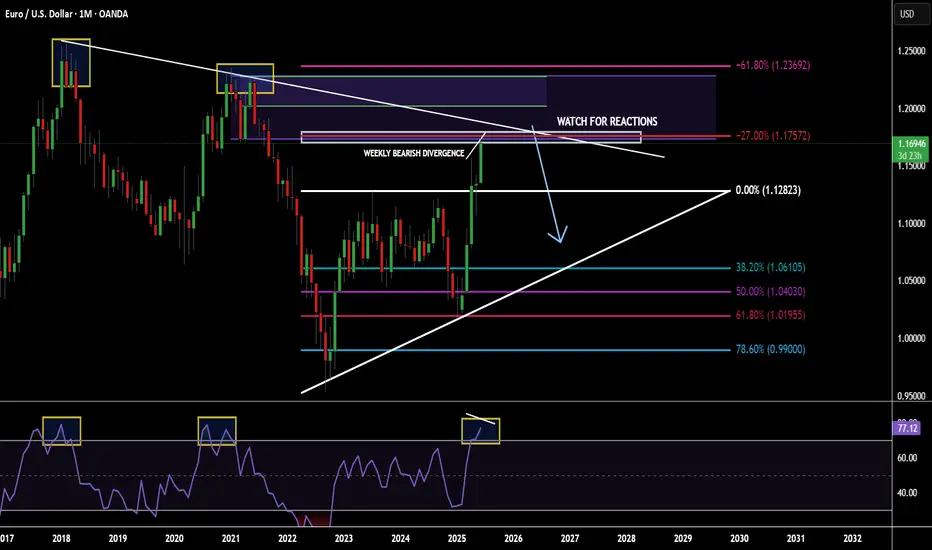
1. Price is @ monthly supply
2. Price has made new highs & sitting at a monthly fib extension
3. Monthly RSI overbought conditions
4. Weekly has bearish divergence forming
5. Weekly/Daily buyer is slowing down
Make sense? If not..then I know you will figure it out. Watch for price to potentially poke a little higher but nice confluences for a fall in price. Appreciate you all!
EURUSD_SPT trade ideas
EURUSD , WThe EUR/USD reached the top of the channel on the weekly frame, and I think it's a good time to sell.
Also, the RSI had enough buying.
FIRST TARGET: 1.12100
This is what I expected.It is not a buy or sell recommendation.
Good luck.

EURUSD Bounce on the 4H MA100 eyes 1.2000.The EURUSD pair has been trading within a Channel Up pattern since the May 12 Low. Right now it is expanding its 3rd Bearish Leg of this structure, with the previous two reaching at least either the 4H MA100 (green trend-line) or the 0.5 Fibonacci retracement level before rebounding.
As a result, we expect a rebound soon around the 1.16500 level to start the new Bullish Leg. The last two peaked on the 1.5 Fibonacci extension, which gives us a clear Target at 1.2000.
Notice also that every time the 4H MACD formed a Bullish Cross below the 0.0 mark, it was a confirmed buy signal. Use that to your advantage.
-------------------------------------------------------------------------------
** Please LIKE 👍, FOLLOW ✅, SHARE 🙌 and COMMENT ✍ if you enjoy this idea! Also share your ideas and charts in the comments section below! This is best way to keep it relevant, support us, keep the content here free and allow the idea to reach as many people as possible. **
-------------------------------------------------------------------------------
Disclosure: I am part of Trade Nation's Influencer program and receive a monthly fee for using their TradingView charts in my analysis.
💸💸💸💸💸💸
👇 👇 👇 👇 👇 👇

SHORT ON EUR/USDEU has given a nice bearish setup with a rising channel.
I will be selling EU to the next demand level looking to catch 200-300 pips.

EURUSD 15M BEAR LOOKS LIKE THERE READY TO TAKE CONTROLWe have this beautiful CHOCH in small time frame, and with the help of SUPPLY ZONE 15M makes no brainer to go for SELL
This can be very big DUMP
As usual win lost i will update here
Just remember is not about how many time you lost is how big you get when you win (RISK REWARD NEEDS TO BE ON POINT)
Good luck

EURUSD – A Potentially Busy Day Ahead For TradersThis morning, EURUSD recorded a near 4 year high at 1.1807, the beneficiary of improving risk sentiment, uncertainty about the ECB’s next interest rate move, and concerns about what President Trump’s tax cut bill, that is progressing through the Senate currently, could mean for the sustainability of the US debt burden moving forward.
Now, with the FX quarter end rebalancing completed yesterday, it is possible to look forward to the upcoming scheduled events for today that could influence where EURUSD moves next.
First up, at 1000 BST this morning, traders receive the latest preliminary inflation (HICP) update for the Eurozone. The outcome of this release could provide further insight into whether the current market expectation for one more ECB rate cut in 2025 is possible, or if they may be on hold for the foreseeable future.
Next up, starting at 1430 BST is a panel discussion attended by ECB President Lagarde, Fed Chairman Powell, BoE Governor Bailey and BoJ Governor Ueda at the ECB’s Central Bank Forum in Portugal. The topic, “adapting to change: macroeconomic shifts and policy responses”. The comments of these central bank heads on inflation, interest rates, tariffs and economic growth could be important for the direction of all the major G7 FX pairs.
Then, at 1500 BST the ISM Manufacturing PMI survey is due for release. While US manufacturing activity is still expected to languish in contraction territory, below 50, traders will be focused on whether there has been any improvement in the headline print, and what the prices paid component could indicate for the direction of US inflation across the remainder of 2025.
These events, when taken with real time updates from President Trump and members of this administration on his tax bill, trade deals and flexibility of the July 9th tariff deadline, sets today up as a potentially volatile period for EURUSD trading.
Technical Update: Assessing the Recent Trend
From a technical perspective, a positive pattern of higher highs and higher lows remains in the EURUSD price and as the chart below shows, Tuesday has seen another new recovery high posted at 1.1807.
While much will continue to depend on market sentiment and price trends, it might be argued that the posting of this new price high for the current upside move, suggests a further phase of strength is still possible.
However, what are the levels traders may now be watching to gauge where the next directional price risks might lay over coming sessions?
Potential Support Levels:
Since posting the June 19th session low at 1.1446, EURUSD has rallied by over 3.00% (1.1446 to 1.1807) and while this doesn’t mean price weakness is necessarily on the cards, traders might become concerned a price correction is due after such a strong advance.
As the chart above shows, the 38.2% Fibonacci retracement of latest price strength, currently stands at 1.1668. This can mark a potential first support focus, after the recent move higher.
Closing breaks under 1.1668, while not a guarantee of further price declines, may then lead to a deeper phase of weakness towards 1.1583, which is equal to the 61.8% retracement level.
Potential Resistance Levels:
As a result of latest strength, EURUSD has traded to levels last seen in mid-September 2021 and to gauge the next potential resistance levels, we switch to the longer term weekly chart shown below.
If further price strength still emerges from current levels, traders may now be focused on 1.1909, the August 2021 failure high, as the next possible resistance level.
The material provided here has not been prepared accordance with legal requirements designed to promote the independence of investment research and as such is considered to be a marketing communication. Whilst it is not subject to any prohibition on dealing ahead of the dissemination of investment research, we will not seek to take any advantage before providing it to our clients.
Pepperstone doesn’t represent that the material provided here is accurate, current or complete, and therefore shouldn’t be relied upon as such. The information, whether from a third party or not, isn’t to be considered as a recommendation; or an offer to buy or sell; or the solicitation of an offer to buy or sell any security, financial product or instrument; or to participate in any particular trading strategy. It does not take into account readers’ financial situation or investment objectives. We advise any readers of this content to seek their own advice. Without the approval of Pepperstone, reproduction or redistribution of this information isn’t permitted.

CHECK EURUSD SIGNAL READ CAPTAINeurusd ) sell zone
( trade satup)
entry point (1.17900) to (1.17800) 📊
first tp (1.17500)📊
2nd target (1.17100) 📊
last target (1.16800) 📊
stop loss (1.18200)❌

Bearish drop for the Fiber?The price is rising towards the pivot which acts as an overlap resistance and could drop to the 1st support.
Entry: 1.1743
1st Support: 1.1631
1st Resistance: 1.1833
Risk Warning:
Trading Forex and CFDs carries a high level of risk to your capital and you should only trade with money you can afford to lose. Trading Forex and CFDs may not be suitable for all investors, so please ensure that you fully understand the risks involved and seek independent advice if necessary.
Disclaimer:
The above opinions given constitute general market commentary, and do not constitute the opinion or advice of IC Markets or any form of personal or investment advice.
Any opinions, news, research, analyses, prices, other information, or links to third-party sites contained on this website are provided on an "as-is" basis, are intended only to be informative, is not an advice nor a recommendation, nor research, or a record of our trading prices, or an offer of, or solicitation for a transaction in any financial instrument and thus should not be treated as such. The information provided does not involve any specific investment objectives, financial situation and needs of any specific person who may receive it. Please be aware, that past performance is not a reliable indicator of future performance and/or results. Past Performance or Forward-looking scenarios based upon the reasonable beliefs of the third-party provider are not a guarantee of future performance. Actual results may differ materially from those anticipated in forward-looking or past performance statements. IC Markets makes no representation or warranty and assumes no liability as to the accuracy or completeness of the information provided, nor any loss arising from any investment based on a recommendation, forecast or any information supplied by any third-party.

EURUSD: overboughtFriday was a non-working day in the US, as the country was celebrating Independence Day. The most important weekly macro data was related to US jobs data. At the start of the week JOLTs job openings in May were posted with a figure of 7.769M, significantly higher from market estimate of 7,3M. The next day the NFPs and Unemployment rate was published. As per data, the unemployment rate dropped by 0,1pp to the level of 4,1%, which missed market expectations of 4,2%. The Non-farm payrolls in June added 147K new jobs, again better from forecasted 110K. The average hourly earnings were higher by 0,2% in June, or 3,7% on a yearly basis, modestly below the forecasted 3,9%. Other weekly macro data including ISM Manufacturing PMI in June reached 49,0 a bit higher from estimated 48,8. The ISM Services PMI in June was standing at 50,8 in line with market estimates.
Retail Sales in Germany dropped by an additional -1,6% in May, bringing the indicator to the level of +1,6% on a yearly basis. Both figures were lower from the market estimate of +0,5% for May and +3,3% for the year. Inflation rate in Germany preliminary in June was 2% a bit lower from forecasted 2,2%. Inflation for the month was standing at 0%. Preliminary inflation data for the Euro Zone in June was 0,3% for the month and 2% for the year. EuroZone core inflation was standing at 2,3% in June, exactly in line with market estimates. The unemployment rate in the Euro Zone in May was modestly increased by 0,1pp to the level of 6,3%, while the market was expecting to remain flat at 6,2%.
The US Dollar continued its decline against the euro during the previous week. The highest weekly level was at 1,1825, but the currency pair closed the week at 1,1776. The RSI reached the level of 73, signalling a clear overbought market side, increasing the probability of a short term reversal in the coming period. The MA50 continues to diverge from MA200, indicating low probability of a potential cross in the future period.
The eurusd daily chart is showing that the currency pair had formed a sort of channel with an uptrend during the past period. If lows from end of February, mid March and end of March are connected, the indication for a next potential level of eurusd might be somewhere above the 1,16 level. The 1,1620 was the highest level achieved in mid July this year, which aligns well with the previous indication. Indicators are currently showing higher probability of a short term reversal. The week ahead is not bringing any currently significant news with respect to the US economy, in which sense, it could be expected that the market will slow down a bit during the week. Short reversal is quite possible, where the level of 1,1620 might be shortly tested. Just in case that the market decides to continue movement toward the higher grounds, then 1,18 resistance will be tested, before the market continues its road toward the 1,19 level.
Important news to watch during the week ahead are:
EUR: Industrial Production in May in Germany, Retail Sales in the Euro Zone for May, Balance of Trade in Germany in May, Inflation rate final for May in Germany,
USD: FOMC Meeting minutes.

Bearish drop?The Fiber (EUR/USD) is rising towards the pivot and could drop to the 1st support which acts as a pullback support that is slightly below the 161.8% Fibonacci extension.
Pivot: 1.1768
1st Support: 1.1700
1st Resistance: 1.1816
Risk Warning:
Trading Forex and CFDs carries a high level of risk to your capital and you should only trade with money you can afford to lose. Trading Forex and CFDs may not be suitable for all investors, so please ensure that you fully understand the risks involved and seek independent advice if necessary.
Disclaimer:
The above opinions given constitute general market commentary, and do not constitute the opinion or advice of IC Markets or any form of personal or investment advice.
Any opinions, news, research, analyses, prices, other information, or links to third-party sites contained on this website are provided on an "as-is" basis, are intended only to be informative, is not an advice nor a recommendation, nor research, or a record of our trading prices, or an offer of, or solicitation for a transaction in any financial instrument and thus should not be treated as such. The information provided does not involve any specific investment objectives, financial situation and needs of any specific person who may receive it. Please be aware, that past performance is not a reliable indicator of future performance and/or results. Past Performance or Forward-looking scenarios based upon the reasonable beliefs of the third-party provider are not a guarantee of future performance. Actual results may differ materially from those anticipated in forward-looking or past performance statements. IC Markets makes no representation or warranty and assumes no liability as to the accuracy or completeness of the information provided, nor any loss arising from any investment based on a recommendation, forecast or any information supplied by any third-party.

Short for the next swing low.Is EURO bull run gonna end?
ECB vs Fed Policy Paths
Federal Reserve officials are divided but generally more cautious about cutting rates soon. In mid-June the Fed held rates steady at 4.25–4.50% and forecast only two 25bp cuts in 2025
Chair Powell warned of “meaningful” inflation coming from U.S. tariffs
implying cuts may be delayed. Indeed, Fed Governor Bowman recently said she would support a rate cut “as soon as” the July meeting if inflation remains contained
highlighting internal debate. In contrast, the ECB has already started lowering rates. After its June 5 decision to cut 25bp to 2.0%, Goldman Sachs analysts see two more ECB cuts (bringing deposit rates toward ~1.5% by year-end)
As one strategist noted, “market pricing now shows a big gap between ECB and Fed rate cut expectations…Fed remains hamstrung by inflation,” keeping U.S. yields relatively high
a stickier Fed (fewer cuts) versus a more dovish ECB (more cuts) would favor USD strength and EUR weakness.
Geopolitical and Eurozone Risks
Europe’s two largest economies face looming elections and weak coalitions. Fitch Solutions notes “Germany is set to hold early elections in February 2025” complicated by far-right gains, while France “is currently being governed by a weak coalition” with rising debt risks
Such instability can undermine confidence in the euro.
Slow growth: Eurozone growth is sluggish. After a 0.2% contraction in Germany, Fitch warns that “Germany and Italy weighing on aggregate growth forecasts” in 2025
Anemic output makes the euro vulnerable, especially if the U.S. economy outperforms.
Labor market tightening: Euro-area unemployment is low (~6.3%), but conditions are “unjustifiably tight” given the weak economy
Any economic slowdown could quickly raise Eurozone joblessness, pressuring the euro.
Trade/tariff risks: A return to U.S. protectionism (e.g. renewed tariffs) could hit European exporters. Trump presidency could strain EU–US relations and dent demand for Eurozone exports
Even talk of fresh tariffs tends to boost the safe-haven dollar over the euro.

EUR/USD – Potential Bearish Reversal AheadAnalysis Overview:
EUR/USD has shown a strong bullish structure recently, but price is currently near a key resistance zone around 1.1780, which may act as a reversal point. The chart also shows an extended wave structure, signaling possible exhaustion of buying pressure.
Bearish Setup Expectations:
If the price fails to break above 1.1780 convincingly and shows bearish confirmation (e.g. a strong bearish engulfing candle or RSI divergence), we may see a reversal toward lower support levels.
Key Support Levels (Targets):
TP1: 1.14465
TP2: 1.13329
TP3: 1.12064
TP4: 1.10000
Possible Entry: Near 1.1770 – 1.1785 (on bearish confirmation)
Stop Loss: Above 1.1810 (structure invalidation)
Technical Confluences:
Potential Double Top or Rising Wedge pattern
Price at historical resistance
Overbought RSI zones may support the reversal
---
📌 Note: Always wait for confirmation before entering. Use proper risk management and follow your trading plan strictly.

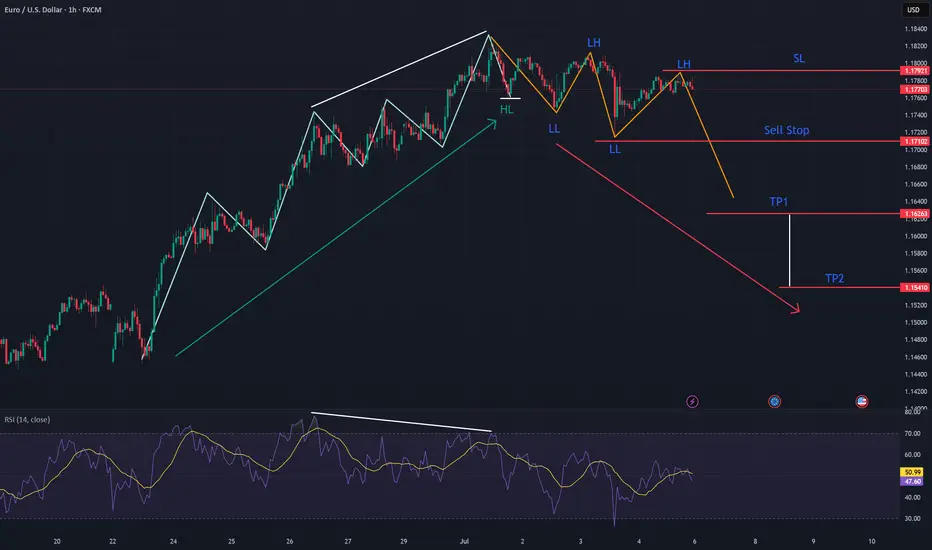
EURUSD: Potential Trend Reversal BrewingEURUSD is exhibiting clear signs of a potential trend reversal, having recently broken its previous Higher Low and subsequently establishing a sequence of Lower Highs and Lower Lows. This shift in market structure from bullish to bearish is a strong indicator of weakening upside momentum. Further confirming this outlook, the RSI is displaying a notable bearish divergence, where price registers higher highs while the RSI prints lower highs, signaling diminishing bullish strength at these elevated price levels. Considering this confluence of technical factors, a potential short setup is present.
EurUsd - This is the deadly breakout!EurUsd - FX:EURUSD - is about to fly:
(click chart above to see the in depth analysis👆🏻)
EurUsd has been rallying about +15% over the past couple of months. Additionally the breakout at the current resistance trendline is about to be confirmed. Subsequently EurUsd is setting up for another major move higher, which will be painful for all European traders.
Levels to watch: $1.23, $1.11
Keep your long term vision🙏🙏
Philip (BasicTrading)

EURUSD - Where next?Looking at EURUSD
I still feel like we are due some sort of deeper retracement to the downside considering how bullish the 4H and Daily time frame have been in recent times.
Although the market does not care how I feel in all honesty haha. I will play the short term short until the 15min orderflow switches bullish once again.
The expansion that is currently happing right now is very interesting and makes a good watch to see what we will do come market open as we are engineering liquidity for both a buy and sell with both POI's looking primed for entries.
Will be keeping a close and keen eye on EURUSD when the market opens
Any questions feel free to give me a message

EURUSD - trade - market structureDXY - trade - market structure , easy setup, clean setup , good probability, if this happen is a big win, use risk and trade managment
EURUSD SELL SIGNALThe EURUSD is currently trading within an ascending angle channel. Price currently approaches the edge of the channel.
STOP LOSS - 1.18261
TP - 1.16000( Major support line)
Swing trade - Possible trade completion time { 5 -10days}
Risk wisely.

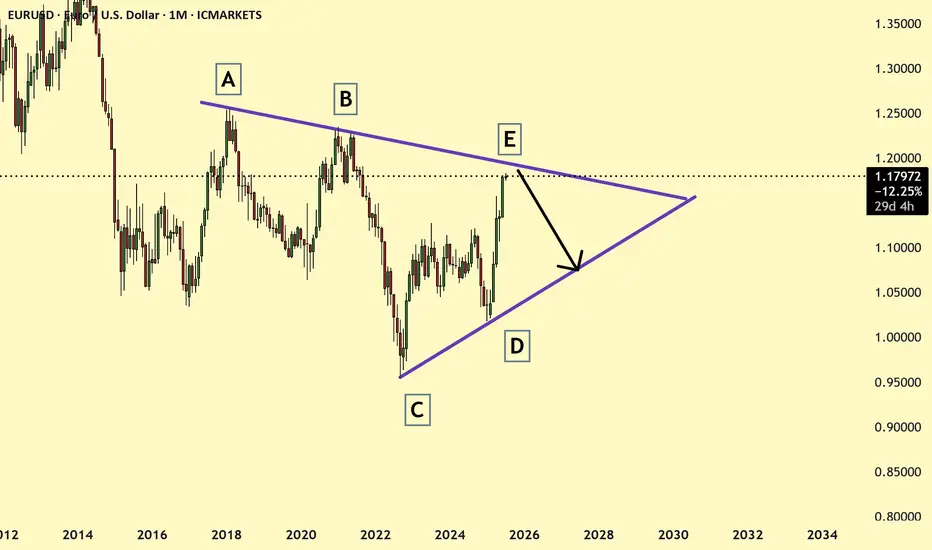
EURUSD monthly pattern shows symmetrical triangle resistance ! EURUSD monthly pattern showing price reaching the symmetrical triangle resistance and currently price is nearing the resistance and may soon the price may reverse and look for the reversal on 4 hr or daily charts.
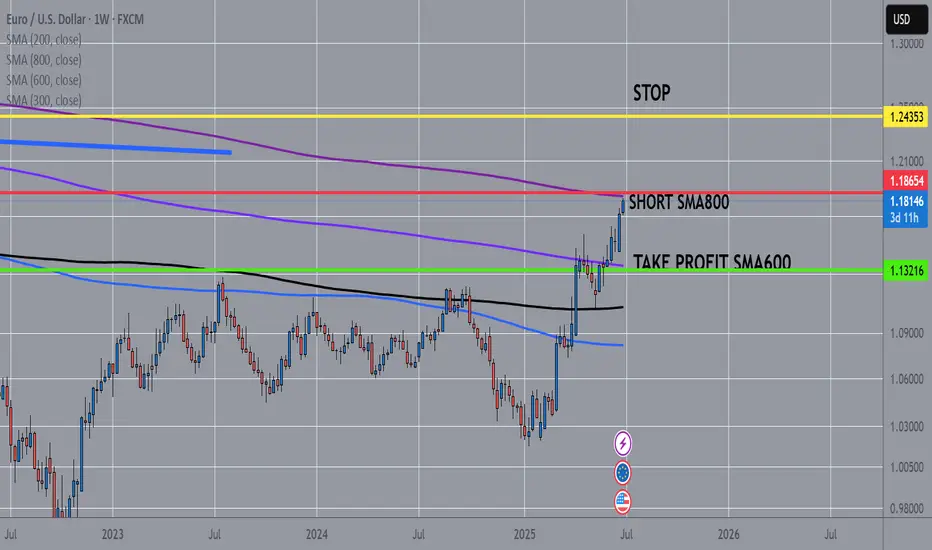
EURUSD Major event Short Weekly ChartWe may be on the verge of a major event in the forex market.
The EUR/USD is approaching its 800-week moving average, a level that historically marks significant turning points.
A sharp reversal is likely, with an initial target at the 600-week moving average, and potentially a much deeper decline beyond that.
EURUSD Will Go Down!
HI,Traders !
#EURUSD is making a
Bullish rebound after a
Bearish breakout but the
Pair will soon hit a new
Horizontal resistance
Of 1.17489 from where
We will be expecting a
Further move down !
Comment and subscribe to help us grow !

EURUSD is in a Downside DirectionHello Traders
In This Chart EURUSD HOURLY Forex Forecast By FOREX PLANET
today EURUSD analysis 👆
🟢This Chart includes_ (EURUSD market update)
🟢What is The Next Opportunity on EURUSD Market
🟢how to Enter to the Valid Entry With Assurance Profit
This CHART is For Trader's that Want to Improve Their Technical Analysis Skills and Their Trading By Understanding How To Analyze The Market Using Multiple Timeframes and Understanding The Bigger Picture on the Charts

EURUSD : TodayToday looks like a good day.
Price is weakening.
Confirmation by the end of this day should be good with price BELOW the POC.
Good luck.

DeGRAM | EURUSD fixed under the resistance level📊 Technical Analysis
● Price is stalling against the upper band of a three-month rising channel (≈ 1.1790) after producing a false break and quick rejection—marking a potential bull-trap at trend resistance.
● Bearish divergence on the 4 h RSI and the first lower-high inside a micro rising wedge suggest momentum is fading; a slide through 1.1745 should trigger profit-taking toward the mid-channel support at 1.1595.
💡 Fundamental Analysis
● Solid US payrolls and a hawkish tone in FOMC minutes lift two-year yields, reviving the dollar bid, while post-election coalition wrangling in France keeps a risk premium on the euro.
✨ Summary
Sell 1.1785 ± 15 pips; break below 1.1745 targets 1.1595. Invalidate on a 4 h close above 1.1810.
-------------------
Share your opinion in the comments and support the idea with a like. Thanks for your support!
