EURUSD is in a Downside DirectionHello Traders
In This Chart EURUSD HOURLY Forex Forecast By FOREX PLANET
today EURUSD analysis 👆
🟢This Chart includes_ (EURUSD market update)
🟢What is The Next Opportunity on EURUSD Market
🟢how to Enter to the Valid Entry With Assurance Profit
This CHART is For Trader's that Want to Improve Their Technical Analysis Skills and Their Trading By Understanding How To Analyze The Market Using Multiple Timeframes and Understanding The Bigger Picture on the Charts
EURUSD_SPT trade ideas

EURUSD : TodayToday looks like a good day.
Price is weakening.
Confirmation by the end of this day should be good with price BELOW the POC.
Good luck.

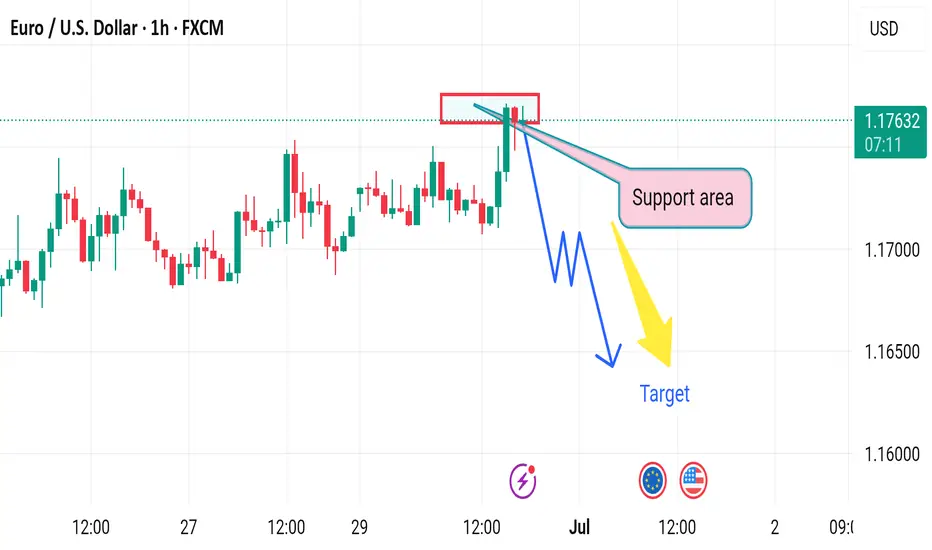
EURUSD INTRADAY TRADE 30PIPS SHORT LIVE TRADE EUR/USD eases below 1.1800 ahead of Eurozone inflation data
EUR/USD is retreating below 1.1800 in the European morning on Tuesday. The pair faces headwinds from a pause in the US Dollar downtrend. Traders move on the sidelines ahead of the Eurozone prelim inflation data and central bank talks due later in the day.

Bullish rise?The Fiber (EUR/USD) has reacted off the pivot and could rise to the 1st resistance.
Pivot: 1.1578
1st Support: 1.1278
1st Resistance: 1.1909
Risk Warning:
Trading Forex and CFDs carries a high level of risk to your capital and you should only trade with money you can afford to lose. Trading Forex and CFDs may not be suitable for all investors, so please ensure that you fully understand the risks involved and seek independent advice if necessary.
Disclaimer:
The above opinions given constitute general market commentary, and do not constitute the opinion or advice of IC Markets or any form of personal or investment advice.
Any opinions, news, research, analyses, prices, other information, or links to third-party sites contained on this website are provided on an "as-is" basis, are intended only to be informative, is not an advice nor a recommendation, nor research, or a record of our trading prices, or an offer of, or solicitation for a transaction in any financial instrument and thus should not be treated as such. The information provided does not involve any specific investment objectives, financial situation and needs of any specific person who may receive it. Please be aware, that past performance is not a reliable indicator of future performance and/or results. Past Performance or Forward-looking scenarios based upon the reasonable beliefs of the third-party provider are not a guarantee of future performance. Actual results may differ materially from those anticipated in forward-looking or past performance statements. IC Markets makes no representation or warranty and assumes no liability as to the accuracy or completeness of the information provided, nor any loss arising from any investment based on a recommendation, forecast or any information supplied by any third-party.

MarketBreakdown | EURUSD, GBPUSD, USDJPY, USDCHF
Here are the updates & outlook for multiple instruments in my watch list.
1️⃣ #EURUSD weekly time frame 🇪🇺🇺🇸
The pair is unstoppable.
The market violated a significant weekly resistance cluster last week.
It opens more growth potential after a pullback.
2️⃣ #GBPUSD weekly time frame 🇬🇧🇺🇸
In comparison to EURUSD, GBPUSD is now approaching a major
resistance area. I think that we can expect a retracement from that.
3️⃣ #USDJPY daily time frame 🇺🇸🇯🇵
The market continues a correctional movement lower.
The closest strong support that I see is based on a rising trend line.
I think that buying interest may spark again after its text.
4️⃣ #USDCHF daily time frame 🇺🇸🇨🇭
The price updated a historic low on Friday.
The next strong support that I see is based on a falling trend line.
We can expect a pullback from that.
Do you agree with my market breakdown?
❤️Please, support my work with like, thank you!❤️
I am part of Trade Nation's Influencer program and receive a monthly fee for using their TradingView charts in my analysis.

NFP Bears gathering their troops? or will the Bulls stampede...The past 9 days have been quite interesting for the EUR/USD which has been relentless. Price has been rising like a helium balloon let loose at the park...
Bulls have clearly been in control, not only the past 9 days but since the beginning of the year with the exception of the strong pullback in April & May only to bounce for another 700 pip run.
I am totally USD bearish across the board as I have been mentioning in my analysis videos for the past few months but like all macro moves, we always have pullbacks along the way and that is why I have been shorting the EUR/USD back from 1.1500+ - 1.1700+
I've given this a lot of room to breathe, more than usual but considering the following technical setup, I'm willing to give the Bears some leeway and potentially show me they'll come through.
•Rising Broadening pattern (Where two trendlines start close together only to divergence and expand) - This is a bearish pattern.
•Negative Divergence on the MACD, Linear Regression & the RSI.
•Price has made a run to the yearly R3 pivot level. (Rare extension)
•Last daily candle is a hanging man candlestick (Reversal candle)
•Weekly chart has the EUR/USD at the upper band of a polynomial regression channel which calculates for price extremities in the market.
There are a few more setups as well but it's too much to describe here and I'd have to show it in a video (Which I plan to do over the weekend)
With all of that said... It could all fail lol but seriously speaking... You just can't ask for a better probabilistic setup so whatever happens during NFP... happens.
Aside from the technical aspect... I know yearly R2 around 1.1600 was a hotspot for shorts because divergence was at the early stages and taking a short there wouldn't have been a bad idea but we know institutions are in play as well, so above 1.1600 could have been a huge area to run stop losses and margin calls before a potential reversal.
250 pips would be enough to run a large pool of stops and liquidation.
IF price is going to reverse here during NFP, I believe late longs and breakout/pullback traders are going to try and buy at the trendline at 1.1660ish but it wont hold and trap them on the other side of the trade.
Under that, I can see us pulling back towards 1.1200ish...
If the Bears give up and price continues to climb... the original macro target may very well be under way which was 1.2000 - 1.2200 (Based on a Monthly and 3-Month chart analysis)
As of this writing the EUR/USD is pretty much completely flat which is expected before the NFP fireworks ahead of July 4th.
We'll see what happens tomorrow morning! buckle up!
As always, Good luck and Trade Safe! See you post NFP.

EUR/USD Extends Rally – Watching Resistance at 1.18000Hi Everyone,
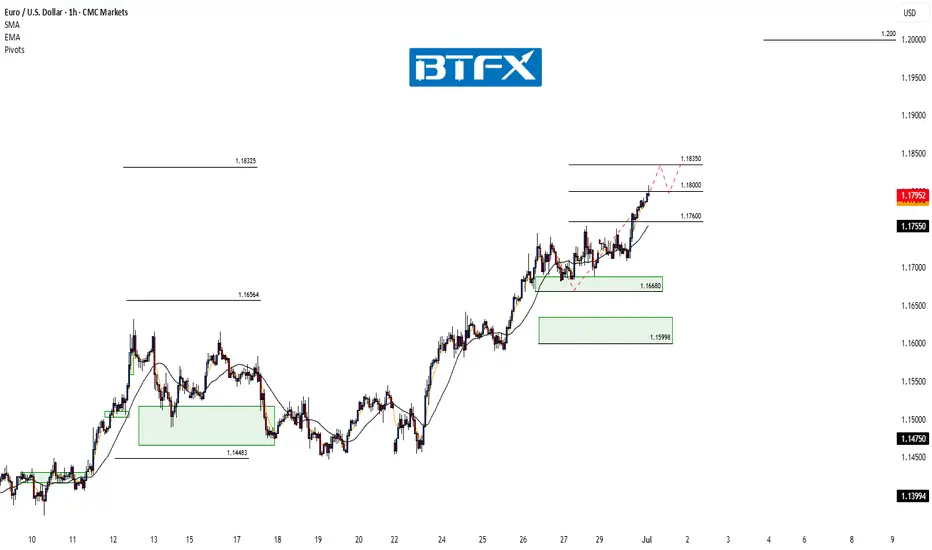
We anticipated a retest of the 1.17400 level coming into this week, setting the stage for further upside toward our highlighted targets at 1.17600 and 1.18000. Monday delivered, with a sharp move higher that saw EUR/USD break cleanly above 1.17400 and extend to 1.17600, bringing the 1.18000 level into focus.
As previously noted, we expect dynamic resistance around the 1.18000 area and will provide further updates on the projected path for EUR/USD should price test or breach this level.
The longer-term outlook remains bullish, with expectations for the rally to extend towards the 1.2000 level, provided the price holds above the key support at 1.10649.
We will continue to update you throughout the week with how we’re managing our active ideas and positions. Thanks again for all the likes/boosts, comments and follows — we appreciate the support!
All the best for a good end to the week. Trade safe.
BluetonaFX
EURUSD: Strong Bearish Sentiment! Short!
My dear friends,
Today we will analyse EURUSD together☺️
The recent price action suggests a shift in mid-term momentum. A break below the current local range around 1.17775 will confirm the new direction downwards with the target being the next key level of 1.17696.and a reconvened placement of a stop-loss beyond the range.
❤️Sending you lots of Love and Hugs❤️

DeGRAM | EURUSD downturn in the channel📊 Technical Analysis
● Price is capped by a confluence of the June-July down-sloping channel roof and the former median resistance line at 1.1780; the last three candles form lower highs inside a micro bear-flag.
● Intraday structure now leans on the 1.1745–1.1750 support cluster: a break beneath this shelf completes the flag and exposes the channel floor/June pivot at 1.1690.
💡 Fundamental Analysis
● Pre-NFP dollar demand is rebuilding as ADP and ISM-services beat consensus, while French election uncertainty revives euro risk premium.
✨ Summary
Sell 1.1775 ± 5 pips; sustained trade below 1.1745 targets 1.1690. Short thesis void if 30-min candle closes above 1.1800.
-------------------
Share your opinion in the comments and support the idea with a like. Thanks for your support!
EURUSD Under Pressure! SELL!
My dear subscribers,
My technical analysis for EURUSD is below:
The price is coiling around a solid key level - 1.1726
Bias - Bearish
Technical Indicators: Pivot Points High anticipates a potential price reversal.
Super trend shows a clear sell, giving a perfect indicators' convergence.
Goal - 1.1612
My Stop Loss - 1.1783
About Used Indicators:
By the very nature of the supertrend indicator, it offers firm support and resistance levels for traders to enter and exit trades. Additionally, it also provides signals for setting stop losses
Disclosure: I am part of Trade Nation's Influencer program and receive a monthly fee for using their TradingView charts in my analysis.
———————————
WISH YOU ALL LUCK

Eurusd technical analysis.Eurusd techinical analysis next move posibale at h1 time frame.not finchinal advice.

Another RR2 Position On EURUSDThesis: EUR/USD is showing signs of exhaustion near the 1.1800 psychological resistance, with price rejecting the upper band of a recent range.
Entry: 🔻 Sell at 1.17883 (current price action confirms rejection)
Stop-Loss: 🔺 1.17943 – Above recent swing high and psychological resistance
Take-Profit: ✅ 1.17767 – Targeting the lower bound of the recent range and prior support
Risk-Reward Ratio: ~1:2 – High conviction setup with tight risk and extended downside potential

EURUSD Bullish Setup: Watching for a Break and Retest📈 Looking at EURUSD right now, we’re in a strong bullish structure 🔼 — but it’s clearly overextended 🚀
As we head into the end of the week, there’s still potential for more upside today ⬆️ — but ⚠️ be cautious, since Fridays often bring retracements as we move into the weekly close 🕒📉
🔍 I’m watching for a bullish opportunity if we get a break above the current equal highs, followed by a retest and failure to break back below 🧠📊
If that setup doesn’t materialize, we’ll simply step aside and abandon the idea 🚫
💬 Not financial advice — always trade at your own risk.

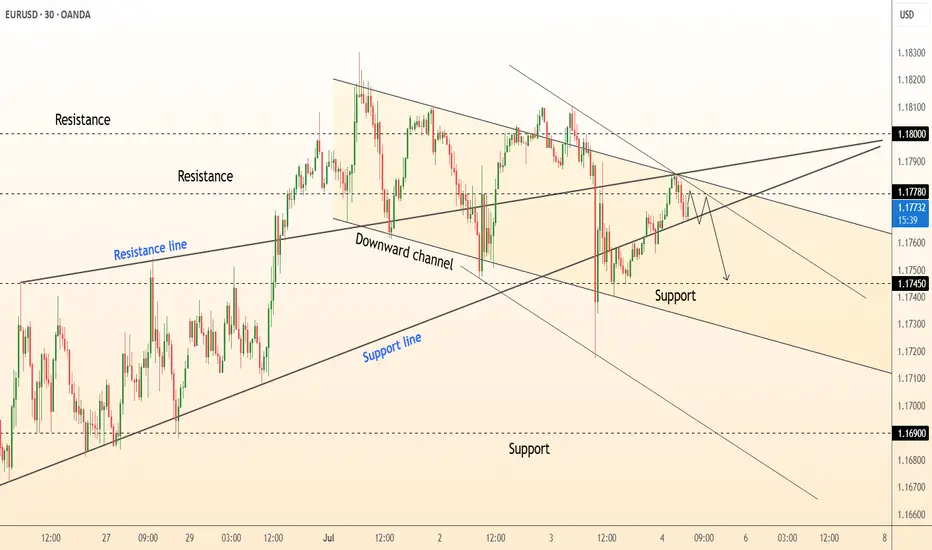
Market next move Disruption Analysis – Bullish Alternative Scenario
While the current chart suggests a bearish setup from a resistance zone (around 1.1765) toward a target near 1.1630, here's a potential bullish disruption that could invalidate the bearish thesis:
---
🟢 Bullish Disruption Possibility:
1. False Breakdown / Liquidity Grab:
Price may fake a dip below the red resistance-turned-support zone to trigger stop-losses before reversing.
This is known as a liquidity sweep or bear trap.
2. Higher Low Formation:
If the pair pulls back slightly but forms a higher low above 1.1700, it may signal bullish continuation.
3. Breakout Confirmation:
A strong bullish candle above 1.1775 could confirm continuation toward 1.1830–1.1850.
4. Fundamental Catalyst:
Positive EU economic news or dovish signals from the U.S. Fed could support Euro strength.
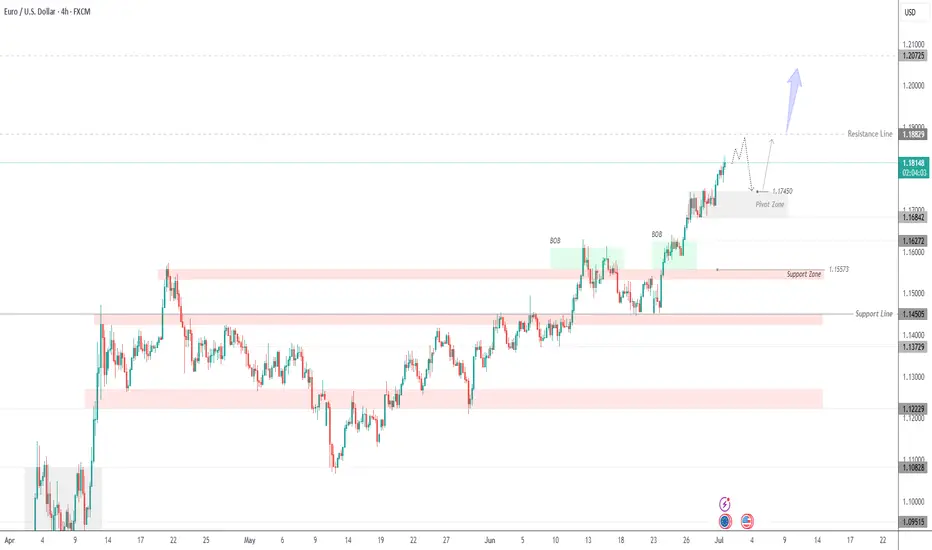
Euro Continues Bullish Trend | Eyes on 1.1882 & 1.2075EUR/USD – Strong Bullish Structure | Watching 1.1745 Pivot Zone for Reentry
The Euro continues to trade in a well-defined bullish trend, supported by institutional demand and clear price structure.
After breaking above the 1.1684 resistance zone, EUR/USD extended toward 1.1818 and now approaches the next resistance at 1.1882. This level may act as a temporary cap, but if breached with momentum, the pair could target the 1.2075 zone next.
Bullish Order Blocks (BOBs) marked on the chart highlight previous accumulation zones where buyers stepped in aggressively. These areas are still valid for demand-based pullbacks.
Key Area to Watch – 1.1745 Pivot Zone:
This level serves as a potential reentry point if the price retraces. As long as EUR/USD holds above this zone, bullish momentum remains intact. A confirmed bounce here could resume the uptrend toward 1.1882 and beyond.
However, a clean break below 1.1745 could open the door for a deeper correction toward 1.1627 or even 1.1557, which is the next major support zone.
Key Levels:
Resistance: 1.1882, 1.2075
Pivot Zone: 1.1745
Support: 1.1627, 1.1557
EURUSD 15M SELL ON THE CARD :)Sold @ 1.1730
Im expecting big DUMP, will update long term trade shortly
All the best on your trades this week
Happy PIPPINGS lol

EUR/USD Breakout Eyes 1.18 as Bullish Momentum BuildsEUR/USD has punched through the 78.6% Fibonacci retracement level (1.1744) of the July 2023–October 2023 decline, signaling strong bullish continuation. The breakout above the recent swing high near 1.1576 confirms the uptrend is gaining traction, supported by rising moving averages.
The 50-day SMA has crossed well above the 200-day SMA, maintaining a strong golden cross structure, reinforcing the bullish bias. Momentum indicators support the advance, with the RSI entering overbought territory at 73.79, and the MACD maintaining a positive spread above the signal line — a classic sign of trend strength rather than imminent reversal.
However, the overbought RSI suggests the pair could face some short-term consolidation or a shallow pullback before targeting the psychological 1.18 handle. Bulls would likely view any dip toward the breakout level (1.1576) as a potential buying opportunity.
As long as EUR/USD holds above that support, the path of least resistance remains to the upside, potentially paving the way for a full retracement toward the 1.19–1.20 zone seen last year.
-MW

EUR/USD 15M CHART PATTERNHere’s a structured summary of your EUR/USD sell trade setup:
---
📉 Trade Type: SELL
Entry Price: 1.17875
---
🎯 Take Profit Levels:
1. TP1: 1.17700
2. TP2: 1.17450
3. TP3: 1.17090
---
🛑 Stop Loss:
SL: 1.18315
---
🧮 Risk/Reward Overview:
Target Distance (pips) Reward:Risk (approx)
TP1 17.5 ~0.37:1
TP2 42.5 ~0.9:1
TP3 78.5 ~1.8:1
SL 44 —
---
Would you like help calculating lot size, risk percentage, or backtesting this setup?

EUR/USD SETUPEUR/USD SETUP; as price raids on buyside liquidity we wait for price to give us a valid change in the state of delivery

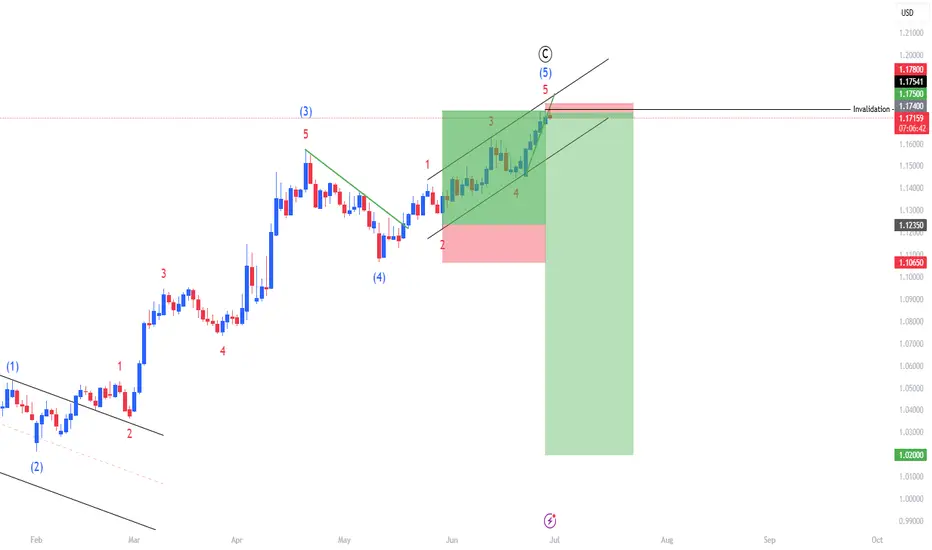
EURUSD - Eur bull run over??Completed Elliott Wave Structure:
• The chart displays a full 5-wave impulsive Elliott Wave count to the upside, labeled (1) through (5), completing a wave C.
• This suggests the end of a corrective ABC pattern, which often marks the end of a bullish retracement or rally within a larger downtrend.
Price Reaches Resistance Zone:
• The price reaches a previous high/resistance area marked by the top of the wedge and completes the fifth wave.
• This is typically where institutional traders may look to take profits or enter short positions.
Risk-Reward Set Up Suggests Short Bias:
• The chart includes a bearish risk-reward trade setup, indicating the trader expects a decline.
• The stop loss is placed slightly above the peak of wave 5, and the take profit is much lower, giving a favorable risk-to-reward ratio in anticipation of a significant move down.
Structure Confluence:
• The top of wave (5) aligns with the trendline resistance from the rising wedge formation, adding technical confluence to the bearish outlook.
⸻
Conclusion
With a completed Elliott Wave count, bearish chart pattern (rising wedge), technical resistance, and a well-defined short setup, the chart strongly suggests that a major top may be in place for EUR/USD, and a downside move is likely to follow.
Bearish ContinuationI am expecting price to continue lower from the newly formed area of supply zone. For now price has already mitigated the EQ of the bullish swing range so this is a medium probability trade setup. When price breaks the structure in HTF trading from the fresh demand zone in support of HTF bullish continuation would be much higher probability than this. But since I am going to use confirmation entry at the area of 1hr supply zone if it is a low probability I might not get the entry.

EURUSD before the NFPEURUSD remains in an uptrend, holding steady around the 1,1800 level.
Today, the U.S. Non-Farm Payroll (NFP) data will be released.
The news is scheduled for 1:30 PM London time and tends to have a significant market impact.
It's advisable to reduce risk on all open positions and avoid rushing into new trades.
Keep an eye on how the price reacts around key levels and whether it has the strength to continue the trend.

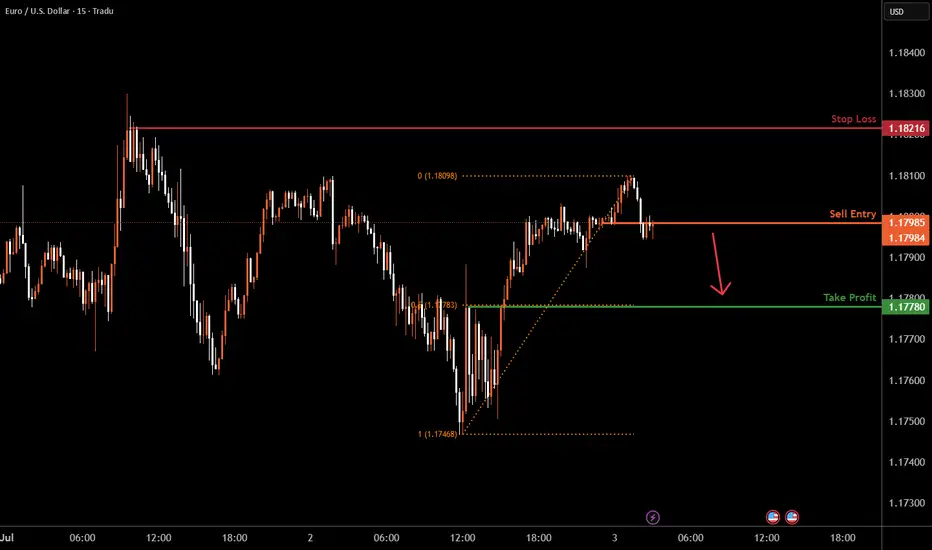
EURUSD M15 I Bearish Fall Based on the M15 chart, the price is testing our sell entry level at1.1798, a pullback resistance.
Our take profit is set at 1.17780 an overlap support that aligns with the 50% Fib retracement.
The stop loss is set at 1.1821, a swing high resistance.
High Risk Investment Warning
Trading Forex/CFDs on margin carries a high level of risk and may not be suitable for all investors. Leverage can work against you.
Stratos Markets Limited (tradu.com ):
CFDs are complex instruments and come with a high risk of losing money rapidly due to leverage. 63% of retail investor accounts lose money when trading CFDs with this provider. You should consider whether you understand how CFDs work and whether you can afford to take the high risk of losing your money.
Stratos Europe Ltd (tradu.com ):
CFDs are complex instruments and come with a high risk of losing money rapidly due to leverage. 63% of retail investor accounts lose money when trading CFDs with this provider. You should consider whether you understand how CFDs work and whether you can afford to take the high risk of losing your money.
Stratos Global LLC (tradu.com ):
Losses can exceed deposits.
Please be advised that the information presented on TradingView is provided to Tradu (‘Company’, ‘we’) by a third-party provider (‘TFA Global Pte Ltd’). Please be reminded that you are solely responsible for the trading decisions on your account. There is a very high degree of risk involved in trading. Any information and/or content is intended entirely for research, educational and informational purposes only and does not constitute investment or consultation advice or investment strategy. The information is not tailored to the investment needs of any specific person and therefore does not involve a consideration of any of the investment objectives, financial situation or needs of any viewer that may receive it. Kindly also note that past performance is not a reliable indicator of future results. Actual results may differ materially from those anticipated in forward-looking or past performance statements. We assume no liability as to the accuracy or completeness of any of the information and/or content provided herein and the Company cannot be held responsible for any omission, mistake nor for any loss or damage including without limitation to any loss of profit which may arise from reliance on any information supplied by TFA Global Pte Ltd.
The speaker(s) is neither an employee, agent nor representative of Tradu and is therefore acting independently. The opinions given are their own, constitute general market commentary, and do not constitute the opinion or advice of Tradu or any form of personal or investment advice. Tradu neither endorses nor guarantees offerings of third-party speakers, nor is Tradu responsible for the content, veracity or opinions of third-party speakers, presenters or participants.