Eurusd sellsPrice has been going up for some time now, looks like a reversal is happening, but anything can happen always adapt! Always wait for extra confirmation
EURUSD_SPT trade ideas
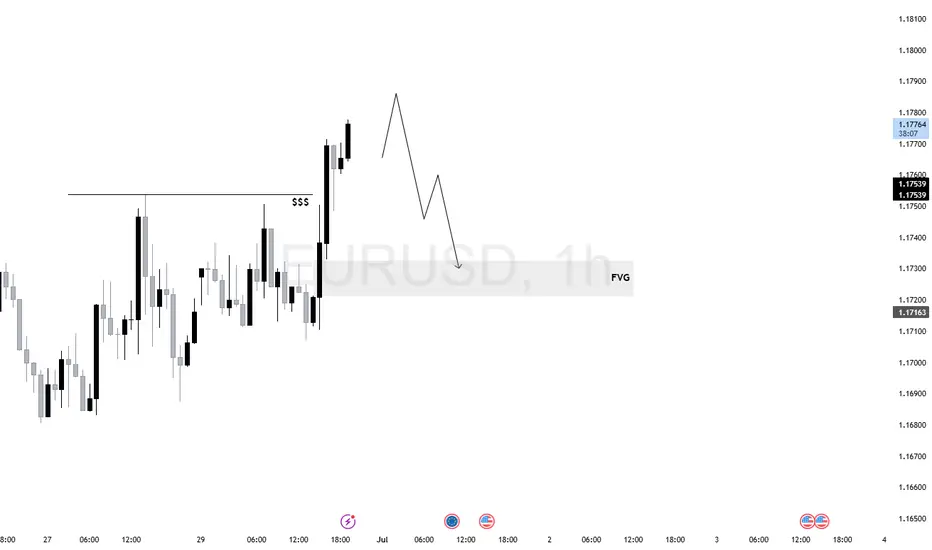
$EU (EURUSD) 1H AnalysisEURUSD swept short-term sell-side liquidity and printed a strong displacement above the relative equal highs.
Price is now in premium territory and likely hunting liquidity before rebalancing.
Bias remains bearish if price fails to form higher-timeframe continuation. Ideal setup would be a short from signs of rejection toward 1.17163 FVG zone.
EUR/USD Fibonacci Support at Prior Resistance BounceEUR/USD has stretched the rally into the opening days of Q3 trade but at this point, the pair is overbought from both daily and weekly charts. On the weekly, RSI is nearing the 75 level and the last time the indicator was that high was back in January of 2018, just ahead of an almost 2,000 pip sell-off that ran for the next year and change.
Overbought doesn't mean automatic reversal, but it does highlight an increasingly heavier load for bulls to carry as the market gets more and more one-sided.
At this point structure on short-term charts remains bullish: The same Fibonacci retracement looked at last week has continued to carve highs and lows so far this week, with today's low showing at last week's high, around the 78.6% retracement of the 2021-2022 major move.
If we do see sellers make a statement move into the end of the week, perhaps provoked by NFP or perhaps just driven by a short squeeze in the USD, then we'd have a weekly wick above that key Fibonacci level on the longer-term EUR/USD chart, and that's something that can start to set the stage for more attractive reversal themes. - js

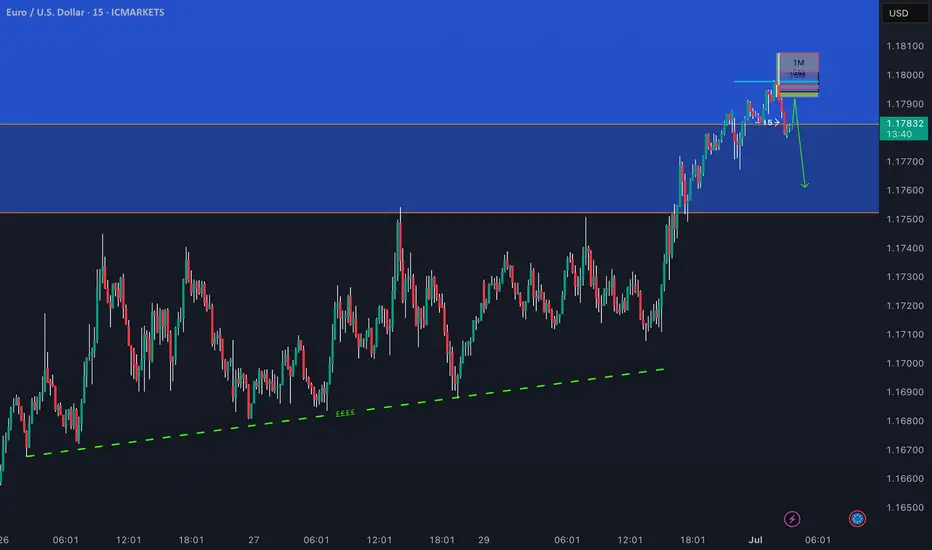
EURUSD: The Market Is Looking Down! Short!
My dear friends,
Today we will analyse EURUSD together☺️
The recent price action suggests a shift in mid-term momentum. A break below the current local range around 1.17808 will confirm the new direction downwards with the target being the next key level of 1.17671.and a reconvened placement of a stop-loss beyond the range.
❤️Sending you lots of Love and Hugs❤️

Ready to Swipe the Pips? | EUR/USD Heist Blueprint Unlocked🏴☠️💸 EUR/USD "Fiber Heist Plan" – Thief Trader Style 💸🏴☠️
The Vault is Open – Swipe the Bullish Bags! 🚀📈💰
🌟Hi! Hola! Ola! Bonjour! Hallo! Marhaba!🌟
Welcome, Money Makers & Market Robbers! 🤑✨
Here’s the latest masterstroke based on our Thief Trading Style™—a tactical breakdown of EUR/USD primed for a bullish breakout robbery. We’re targeting the red zone 🎯—where the weak hands panic, and the real players win.
🔓 Entry Plan (Buy Setup):
🟢 "The vault is wide open!" — We’re planning bullish entries using 15m–30m timeframe swing levels.
✅ Buy Limit Orders: Plot them smartly around most recent swing lows/highs.
⚠️ Chart Alert Suggested: Eyes on the prize, don’t miss the break-in.
🛑 Risk Guard (SL Setup):
💼 Stop-Loss: Set at nearest 30-min swing low (based on your risk appetite).
Remember, it’s about preserving your loot, not just grabbing it.
🎯 Target Area:
🎯 Primary Target: 1.19000
🎯 Optional Trailing SL: Ride the wave, lock the profits as price moves.
🧲 Scalpers' Notice:
Only scalp long. Got big pockets? Jump in. Smaller bags? Swing along.
💡 Trailing stop advised—don’t let the market steal your gains.
💹 Current Market Outlook:
EUR/USD is moving bullish—supported by technical signals, macro news, COT insights, and intermarket vibes.
🧠 Use all tools: Fundamental 📊 + Sentiment 🧭 + Quant + Bias Score 📈.
📎 Want the full breakdown? Check the 👉.Liinkk.🔗
(Keep updated, conditions shift fast!)
⚠️ News Risk Alert:
🚨 Stay alert during news drops—avoid fresh trades then.
Use trailing SLs to lock profits & guard against reversal raids.
💖 Support the Robbery Plan!
💥 Hit that Boost Button 💥 if you're riding with the Thief Team!
We steal smart, we trade sharp — every day’s a new heist in this market.
See you on the next plan! Stay legendary 🐱👤💸🤑🔥

EURUSD M15 I Bearish Reversal Based on the M15 chart, the price is approaching our sell entry level at 1.1788, a pullback resistance that aligns with the 38.2% Fib retracement.
Our take profit is set at 1.1753, a pullback support that aligns closely with the 50% Fib retracement.
The stop loss is set at 1.18080 a swing high resistance.
High Risk Investment Warning
Trading Forex/CFDs on margin carries a high level of risk and may not be suitable for all investors. Leverage can work against you.
Stratos Markets Limited (tradu.com ):
CFDs are complex instruments and come with a high risk of losing money rapidly due to leverage. 63% of retail investor accounts lose money when trading CFDs with this provider. You should consider whether you understand how CFDs work and whether you can afford to take the high risk of losing your money.
Stratos Europe Ltd (tradu.com ):
CFDs are complex instruments and come with a high risk of losing money rapidly due to leverage. 63% of retail investor accounts lose money when trading CFDs with this provider. You should consider whether you understand how CFDs work and whether you can afford to take the high risk of losing your money.
Stratos Global LLC (tradu.com ):
Losses can exceed deposits.
Please be advised that the information presented on TradingView is provided to Tradu (‘Company’, ‘we’) by a third-party provider (‘TFA Global Pte Ltd’). Please be reminded that you are solely responsible for the trading decisions on your account. There is a very high degree of risk involved in trading. Any information and/or content is intended entirely for research, educational and informational purposes only and does not constitute investment or consultation advice or investment strategy. The information is not tailored to the investment needs of any specific person and therefore does not involve a consideration of any of the investment objectives, financial situation or needs of any viewer that may receive it. Kindly also note that past performance is not a reliable indicator of future results. Actual results may differ materially from those anticipated in forward-looking or past performance statements. We assume no liability as to the accuracy or completeness of any of the information and/or content provided herein and the Company cannot be held responsible for any omission, mistake nor for any loss or damage including without limitation to any loss of profit which may arise from reliance on any information supplied by TFA Global Pte Ltd.
The speaker(s) is neither an employee, agent nor representative of Tradu and is therefore acting independently. The opinions given are their own, constitute general market commentary, and do not constitute the opinion or advice of Tradu or any form of personal or investment advice. Tradu neither endorses nor guarantees offerings of third-party speakers, nor is Tradu responsible for the content, veracity or opinions of third-party speakers, presenters or participants.

EURUSD : Up and DownLife’s a ride of highs and lows,
A dance of joy, a tide that flows.
Up we climb with laughter bright,
Down we sink in quiet night.
Mountaintop or valley deep,
Moments swift or slow to creep.
Sunlit days will surely shine,
Storms will pass—just give them time.
Up again, we spread our wings,
Chasing dreams on hopeful strings.
Down once more? That’s alright too—
Every fall makes strength feel new.
So take the highs, embrace the low,
Life’s a rhythm, ebb and flow.
Up and down, we twist, we bend,
But the journey? Worth it, friend.
Good luck.

Hellena | EUR/USD (4H): LONG to the resistance area 1.17300.Colleagues, I believe that the upward five-wave impulse is not over yet. At the moment, I see the formation of wave “3” of the lower order and wave “3” of the middle order, which means that the upward movement will continue at least to the resistance area of 1.17300. This area is located between two levels (1.16529-1.18252) of Fibonacci extension.
A correction is possible — be careful.
Manage your capital correctly and competently! Only enter trades based on reliable patterns!

EURUSD Short, 03 JuneHTF shows clear Bearish OBs on both W and D, with doji & hammer formations hinting at buyer exhaustion. Expecting a pullback into imbalance below.
On LTF, we’ve had a clean BOS in Asia, followed by a retrace into the last 15m extreme OB – an ideal scenario for forming a new lower high in the ongoing bearish trend.
📉 Entry: 1m BOS + reaction from 15m POI
🧩 Confluence: Asia BOS, LTF structure, DXY alignment
🎯 TP: Asia Low (less than 3RR), potential to run further into HTF imbalance
🛡️ Context: All factors align – HTF bias, LTF trend, and precise entry logic.
A textbook continuation play – if we’re going to turn, this is the zone to do it.

EURUSD - Potential buying opportunityLooking at EURUSD
We are still very bullish with no sign of it slowing.
I am aware of a potential weekly liquidity point to the left, however, until EURUSD shows its hand it's important that we still remain bullish.
We have set up a lovely liquidity point before a lovely demand area.
So I will be setting a pending order at the demand area after the New York close and the Asian session begins.

EURUSDOther analysis suggests continued bullish momentum, potentially testing the 1.19-1.20 level in the coming weeks, and possibly even higher towards 1.2227 or 1.2456 if the rally continues strongly

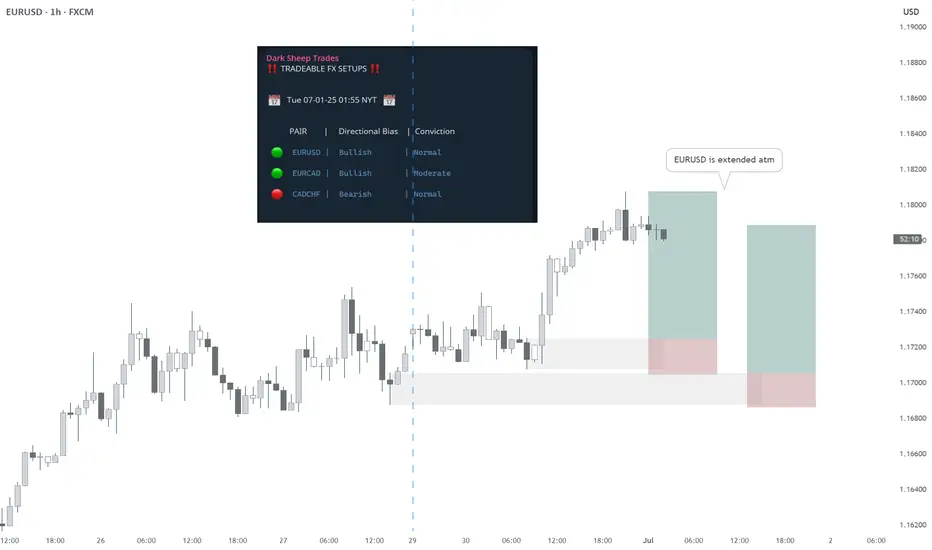
EURUSD BUY - Statistically-backed FX shortlistEURUSD BUY
Daily Outlook: Statistically-backed FX shortlist
@darksheeptrades
EURUSD SELL TRADEOpportunity to sell on EURUSD
Entry: 1.18000
Stop loss: 1.18200
Take profit 📈 1.17400
Comment your opinion
For fund management. Contact me on X @shajudeakinoba1

EUR/USD – Weak Expectations, Neutral German CPI📉 EUR/USD – Weak Expectations, Neutral German CPI, and Bearish Momentum Ahead
Bias: Short / Sell Setup
EUR/USD recently surged toward the 1.0750 zone sooner than expected, driven more by market optimism and speculative flows than solid fundamentals.
Now, that optimism is starting to fade as data fails to back it up.
Meanwhile, the potential U.S. tax reform proposal (Trump) and signs of renewed trade negotiations are helping shift sentiment back toward the U.S. dollar in the coming 10 days.
---
🇩🇪 German CPI – Neutral Print, But Bearish Implications
Today's regional inflation figures across German states were mixed:
States like Saxony and Baden-Württemberg showed slightly rising prices
Others like Bavaria and North Rhine-Westphalia showed declining YoY inflation
Final national CPI due later today is unlikely to beat expectations meaningfully
🎯 Summary: A Neutral CPI Print
No upside surprise → No support for EUR
No major downside → No panic either
---
🧠 Why "Neutral" Data Can Still Be Bearish for EUR
The market was hoping for a strong CPI to signal that ECB may pause rate cuts
Neutral inflation = ECB may still lean dovish
EUR rose on hope — but data offered no confirmation
In financial markets, failed expectations often trigger stronger corrections than bad news.
---
🔍 Technical Overview:
Price approaching strong supply zone near 1.0740 – 1.0760
RSI showing divergence on lower timeframes (H1)
Structure on M15 suggests potential for lower highs
Price stalling under resistance, with no bullish momentum follow-through
---
🎯 Trade Plan:
Bias: Short
Entry Zone: 1.0730 – 1.0755
Stop Loss: Above 1.0775
Take Profit 1: 1.0630
Take Profit 2: 1.0600
Trigger: Break of M15 bearish structure or supply reaction
---
📌 Markets punish over-optimism more than fear.
EUR/USD may correct lower as hopes of a strong CPI fade and macro flows tilt toward the USD.

EUR/USD.4h chart pattern.EUR/USD 4H chart, I can see an ascending trendline with a breakout to the upside, suggesting bullish momentum. You’ve also marked a "TARGET" zone visually on the chart.
Estimated Target:
Based on standard breakout and trend continuation principles:
Current Price: Around 1.1598
Visual Target Zone (as per your chart): Near 1.1700
Potential Target Zone:
1.1700 - 1.1720 (Approximate zone for bullish continuation if breakout holds)
Notes:
✅ Strong bullish structure confirmed by higher highs and trendline support
✅ Breakout already in motion; as long as price stays above the trendline, bullish target remains valid
✅ Watch key support at 1.1535 - 1.1500; price falling below this weakens bullish outlook
Would you like Fibonacci or measured move targets calculated more precisely? Let me know!

After all the news EUR/USD confirmed its time to pullback looking at daily up side leg extansion, almost with no retracments , it has a lot of space to fall down at least to 50% fib level , london gave couple good entry points to the downside. but its friday manage your positions more aggresive , anything could happen today,but we are bearish for the next week

eurusd Sell Time now or 7:00 o clockEURUSD, now its time for new mareket structur shift and entry
because in hightimeframe its market structur ,
1:5 ose 1:3
price market structur shift or keep ob bearish and sell

Eurozone Economy and ECB Policy:Eurozone Economy and ECB Policy: Between Price Stability and Currency Tension
The Eurozone’s latest data points to a relatively stable and controlled macroeconomic environment, with a key milestone just reached:
📊 June inflation hit 2.0%, aligning precisely with the ECB’s long-term target.
Growth remains moderate but positive, and unemployment is stable. From a classical policy perspective, this setup would typically justify further interest rate cuts to stimulate demand and support economic expansion.
But there’s a growing complication:
The euro has strengthened significantly in recent weeks, driven not just by economic fundamentals but also by capital inflows and a weakening U.S. dollar. A stronger euro, while often seen as a sign of investor confidence, can hurt exports, reduce competitiveness, and dampen inflation further — potentially becoming a drag on recovery.
As a result, the ECB finds itself in a policy dilemma:
Cutting rates could stimulate growth, but risk driving the euro even higher.
Slowing down or pausing rate cuts could stabilize the currency, but may stall economic momentum.
---
🔁 Reflexivity at Work
This dynamic highlights George Soros' theory of reflexivity — where market perceptions shape fundamentals, and those fundamentals in turn reshape perceptions.
> “Market prices are always distorted by prevailing biases.”
— George Soros
The current rally in the euro may not reflect fundamentals alone. If the move exceeds investor expectations, it could trigger emotional reactions, abrupt capital shifts, or even corrections — despite a solid economic base.
---
⚠️ Key Takeaways
June inflation at 2.0% gives ECB a clean slate to act — but with caution.
Currency appreciation can delay or distort the impact of monetary easing.
Market reflexivity may accelerate reactions beyond what data alone would justify.
Policy credibility now hinges not just on data, but on timing and communication.
---
In today’s market, price and psychology move together. Stability on paper doesn't always mean stability in execution.

EURUSD - ANALYSIS👀 Observation:
Hello friends! I hope you're doing well. I’d like to share my view on EUR-USD with you.
Looking at the EUR-USD chart, I see two potential scenarios ahead:
🔹 Scenario 1 – Bearish:
If EUR-USD breaks below 1.16836 on the 15-minute time frame, I expect a downward move toward the 1.16319 to 1.15850 area.
🔹 Scenario 2 – Bullish then Bearish:
If the price rises from the current level, I expect an initial move up toward 1.17937, followed by a decline back toward the 1.16319 to 1.15850 zone.
💡 Key Levels to Watch:
📌 Support: 1.16836 / 1.16319 / 1.15850
📌 Resistance: 1.17937
💬 What are your thoughts on EUR-USD? Let me know in the comments below.
Trade safe

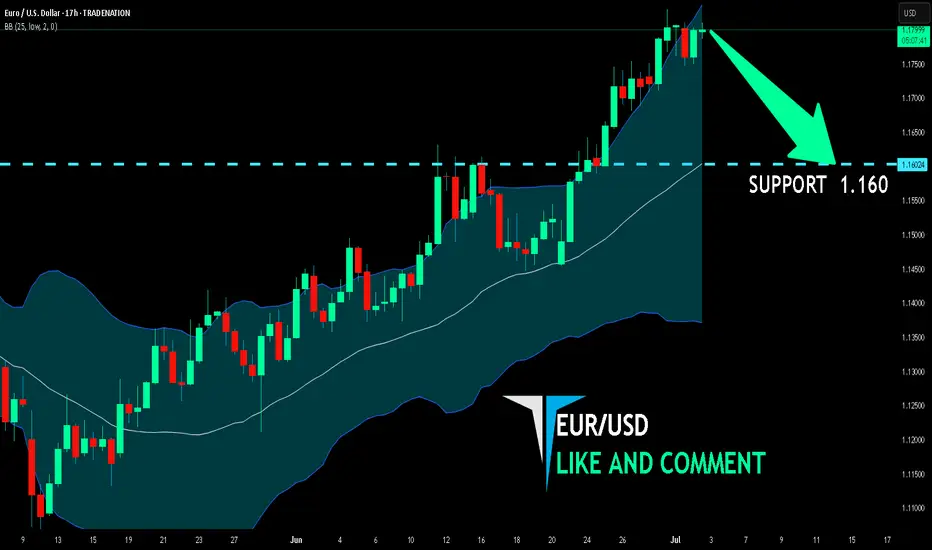
EUR/USD BEST PLACE TO SELL FROM|SHORT
Hello, Friends!
EUR/USD pair is trading in a local downtrend which know by looking at the previous 1W candle which is red. On the 17H timeframe the pair is going up. The pair is overbought because the price is close to the upper band of the BB indicator. So we are looking to sell the pair with the upper BB line acting as resistance. The next target is 1.160 area.
Disclosure: I am part of Trade Nation's Influencer program and receive a monthly fee for using their TradingView charts in my analysis.
✅LIKE AND COMMENT MY IDEAS✅

MASSIVE EURUSD SHORT We could see a breakdown of 30% on the MIL:EURO
There has been too much printing and liquidity is drying up

EURUSD A Fall Expected! SELL!
My dear subscribers,
My technical analysis for EURUSD is below:
The price is coiling around a solid key level - 1.1784
Bias - Bearish
Technical Indicators: Pivot Points High anticipates a potential price reversal.
Super trend shows a clear sell, giving a perfect indicators' convergence.
Goal - 1.1667
My Stop Loss - 1.1853
About Used Indicators:
By the very nature of the supertrend indicator, it offers firm support and resistance levels for traders to enter and exit trades. Additionally, it also provides signals for setting stop losses
Disclosure: I am part of Trade Nation's Influencer program and receive a monthly fee for using their TradingView charts in my analysis.
———————————
WISH YOU ALL LUCK
