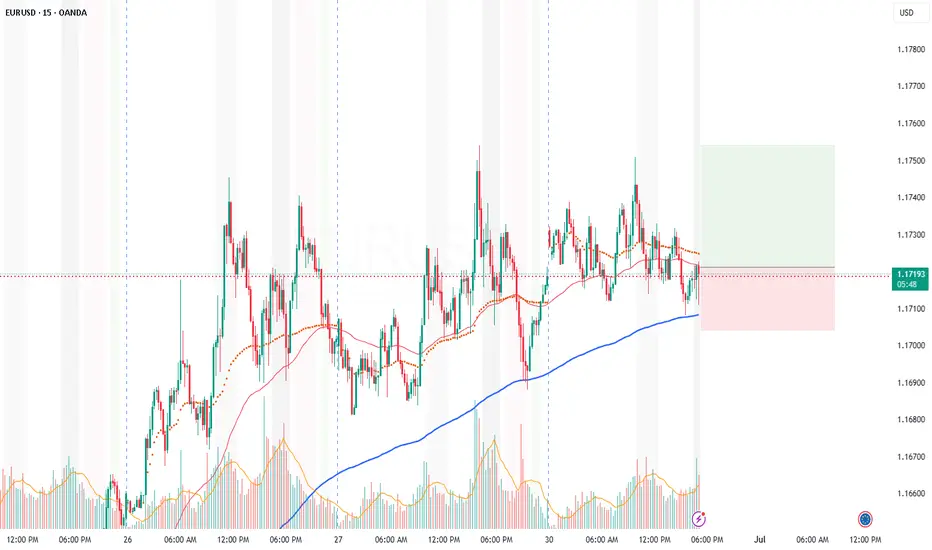
Bearish drop?EUR/USD is rising towards the resistance level which is a pullback resistance that lines up with the 50% Fibonacci retracement and could drop from this level to our take profit.
Entry: 1.1765
Why we like it:
There is a pullback resistance that lines up with the 50% Fibonacci retracement.
Stop loss: 1.1807
Why we like it:
There is a pullback support level.
Take profit: 1.1712
Why we like it:
There is a pullback support level.
Enjoying your TradingView experience? Review us!
Please be advised that the information presented on TradingView is provided to Vantage (‘Vantage Global Limited’, ‘we’) by a third-party provider (‘Everest Fortune Group’). Please be reminded that you are solely responsible for the trading decisions on your account. There is a very high degree of risk involved in trading. Any information and/or content is intended entirely for research, educational and informational purposes only and does not constitute investment or consultation advice or investment strategy. The information is not tailored to the investment needs of any specific person and therefore does not involve a consideration of any of the investment objectives, financial situation or needs of any viewer that may receive it. Kindly also note that past performance is not a reliable indicator of future results. Actual results may differ materially from those anticipated in forward-looking or past performance statements. We assume no liability as to the accuracy or completeness of any of the information and/or content provided herein and the Company cannot be held responsible for any omission, mistake nor for any loss or damage including without limitation to any loss of profit which may arise from reliance on any information supplied by Everest Fortune Group.
EURUSD_SPT trade ideas

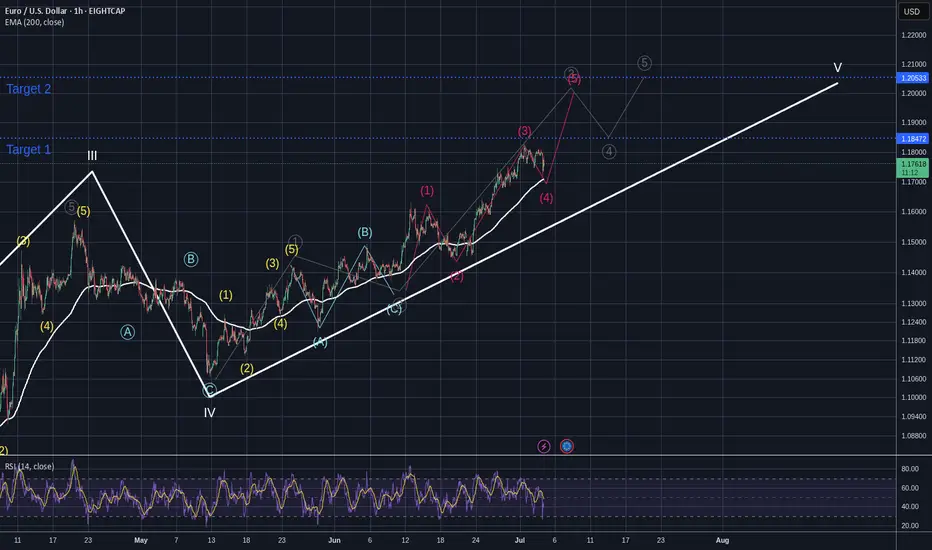
Elliott Wave Analysis: Potential Correction AheadThe overarching 5-wave structure from January 9, 2025, to today is nearing completion. We are currently in Wave 5, with the subordinate Wave 3 in progress. Within this, the sub-subordinate Wave 5 is just starting. Once the overarching Wave 5 concludes, expect a multi-week correction. The correction is projected to target levels between 1.1173 and 1.075.
The Day Ahead Major Economic Data:
US:
ISM Manufacturing (June) and JOLTS job openings (May) – Key for Fed rate cut outlook.
Construction spending and vehicle sales – Insight into economic strength.
Dallas Fed services – Regional business sentiment check.
China:
Caixin Manufacturing PMI (June) – Watch for signs of continued slowdown.
Japan:
Tankan Survey (Q2) – Key business sentiment data; may influence BoJ policy.
Eurozone:
June CPI (inflation) – Crucial for ECB’s rate path.
Germany unemployment, Italy PMI, budget, and car sales – Regional economic health indicators.
Central Bank Highlights:
ECB Sintra Forum Panel:
Features Powell (Fed), Lagarde (ECB), Ueda (BoJ), Bailey (BoE).
Markets will watch for any policy shift signals or divergence in rate outlooks.
Other ECB Speakers:
Guindos, Schnabel, Elderson – may give more hints on inflation and rate moves.
ECB Consumer Survey:
Offers insight into household inflation expectations.
Market View:
US data may push Fed closer to rate cuts if weak.
Eurozone inflation will guide ECB stance.
China’s PMI is a global growth signal.
Central bank talks at Sintra are key for global rate outlook.
Overall:
Markets are on edge awaiting clarity on growth, inflation, and rate paths. Expect possible moves in FX, yields, and equities depending on the data and central bank tone.
This communication is for informational purposes only and should not be viewed as any form of recommendation as to a particular course of action or as investment advice. It is not intended as an offer or solicitation for the purchase or sale of any financial instrument or as an official confirmation of any transaction. Opinions, estimates and assumptions expressed herein are made as of the date of this communication and are subject to change without notice. This communication has been prepared based upon information, including market prices, data and other information, believed to be reliable; however, Trade Nation does not warrant its completeness or accuracy. All market prices and market data contained in or attached to this communication are indicative and subject to change without notice.

German CPI flatlines, eurozone CPI nextThe euro is up for an eighth consecutive day and has gained 2.4% during that time. In the North American session, EUR/USD is trading at 1.1738, up 0.36% on the day.
German inflation data on Monday pointed to a weakening German economy. The CPI report indicated that the deflationary process slowly continues. The inflation rate for June came in at 0% m/m, down from 0.1% in May and below the consensus of 0.2%. Annually, inflation dropped to 2.0% from 2.1% and below the consensus of 2.1%. The eurozone releases its CPI report on Tuesday.
Inflation has been dropping in small increments and has now fallen to the European Central Bank's inflation target of 2%. The ECB cut the deposit rate to 2.0% earlier in June and meets next in July. Although eurozone inflation is largely contained, there are concerns about the impact that US tariffs and counter-tariffs by US trading partners could have on the inflation picture. The ECB is likely to maintain rates in July but could lower rates in September if disinflation continues.
The US continues to show signs that the economy is slowing down. Last week, GDP was revised downwards to -0.5% in the first quarter. This was followed by US consumer spending for May (PCE) which posted a 0.1% decline, following a 0.2% gain in April and shy of the consensus of 0.1%. This was the first contraction since January. If economic data continues to head lower, pressure will increase on the Federal Reserve to lower interest rates, which isn't expected before the September meeting.
EUR/USD is testing resistance at 1.1755. Above, there is resistance at 1.1791
1.1718 and 1.1682 are the next support levels

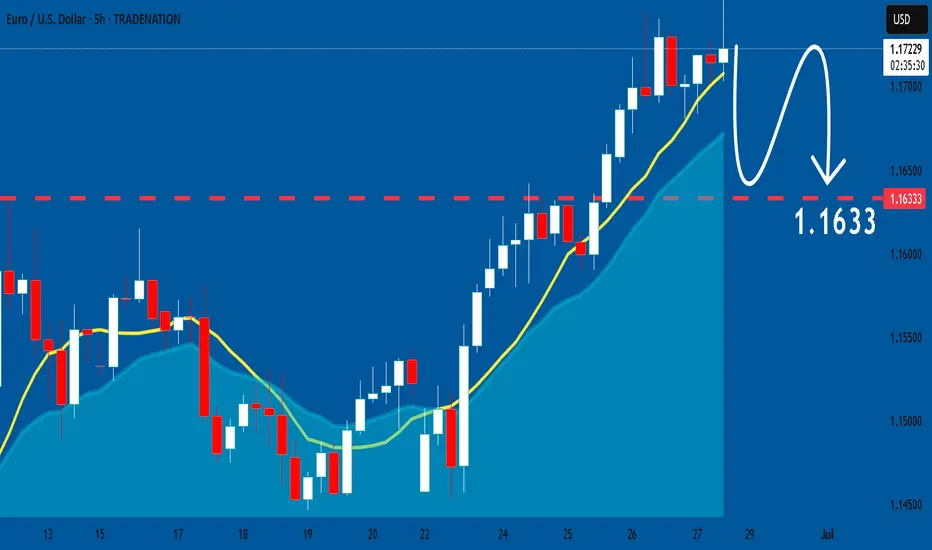
EURUSD: Will Go Down! Short!
My dear friends,
Today we will analyse EURUSD together☺️
The recent price action suggests a shift in mid-term momentum. A break below the current local range around 1.17225 will confirm the new direction downwards with the target being the next key level of 1.17114.and a reconvened placement of a stop-loss beyond the range.
❤️Sending you lots of Love and Hugs❤️

The euro can no longer afford to ignore the support levels aheadI believe the move has already begun, and from this point on especially during the first two days of the week we could see such a formation supported by volume. After climbing for so long, if there’s any intention to break out, I think it should first re enter its original upward channel and at least say hello there. If it’s going to rise further, it should do so from that point. We’ll see together. These are just my personal thoughts and do not constitute financial advice.

EURUSD Bullish Momentum EUR/USD is expected to resume its bullish trend after a brief consolidation. The market is likely to gain bullish momentum from the 1.17007 – 1.17507 support zone, potentially targeting the 1.20285 level in the next upward move

EURUSD Expected Growth! BUY!
My dear followers,
This is my opinion on the EURUSD next move:
The asset is approaching an important pivot point 1.1774
Bias -Bullish
Technical Indicators: Supper Trend generates a clear long signal while Pivot Point HL is currently determining the overall Bullish trend of the market.
Goal - 1.1792
About Used Indicators:
For more efficient signals, super-trend is used in combination with other indicators like Pivot Points.
Disclosure: I am part of Trade Nation's Influencer program and receive a monthly fee for using their TradingView charts in my analysis.
———————————
WISH YOU ALL LUCK

Be careful with EURUSDEURUSD is holding its bullish trend and hovering around 1,1800.
Tomorrow, U.S. employment data is due.
It will be released on Thursday instead of Friday, as Friday is a holiday.
At the current levels, there’s no favorable risk-reward for new entries.
Watch for a pullback and wait for the right moment.

EURUSD ASIA Sells I see this head and shoulders pattern on EURUSD M15 timeframe. Entry should be 1,7955 above so this trade will require some patience. EURUSD is currently on an uptrend so exit the trade soon as tp hits.

EURUSD: Target Is Up! Long!
My dear friends,
Today we will analyse EURUSD together☺️
The recent price action suggests a shift in mid-term momentum. A break above the current local range around 1.18033 will confirm the new direction upwards with the target being the next key level of 1.18161 and a reconvened placement of a stop-loss beyond the range.
❤️Sending you lots of Love and Hugs❤️

ERUSUD: BookMost of us read books on FX trading, hopefully, we can pick up something new, something useful. All the books I had read to date are not useful. I think common sense tells me to forget about them.
But lucky me, I think one book stands out. Written by a nobody. But the method is quite original. His name is Gabriele Fabris. I bet none of you have heard of him or his method.
If I had applied his method to trading EURUSD, the win rate would not be favourable, but his core argument is to make use of time when it matters the most. This provides the basis to understand price movement better. With a bit of research and refinement, it is indeed very useful. Much better than the usual ABCD.
ABCD tells us WHERE and WHEN. It does not tell us the WHY. Which is why when the price reaches the 'D', we can only hope it bounces instead of pushing through.
WHY is the key - I think knowing the intention of the MARKET is crucial - better to let the market reveal itself, then trade along with it. I think the back testing looks good.
Let's see if this method can correctly 'predict' the WHEN, WHERE, and WHY price will pivot this time. It is a long way down.
Good luck.

EURUSD facing resistance at upper channel lineEURUSD facing resistance at upper channel line. It may retrace from here before upward momentum continues.

EURO - Price can continue to decline inside wedge patternHi guys, this is my overview for EURUSD, feel free to check it and write your feedback in comments👊
Some days ago, price tried to grow, but failed and dropped below $1.1220 support level, after which started to grow in channel.
In rising channel, price broke $1.1220 level one more time and then rose to resistance line and then corrected.
Next, Euro rose to $1.1455 level and some time traded inside this level, until it broke it and continued to move up.
Price exited from rising channel and later started to decline inside wedge pattern, where it declined to $1.1455 level.
Recently, price bounced from this level and in a short time rose to resistance line of wedge pattern.
In my mind, Euro can continue to decline to $1.1400 support line of wedge, breaking support level.
If this post is useful to you, you can support me with like/boost and advice in comments❤️
Disclaimer: As part of ThinkMarkets’ Influencer Program, I am sponsored to share and publish their charts in my analysis.

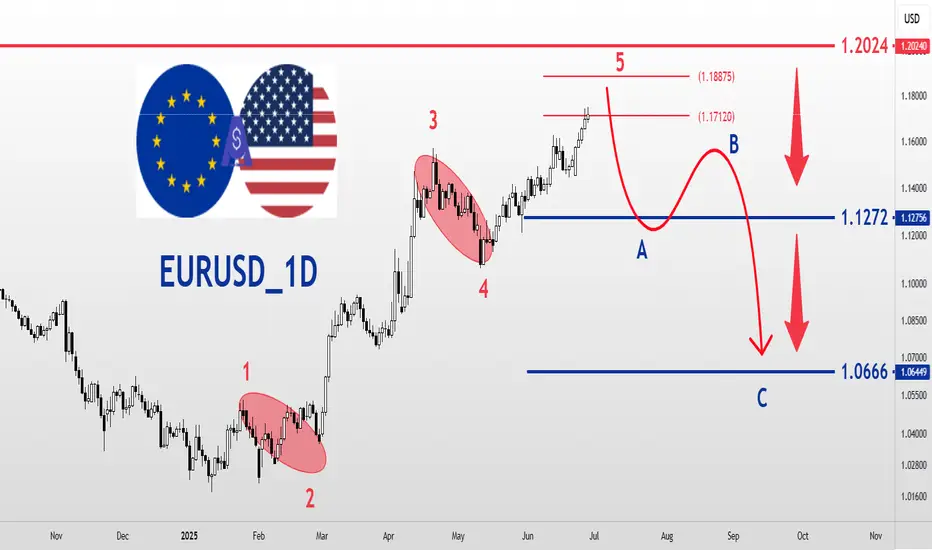
EURUSD_1D_SellEURUSD Analysis Daily Time Frame Medium and Long Term Elliott Wave Analysis Style EUR is at the end of Elliott Wave 5 and is a sell position. Last resistance 1.2024 Downward targets 1.1272 and 1.0666 respectively
#AN015: TRUMP-PUTIN Phone Call and July 4th, Markets Closed
In an unexpected phone call on the sidelines of the American Independence Day, Vladimir Putin and Donald Trump – in the midst of the campaign for his potential re-election – had a confidential conversation that quickly captured the attention of global markets, even on a day when Wall Street was closed.
Hello, I am Trader Andrea Russo and today I want to talk to you about the latest news of these hours. I would like to thank in advance our Official Broker Partner PEPPERSTONE for the support in creating this article.
📉 Wall Street closed, but Forex is always open
While the US stock markets remain closed for the July 4th holiday, the currency market – by its nature decentralized and global – never stops completely. And it is precisely in these moments of low liquidity that geopolitical moves can have an amplified impact.
☎️ What did Putin and Trump say to each other?
Official sources speak of a “cordial discussion” on global security issues, Ukraine, and the future of US-Russia energy relations. However, according to leaks from Moscow, Putin has expressed openness to a new energy negotiation in the event of Trump’s return to the White House.
Translated into Forex language? This could mean:
Lower geopolitical risk on USD in the long term (Trump is seen as more in favor of dialogue with Moscow)
Pressure on Euro if negotiations with Russia are diverted to a Washington-Moscow axis
Temporary strength of RUB in case of glimmers of easing of energy sanctions
📊 Impact on key currency crosses
Comparing the post-news movements on some crosses:
USD/RUB: flat for now, but ready to jump over the weekend if confirmations arrive
EUR/USD: latent weakness, also due to the decline in ISM and the resilience of European inflation
USD/JPY: stable, but with pro-dollar sentiment in the background (Trump is perceived as economically dovish)
⏱️ What to expect in the next 24 hours?
With liquidity recovering already since tonight (Tokyo), markets could start to price in the geopolitical narrative of Trump's return. This scenario favors:
USD slightly stronger in the short term
Watch out for false breakouts on low volatility (typical of July 4th)

Eurusdt tecenical analysis.Eurusdt tecenical analysis next move posibale at h1 time frame.not finacial advice.

Euro Dollar, institutions are still bullish ($1.20 this summer?)There's one constant on the floating exchange market (Forex) this year, the US dollar is by far the weakest currency. It's the same scenario as the first months of Donald Trump's first term in office in 2017 repeating itself. The US President's stated aim is to give US exporters a competitive exchange rate.
The Euro exchange rate is also being supported higher by a combination of fundamental factors, notably a relative catch-up of European assets against US stock market assets. It is the sum of these fundamentals that is enabling a well-constructed uptrend in the EUR/USD rate on FX this year 2025. A new monthly technical close was recorded on the evening of Monday June 30, and with technical resistances breached, it looks as if the euro-dollar rate is on course to reach $1.20 this summer.
1) A new monthly technical close (June technical close) continues to support the euro-dollar's annual uptrend
The June technical close has been in place for the euro-dollar since the start of the week, providing further bullish chart confirmation. The euro-dollar price has confirmed that it has broken through a descending resistance line in place since the 2008 financial crisis. The price is converging with its momentum (represented here by the RSI and LMACD technical indicators) and the next natural technical target lies at $1.20. This is a technical target for the summer, bearing in mind that in the short term, a move back towards support at $1.15 and $1.17 remains possible.
The chart below shows monthly Japanese candlesticks for the EUR/USD rate, with the Ichimoku, RSI and LMACD technical indicators
2) Institutional traders are still bullish on the euro-dollar rate, according to the CFTC's COT report
What's most interesting about the overall analytical approach is the convergence between technical analysis signals and institutional positioning signals on the EUR/USD rate.
According to the CFTC's COT (Commitment Of Traders) report, institutional traders (hedge funds + asset managers) became net buyers of the euro dollar at the start of 2025, and weekly updates of this positioning data show that their buying exposure is increasing as the EUR/USD price rises. This bullish convergence between chartism and institutional investor positioning lends credibility to a scenario that would see the euro dollar reach resistance at $1.20 this summer. This market view would be invalidated if support at $1.14 were broken.
The two charts below show institutional traders' positions on Euro Dollar futures. Institutional traders were predominantly bullish at the start of the year, and month after month, they are increasing their buying exposure.
DISCLAIMER:
This content is intended for individuals who are familiar with financial markets and instruments and is for information purposes only. The presented idea (including market commentary, market data and observations) is not a work product of any research department of Swissquote or its affiliates. This material is intended to highlight market action and does not constitute investment, legal or tax advice. If you are a retail investor or lack experience in trading complex financial products, it is advisable to seek professional advice from licensed advisor before making any financial decisions.
This content is not intended to manipulate the market or encourage any specific financial behavior.
Swissquote makes no representation or warranty as to the quality, completeness, accuracy, comprehensiveness or non-infringement of such content. The views expressed are those of the consultant and are provided for educational purposes only. Any information provided relating to a product or market should not be construed as recommending an investment strategy or transaction. Past performance is not a guarantee of future results.
Swissquote and its employees and representatives shall in no event be held liable for any damages or losses arising directly or indirectly from decisions made on the basis of this content.
The use of any third-party brands or trademarks is for information only and does not imply endorsement by Swissquote, or that the trademark owner has authorised Swissquote to promote its products or services.
Swissquote is the marketing brand for the activities of Swissquote Bank Ltd (Switzerland) regulated by FINMA, Swissquote Capital Markets Limited regulated by CySEC (Cyprus), Swissquote Bank Europe SA (Luxembourg) regulated by the CSSF, Swissquote Ltd (UK) regulated by the FCA, Swissquote Financial Services (Malta) Ltd regulated by the Malta Financial Services Authority, Swissquote MEA Ltd. (UAE) regulated by the Dubai Financial Services Authority, Swissquote Pte Ltd (Singapore) regulated by the Monetary Authority of Singapore, Swissquote Asia Limited (Hong Kong) licensed by the Hong Kong Securities and Futures Commission (SFC) and Swissquote South Africa (Pty) Ltd supervised by the FSCA.
Products and services of Swissquote are only intended for those permitted to receive them under local law.
All investments carry a degree of risk. The risk of loss in trading or holding financial instruments can be substantial. The value of financial instruments, including but not limited to stocks, bonds, cryptocurrencies, and other assets, can fluctuate both upwards and downwards. There is a significant risk of financial loss when buying, selling, holding, staking, or investing in these instruments. SQBE makes no recommendations regarding any specific investment, transaction, or the use of any particular investment strategy.
CFDs are complex instruments and come with a high risk of losing money rapidly due to leverage. The vast majority of retail client accounts suffer capital losses when trading in CFDs. You should consider whether you understand how CFDs work and whether you can afford to take the high risk of losing your money.
Digital Assets are unregulated in most countries and consumer protection rules may not apply. As highly volatile speculative investments, Digital Assets are not suitable for investors without a high-risk tolerance. Make sure you understand each Digital Asset before you trade.
Cryptocurrencies are not considered legal tender in some jurisdictions and are subject to regulatory uncertainties.
The use of Internet-based systems can involve high risks, including, but not limited to, fraud, cyber-attacks, network and communication failures, as well as identity theft and phishing attacks related to crypto-assets.

Lingrid | EURUSD Pullback - Awaiting Trend Continuation SignalFX:EURUSD is consolidating above the upward trendline after forming a triangle within the broader ascending channel. The recent pullback tested the 1.1444 support zone, with a rebound hinting at renewed bullish pressure. A push beyond 1.1620 could unlock upside toward the 1.1700 resistance mark.
📈 Key Levels
Buy zone: 1.1444–1.1470
Sell trigger: breakdown below 1.1444
Target: 1.16200
Buy trigger: breakout above 1.1523 resistance
💡 Risks
Triangle breakdown could shift the short-term bias bearish
Failure to reclaim 1.1620 may stall bullish momentum
A sharp drop below the black trendline would invalidate the structure
If this idea resonates with you or you have your own opinion, traders, hit the comments. I’m excited to read your thoughts!

EURUSD: Will Keep Falling! Here is Why:
Balance of buyers and sellers on the EURUSD pair, that is best felt when all the timeframes are analyzed properly is shifting in favor of the sellers, therefore is it only natural that we go short on the pair.
Disclosure: I am part of Trade Nation's Influencer program and receive a monthly fee for using their TradingView charts in my analysis.
❤️ Please, support our work with like & comment! ❤️
SELL FIBERAfter yesterdays stop out we are at it again, we believe EURUSD bears will step in at current prices. Our sell entry is at 1.17100 our TIGHT stop loss is at 1.17500 and target is as low as 1.14500 . Use proper risk management and always risk what you can afford to loose. Cheers gang

Euro may start to decline to support line of upward channelHello traders, I want share with you my opinion about Euro. Earlier, the price was trading inside a downward wedge, gradually making lower highs and lower lows. After reaching the bottom of the wedge near the buyer zone (1.1210 - 1.1180), we saw a strong bullish impulse that broke through both the resistance line of the wedge and the support area near 1.1450 - 1.1485. This breakout signaled the beginning of a new phase - a transition into an Upward Channel. Since then, the price has been forming higher highs and higher lows, respecting both the upper and lower boundaries of this new structure. Along the way, it has rebounded from the support line multiple times and recently made a strong move up toward the resistance line of the channel. Currently, the price is approaching that resistance line, which may act as a potential reversal area. Given the previous price behavior and the clearly defined channel, I expect the price to reach the top boundary and then start to decline toward the lower support line. That’s why I’ve set my TP 1 at 1.1555 points, which aligns perfectly with the support line of the upward channel. Based on the recent breakout, the structure of the trend, and the reaction from key zones, I remain short-biased for the upcoming sessions. Please share this idea with your friends and click Boost 🚀
Disclaimer: As part of ThinkMarkets’ Influencer Program, I am sponsored to share and publish their charts in my analysis.

EURUSDased on the information from various financial news and analysis sources, EURUSD appears to be on an upward trend. Here's a summary of the key points:
Overall Sentiment:
Many analyses suggest a bullish outlook for EUR/USD, with the pair holding substantial gains and hinting at higher highs.