EURUSD I Monthly CLS I KL -MOB I Model 1Hey, Market Warriors, here is another outlook on this instrument
If you’ve been following me, you already know every setup you see is built around a CLS Footprint, a Key Level, Liquidity and a specific execution model.
If you haven't followed me yet, start now.
My trading system is completely mechanical — designed to remove emotions, opinions, and impulsive decisions. No messy diagonal lines. No random drawings. Just clarity, structure, and execution.
🧩 What is CLS?
CLS is real smart money — the combined power of major investment banks and central banks moving over 6.5 trillion dollars a day. Understanding their operations is key to markets.
✅ Understanding the behavior of CLS allows you to position yourself with the giants during the market manipulations — leading to buying lows and selling highs - cleaner entries, clearer exits, and consistent profits.
📍 Model 1
is right after the manipulation of the CLS candle when CIOD occurs, and we are targeting 50% of the CLS range. H4 CLS ranges supported by HTF go straight to the opposing range.
"Adapt what is useful, reject what is useless, and add what is specifically your own."
— David Perk aka Dave FX Hunter ⚔️
👍 Hit like if you find this analysis helpful, and don't hesitate to comment with your opinions, charts or any questions.
EURUSD_SPT trade ideas

30-06-2025 _ Short Term Bullish Idea _ EURUSD H11- Price is in an uptrend and consolidating at the moment.
2- Potential Bullish Rectangle.
3- Potential Divergence developing on MACD.
4- We can look for a push to the upside towards Daily Resistance Zone.

EURUSDWe are expecting more strength in EURO after small correction towards 1.18 level.
Disclosure: We are part of Trade Nation's Influencer program and receive a monthly fee for using their TradingView charts in our analysis.

#EURUSD:Expecting A Strong Bull Move, Two Entries | Two TargetsIn our previous analysis, we clearly stated that the price would remain bullish as the DXY had to plummet, and it did exactly that, rising by 450 pips from our last entry. Currently, we have two areas from which we can see the price reversing. The first one is nearby and has a higher risk compared to our second entry, which may be safer for some traders. We need a strong confirmation before making any significant decisions.
Good luck and trade safely. We wish you the best in your trading journey.
Team Setupsfx_

EUR/USD - Bullish Bias with Key S/R Level | TCB StrategyEUR/USD - Bullish Bias with Key Support and Resistance Levels | TCB Strategy
Trend:
The overall trend is bullish, with EUR/USD respecting an ascending channel. The market remains in a clear uptrend on higher timeframes, favoring long positions unless resistance is broken.
Key Levels:
Support: 1.1750–1.1770 (bullish bias if price holds here).
Resistance: 1.1800–1.1820 (possible short if price fails to break).
Action Plan:
Long Setup: Look for a bullish reversal pattern near 1.1750–1.1770 (solid support). Targets: 1.1800–1.1820.
Short Setup: If the price fails to break 1.1800–1.1820 and shows a rejection, consider a countertrend short targeting 1.1750.
Breakout Setup: If 1.1820 is broken with momentum, look for a retest and continuation towards 1.1850–1.1900.
Risk Management:
Stop Loss: Below 1.1750 for long trades, above 1.1820 for short trades.
Risk/Reward: Favorable 1:2 or 1:3 R:R ratio based on your setup.
TCB Checklist Score: 83%
Trend Setup: 10/10
Countertrend Setup: 7/10
Breakout Setup: 6/10
Risk Management: 9/10
Target Setting: 8/10
External Factors: 10/10
Overall Score: 50/60 = 83%
Fundamental Backing for EUR/USD Bullish Bias:
ECB vs. Fed Divergence:
The Fed’s hawkish policy may be nearing its peak, while the ECB continues to tighten to combat inflation, favoring the euro over the USD. As the ECB remains more aggressive than the Fed, this could keep EUR/USD supported.
U.S. Economic Data:
If U.S. economic data continues to underperform (e.g., weaker GDP, jobless claims, or inflation reports), it would put downward pressure on the USD, supporting a bullish EUR/USD outlook.
Eurozone Economic Resilience:
The Eurozone has shown solid economic growth despite global challenges, with nations like Germany and France demonstrating resilience. This strengthens the EUR against a potentially weaker USD.
Geopolitical Factors:
While the Russia-Ukraine war is ongoing, the EU’s resilience to the energy crisis and the gradual improvement in global risk sentiment could support the euro in the medium-term.
Global Risk Sentiment:
Risk-on sentiment could benefit higher-yielding assets like the euro, especially against a USD that could face weakening pressures from an economic slowdown.
This setup is solid but requires further confirmation. The bullish trend supports a long bias, but be alert to potential rejections at resistance or breakouts that could push EUR/USD higher.
#EURUSD #TCBStrategy #ForexTrading #Breakout #TrendFollowing #Countertrend #TradingView #ForexAnalysis #RiskManagement #TechnicalAnalysis #ForexSetup #BullishBias #ForexTraders

01.07.2025 #EURUSDSELL 1.17850 | STOP 1.18350 | TAKE 1.17150 | Drawdown corrective price. Channel movement.

Bearish ContinuationI am expecting price to continue lower from the area of supply zone formed after the mitigation of extreme supply zone of the MSS bearish range. This is also and indication that we might see a deeper pullback to the daily of 4hr swing demand zone.
EURUSD may uptrend for a few yearThe breakout on monthly timeframe seem almost fully close.
And that continue happen, EURUSD might have a few year of uptrend.

EUR/USD Daily Timeframe Analysis – Bullish OutlookOn the daily chart, the EUR/USD pair shows a clear bullish bias in the long term, backed by strong upward momentum in recent sessions.
🔹 Price Action Overview:
Last week, EUR/USD printed a strong impulsive move to the upside, indicating increased bullish interest and potential trend continuation. This momentum suggests that the bulls are firmly in control, at least for now.
🔹 What to Expect Next:
With the impulsive leg completed, we are now anticipating a short-term retracement. Price is likely to pull back into a key demand zone, previously acting as resistance, and now potentially flipping into support.
I've marked this retracement zone with a green circle on the chart, aligning with the price range:
📍 Key Trade Levels:
Buy Entry Zone: 1.15900 – 1.16100
(Expecting price to react at this former resistance turned support)
Stop Loss: 1.15400
(Below recent swing low to protect against invalidation)
Take Profit: 1.17300
(Targeting the next significant resistance area)
---
🧠 Trade Idea Summary:
This setup follows the classic "impulse–retracement–continuation" structure. As long as price holds above the retracement zone, we maintain a bullish outlook for EUR/USD.
🔔 Watch for bullish price action (e.g., pin bars, engulfing candles) within the buy zone before entering for confirmation.

EURUSD next week bearishNext week local bearish correction to area 1.16.
If bears broke that area then next target 1.154 and 1.15
But if bulls push price above 1.175 bullish trend continue to 1.18+
SMC Mechanical Entry Models✅ SMC Checklist:
1. Market Structure
🔹 Identify HTF Trend (H4 or H1): bullish, bearish, or range
🔹 Confirm Break of Structure (BOS) or Change of Character (CHoCH) on M15–M5
🔹 Look for lower highs/lows (downtrend) or higher highs/lows (uptrend)
2. Liquidity Zones
🔹 Look for equal highs/lows (liquidity pools)
🔹 Asian highs/lows — common targets during London/NY session
🔹 Recent internal range liquidity
🔹 Trendline liquidity — fakeouts often occur here
3. Premium & Discount Zones (PD Arrays)
🔹 Use Fibonacci from recent swing high to low
🔹 Look for entries at Discount (Longs) or Premium (Shorts) pricing
🔹 Ideal entries happen between 0.62–0.79 retracement
4. Supply & Demand Zones
🔹 Find fresh OBs (Order Blocks) that caused a break of structure
🔹 Use last bullish candle before strong drop (for short) or last bearish candle before strong rally (for long)
🔹 Confirm zone isn’t mitigated yet
5. Imbalance / Fair Value Gaps (FVG)
🔹 Identify large imbalanced candles (no wick overlap)
🔹 Ideal entries are inside the FVG aligned with direction
🔹 High probability if FVG is within OB or confluence with structure/liquidity
6. Confluences for Entry
🔹 Entry aligns with liquidity sweep or FVG/OB tap
🔹 Volume spike or rejection wick confirms interest
🔹 RSI divergence or exhaustion = bonus confirmation
🔹 Use M1/M5 for entry trigger after setup is formed on M15–H1
7. Entry Trigger
🔹 CHoCH or BOS on lower timeframe (M1-M5)
🔹 Confirmation with engulfing candle, FVG fill, or break/retest
🔹 SL below/above recent swing or OB boundary
8. TP/Exit Zones
🔹 TP1: After BOS/structure shift + partial
🔹 TP2: Next liquidity level (equal high/low or OB)
🔹 TP3: Opposite OB or major FVG
🔹 Adjust SL to breakeven after reaching TP1
9. Session Timing (Important)
🔹 Asian range → look for liquidity setup
🔹 London Open (3PM–6PM PH))→ manipulative move (liquidity grab)
🔹 NY Open (8PM–11PM PH) → continuation or reversal opportunity
🔹 Avoid high-impact news releases unless breakout
🔹 Use Forex Factory / MyFXBook for news calendar
10. Post-Trade Journaling:
🔹Screenshot HTF → LTF Setup (H4 > M15 > M1)
🔹Don’t skip journaling — it’s your #1 improvement tool.

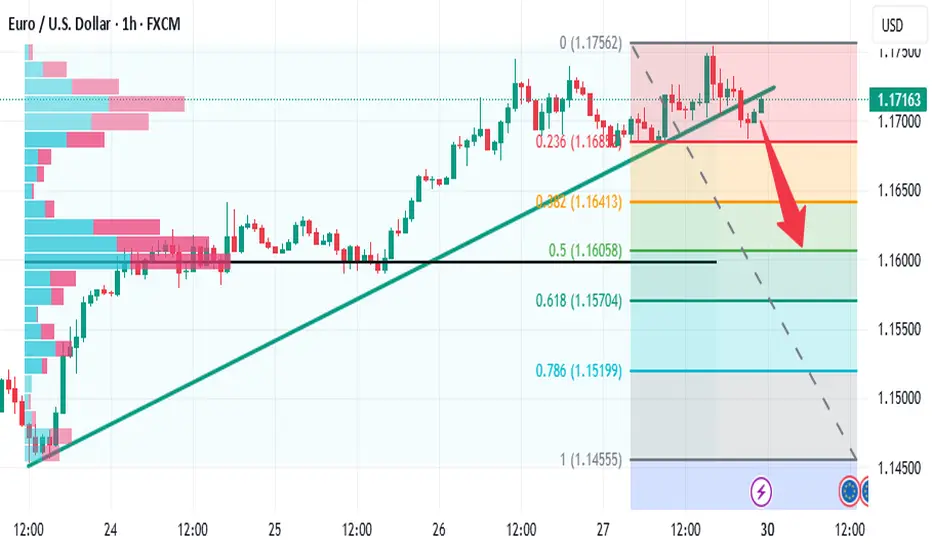
Could the Fiber reverse from here?The price is reacting off the pivot which is a pullback resistance and could drop from this level to the 1st 50% Fibonacci support.
Pivot: 1.1631
1st Support: 1.1552
1st Resistance: 1.1677
Risk Warning:
Trading Forex and CFDs carries a high level of risk to your capital and you should only trade with money you can afford to lose. Trading Forex and CFDs may not be suitable for all investors, so please ensure that you fully understand the risks involved and seek independent advice if necessary.
Disclaimer:
The above opinions given constitute general market commentary, and do not constitute the opinion or advice of IC Markets or any form of personal or investment advice.
Any opinions, news, research, analyses, prices, other information, or links to third-party sites contained on this website are provided on an "as-is" basis, are intended only to be informative, is not an advice nor a recommendation, nor research, or a record of our trading prices, or an offer of, or solicitation for a transaction in any financial instrument and thus should not be treated as such. The information provided does not involve any specific investment objectives, financial situation and needs of any specific person who may receive it. Please be aware, that past performance is not a reliable indicator of future performance and/or results. Past Performance or Forward-looking scenarios based upon the reasonable beliefs of the third-party provider are not a guarantee of future performance. Actual results may differ materially from those anticipated in forward-looking or past performance statements. IC Markets makes no representation or warranty and assumes no liability as to the accuracy or completeness of the information provided, nor any loss arising from any investment based on a recommendation, forecast or any information supplied by any third-party.

MY TCB STRATEGY🔍 Detailed Breakdown
✅ Trend Structure
1H and 4H trends are strongly bullish.
Clean higher highs and higher lows.
Momentum shows clear breakout from range on June 21–24.
🟦 EP1 Zone (1.1600–1.1615) – Minor Pullback
Risk: Price still within supply; not yet a confirmed retracement.
If entry is taken here, price must:
Form a bullish engulfing or low-timeframe FVG at the zone.
Hold above 1.1595 to remain valid.
✅ Good for momentum re-entry.
❗ Risk of getting trapped if deeper retracement (EP2) is needed.
🔲 EP2 Zone (1.1580–1.1600) – Optimal Confluence
Aligns with:
H4 trendline
Breaker block
Prior demand + FVG
If price pulls back here, it offers:
Best RR and lowest risk entry
Ideal setup for Set & Forget
✅ This is the premium zone for longs if price dips.
🎯 Targets
TP1: 1.17250 – Previous high and clean liquidity magnet
TP2: 1.17530 – Next external liquidity (major high)
Both targets are realistic in bullish continuation scenario.
⚖️ Entry Comparison Table
Zone Entry Level Pros Cons R:R Est.
EP1 1.1610 Close to momentum, smaller pullback High risk of rejection/fakeout ~1:2
EP2 1.1585 Trendline + breaker + clean RR May not reach (missed entry risk) ~1:2.8+
🔔 Alerts Recommendation
1.1590: Buy alert for EP2 zone entry
1.1625: Bullish break confirmation
1.1545: Invalidation level (structure break)
🧠 TCBFlow Final Thought:
“EP1 is for aggressive traders. EP2 is for patient execution. The market owes you nothing – it only rewards precision.”
📊 Final Score
Setup Score %
EP1 7/10 70% ⚠️ Medium Confidence (Requires confirmation)
EP2 9/10 90% ✅ High Confidence (Best TCB zone)
🧠 Summary:
EP1 is early, momentum-based — only enter if you see strong bullish PA.
SET and FORGET
EP2 is clean, structured, and high-confluence — best suited for Set & Forget with minimum emotional interference.

EURUSD Long, 02 JulyAsia Fill Trade
Despite being inside a Daily Bearish OB, this trade is purely an Asia fill setup, so HTF bias is not heavily weighted here.
We had clear 1m BOS and retrace into the 1m OB, right inside a 15m Decisional POI, backed by inverted hammer rejections on both EU and DXY.
📉 Entry: 1m OB after BOS
📊 Confluence: DXY reacting from 15m POI + Asia
🎯 TP: Asia Low (1:3 RR)
🛡️ BE: 1.5RR or LTF BOS continuation
Clean execution based on intraday logic & structure, with correlation as additional confidence.

EUR/USD Long Setup — Breakout Retest Play
We’re seeing a classic breakout-retest scenario on EUR/USD. After breaking above the previous consolidation zone, price has pulled back to retest the broken structure near 1.1495, which also aligns with a higher time frame support zone.
🟦 Entry Zone: 1.1495–1.1490
🔴 Stop Loss: Below 1.1420 (clearly outside the structure)
🟩 Targets (Partial TPs):
1.1655
1.1775
1.1888–1.1894 (final)
📌 Plan:
This is a trend continuation idea after a clean structural breakout. If you plan to enter this, consider:
✅ Scaling in at or near current price
✅ Partial TP at each resistance level
❌ Avoid holding full position till final target — secure profits along the way
✅ Use proper risk management and size
⚠️ Important Note
This is not a signal, just an idea.
I am not selling signals or subscriptions.
If you're new, you may think:
“Let me just follow someone with 100K followers and I’ll profit.”
Truth is — follower count means nothing. Many signal sellers don’t even trade. They sell subscriptions, not setups.
🧠 Pro Tip for Beginners
Track 30–40 trade ideas from different users (including old ones — they often hide losers). Ask yourself:
Was the direction right?
Was the entry filled?
Was the setup realistic?
That’s how you’ll grow as a trader.
Trade smart, protect your capital, and stay sharp.
Rendon1


EURUSD daily closed with strong bullishDaily candle shows buyer in control.
I'm expecting retracement today towards 1.1707~1.1733 before another bullish movement.
Good Luck.
do your own risk & reward calculation

EURUSD WEEKLY HIGHER TIME FRAME FORECAST Q3 W27 Y25EURUSD WEEKLY HIGHER TIME FRAME FORECAST Q3 W27 Y25
Professional Risk Managers👋
Welcome back to another FRGNT chart update📈
Diving into some Forex setups using predominantly higher time frame order blocks alongside confirmation breaks of structure.
Let’s see what price action is telling us today! 👀
💡Here are some trade confluences📝
✅Weekly Order block identified
✅Daily Order block identified
✅4H Order Block identified
🔑 Remember, to participate in trading comes always with a degree of risk, therefore as professional risk managers it remains vital that we stick to our risk management plan as well as our trading strategies.
📈The rest, we leave to the balance of probabilities.
💡Fail to plan. Plan to fail.
🏆It has always been that simple.
❤️Good luck with your trading journey, I shall see you at the very top.
🎯Trade consistent, FRGNT X

EURUSDEUR/USD Bias: Bullish
(Market is positioned for euro strength vs. dollar weakness, so EUR/USD likely to move higher)
Speculators are confident in euro strength, and mildly bearish on the dollar — giving EUR/USD a clear upward bias.

EURUSD D1 & H4 (Wave Analysis) Update 3/7/2025EURUSD D1 & H4 (Wave Analysis) Update 3/7/2025
See the Chart

CHECK EURUSD SIGNAL READ CAPTAINeurusd ) sell zone
( trade satup)
entry point (1.17600) to (1.17500) 📊
first tp (1.17200 )📊
2nd target (1.16350) last target (1.16350) 📊
stop loss (1.18000)

Downtrend It is expected that after some fluctuation in the current resistance range, a trend change will take place and we will see the beginning of a downtrend. A break of the green support range will be a confirmation of the downtrend. With a break and consolidation above the resistance range, the alternative scenario will be a continuation of the uptrend.

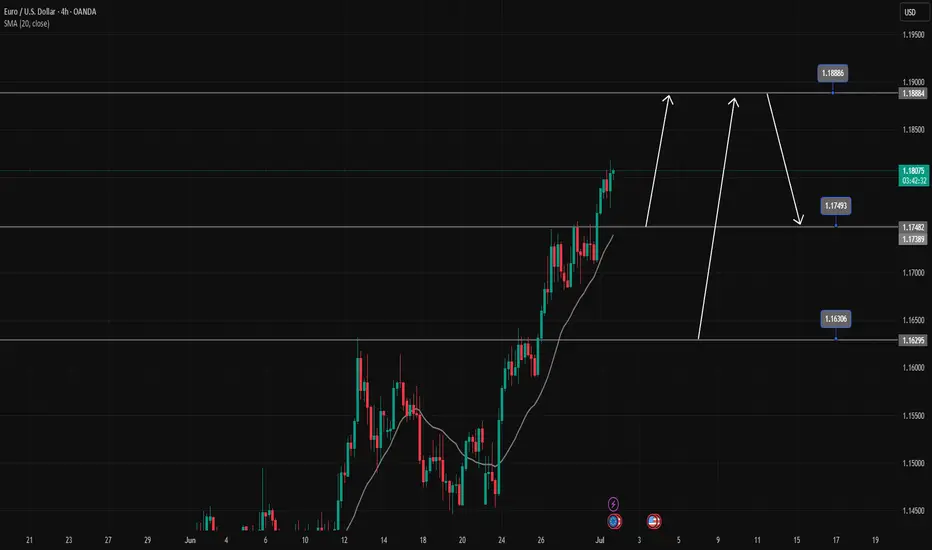
EURUSD is in a strong uptrendEURUSD is in a strong uptrend, Price just broke the resistance zone of 1.175.
All the bullish momentum is heading towards the resistance zone of 1.188.
If there is a close of the h4 candle below the resistance zone of 1.175, there will likely be a Pullback to 1.163 to find more buying momentum towards the target at the resistance zone of 1.188
📈 Key Levels
Support: 1.175-1.163
Resistance: 1.188
📊 Recommended Trade Setups
BUY EURUSD 1.175-1.173 Stoploss 1.170
BUY EURUSD 1.163-1.161 Stoploss 1.158
SELL EURUSD 1.188-1.190 Stoploss 1.1930