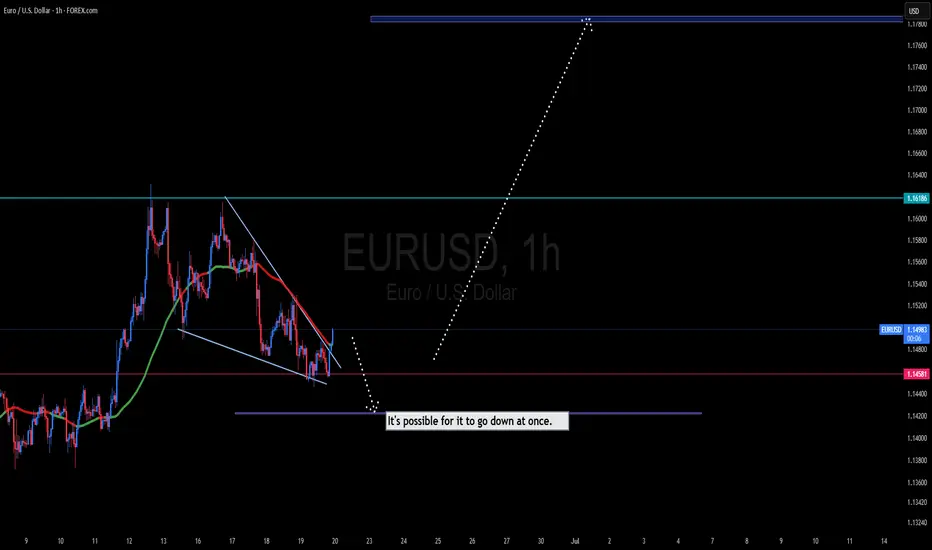
FVG (Fair Value Gap) or Imbalance Zones (grey boxes):Key Zones & Markings:
SSL (Sell Side Liquidity) - "True return to support" (bottom horizontal line around 1.13700):
Indicates that price has swept the sell-side liquidity, grabbing stop-losses below previous lows.
This often precedes a reversal if it aligns with a key support zone.
FVG (Fair Value Gap) or Imbalance Zones (grey boxes):
Price is expected to retrace back into these imbalanced zones.
These zones act as magnet areas where price might rebalance before further continuation.
Target Zone (Top Horizontal Line at ~1.16200):
Marked as the bullish target, likely aligning with buy-side liquidity (BSL) or unfilled imbalances.
Potential take profit area for long entries from the support zone.
📈 Market Structure:
Price made a lower low, swept liquidity (SSL), and is now showing potential bullish intent.
Anticipated move:
Reversal from support
A clean bullish move toward FVGs
Final target near 1.16200
🎯 Strategy Idea:
Long Entry Zone: Near 1.137–1.140 (liquidity sweep + support).
Target: 1.15500 (intermediate) and 1.16200 (final).
SL (Stop Loss): Could be below the most recent low (if re-entry needed).
🧠 Concept Used:
Liquidity sweep (SSL)
Return to support
Fair Value Gap (FVG) fill
Smart Money long setup
EURUSD_TOM trade ideas

EURUSD – A Potentially Busy Day Ahead For TradersThis morning, EURUSD recorded a near 4 year high at 1.1807, the beneficiary of improving risk sentiment, uncertainty about the ECB’s next interest rate move, and concerns about what President Trump’s tax cut bill, that is progressing through the Senate currently, could mean for the sustainability of the US debt burden moving forward.
Now, with the FX quarter end rebalancing completed yesterday, it is possible to look forward to the upcoming scheduled events for today that could influence where EURUSD moves next.
First up, at 1000 BST this morning, traders receive the latest preliminary inflation (HICP) update for the Eurozone. The outcome of this release could provide further insight into whether the current market expectation for one more ECB rate cut in 2025 is possible, or if they may be on hold for the foreseeable future.
Next up, starting at 1430 BST is a panel discussion attended by ECB President Lagarde, Fed Chairman Powell, BoE Governor Bailey and BoJ Governor Ueda at the ECB’s Central Bank Forum in Portugal. The topic, “adapting to change: macroeconomic shifts and policy responses”. The comments of these central bank heads on inflation, interest rates, tariffs and economic growth could be important for the direction of all the major G7 FX pairs.
Then, at 1500 BST the ISM Manufacturing PMI survey is due for release. While US manufacturing activity is still expected to languish in contraction territory, below 50, traders will be focused on whether there has been any improvement in the headline print, and what the prices paid component could indicate for the direction of US inflation across the remainder of 2025.
These events, when taken with real time updates from President Trump and members of this administration on his tax bill, trade deals and flexibility of the July 9th tariff deadline, sets today up as a potentially volatile period for EURUSD trading.
Technical Update: Assessing the Recent Trend
From a technical perspective, a positive pattern of higher highs and higher lows remains in the EURUSD price and as the chart below shows, Tuesday has seen another new recovery high posted at 1.1807.
While much will continue to depend on market sentiment and price trends, it might be argued that the posting of this new price high for the current upside move, suggests a further phase of strength is still possible.
However, what are the levels traders may now be watching to gauge where the next directional price risks might lay over coming sessions?
Potential Support Levels:
Since posting the June 19th session low at 1.1446, EURUSD has rallied by over 3.00% (1.1446 to 1.1807) and while this doesn’t mean price weakness is necessarily on the cards, traders might become concerned a price correction is due after such a strong advance.
As the chart above shows, the 38.2% Fibonacci retracement of latest price strength, currently stands at 1.1668. This can mark a potential first support focus, after the recent move higher.
Closing breaks under 1.1668, while not a guarantee of further price declines, may then lead to a deeper phase of weakness towards 1.1583, which is equal to the 61.8% retracement level.
Potential Resistance Levels:
As a result of latest strength, EURUSD has traded to levels last seen in mid-September 2021 and to gauge the next potential resistance levels, we switch to the longer term weekly chart shown below.
If further price strength still emerges from current levels, traders may now be focused on 1.1909, the August 2021 failure high, as the next possible resistance level.
The material provided here has not been prepared accordance with legal requirements designed to promote the independence of investment research and as such is considered to be a marketing communication. Whilst it is not subject to any prohibition on dealing ahead of the dissemination of investment research, we will not seek to take any advantage before providing it to our clients.
Pepperstone doesn’t represent that the material provided here is accurate, current or complete, and therefore shouldn’t be relied upon as such. The information, whether from a third party or not, isn’t to be considered as a recommendation; or an offer to buy or sell; or the solicitation of an offer to buy or sell any security, financial product or instrument; or to participate in any particular trading strategy. It does not take into account readers’ financial situation or investment objectives. We advise any readers of this content to seek their own advice. Without the approval of Pepperstone, reproduction or redistribution of this information isn’t permitted.

EURUSD: Target Is Up! Long!
My dear friends,
Today we will analyse EURUSD together☺️
The recent price action suggests a shift in mid-term momentum. A break above the current local range around 1.18033 will confirm the new direction upwards with the target being the next key level of 1.18161 and a reconvened placement of a stop-loss beyond the range.
❤️Sending you lots of Love and Hugs❤️

Ready to Swipe the Pips? | EUR/USD Heist Blueprint Unlocked🏴☠️💸 EUR/USD "Fiber Heist Plan" – Thief Trader Style 💸🏴☠️
The Vault is Open – Swipe the Bullish Bags! 🚀📈💰
🌟Hi! Hola! Ola! Bonjour! Hallo! Marhaba!🌟
Welcome, Money Makers & Market Robbers! 🤑✨
Here’s the latest masterstroke based on our Thief Trading Style™—a tactical breakdown of EUR/USD primed for a bullish breakout robbery. We’re targeting the red zone 🎯—where the weak hands panic, and the real players win.
🔓 Entry Plan (Buy Setup):
🟢 "The vault is wide open!" — We’re planning bullish entries using 15m–30m timeframe swing levels.
✅ Buy Limit Orders: Plot them smartly around most recent swing lows/highs.
⚠️ Chart Alert Suggested: Eyes on the prize, don’t miss the break-in.
🛑 Risk Guard (SL Setup):
💼 Stop-Loss: Set at nearest 30-min swing low (based on your risk appetite).
Remember, it’s about preserving your loot, not just grabbing it.
🎯 Target Area:
🎯 Primary Target: 1.19000
🎯 Optional Trailing SL: Ride the wave, lock the profits as price moves.
🧲 Scalpers' Notice:
Only scalp long. Got big pockets? Jump in. Smaller bags? Swing along.
💡 Trailing stop advised—don’t let the market steal your gains.
💹 Current Market Outlook:
EUR/USD is moving bullish—supported by technical signals, macro news, COT insights, and intermarket vibes.
🧠 Use all tools: Fundamental 📊 + Sentiment 🧭 + Quant + Bias Score 📈.
📎 Want the full breakdown? Check the 👉.Liinkk.🔗
(Keep updated, conditions shift fast!)
⚠️ News Risk Alert:
🚨 Stay alert during news drops—avoid fresh trades then.
Use trailing SLs to lock profits & guard against reversal raids.
💖 Support the Robbery Plan!
💥 Hit that Boost Button 💥 if you're riding with the Thief Team!
We steal smart, we trade sharp — every day’s a new heist in this market.
See you on the next plan! Stay legendary 🐱👤💸🤑🔥

German CPI flatlines, eurozone CPI nextThe euro is up for an eighth consecutive day and has gained 2.4% during that time. In the North American session, EUR/USD is trading at 1.1738, up 0.36% on the day.
German inflation data on Monday pointed to a weakening German economy. The CPI report indicated that the deflationary process slowly continues. The inflation rate for June came in at 0% m/m, down from 0.1% in May and below the consensus of 0.2%. Annually, inflation dropped to 2.0% from 2.1% and below the consensus of 2.1%. The eurozone releases its CPI report on Tuesday.
Inflation has been dropping in small increments and has now fallen to the European Central Bank's inflation target of 2%. The ECB cut the deposit rate to 2.0% earlier in June and meets next in July. Although eurozone inflation is largely contained, there are concerns about the impact that US tariffs and counter-tariffs by US trading partners could have on the inflation picture. The ECB is likely to maintain rates in July but could lower rates in September if disinflation continues.
The US continues to show signs that the economy is slowing down. Last week, GDP was revised downwards to -0.5% in the first quarter. This was followed by US consumer spending for May (PCE) which posted a 0.1% decline, following a 0.2% gain in April and shy of the consensus of 0.1%. This was the first contraction since January. If economic data continues to head lower, pressure will increase on the Federal Reserve to lower interest rates, which isn't expected before the September meeting.
EUR/USD is testing resistance at 1.1755. Above, there is resistance at 1.1791
1.1718 and 1.1682 are the next support levels

MASSIVE EURUSD SHORT We could see a breakdown of 30% on the MIL:EURO
There has been too much printing and liquidity is drying up

ERUSUD: BookMost of us read books on FX trading, hopefully, we can pick up something new, something useful. All the books I had read to date are not useful. I think common sense tells me to forget about them.
But lucky me, I think one book stands out. Written by a nobody. But the method is quite original. His name is Gabriele Fabris. I bet none of you have heard of him or his method.
If I had applied his method to trading EURUSD, the win rate would not be favourable, but his core argument is to make use of time when it matters the most. This provides the basis to understand price movement better. With a bit of research and refinement, it is indeed very useful. Much better than the usual ABCD.
ABCD tells us WHERE and WHEN. It does not tell us the WHY. Which is why when the price reaches the 'D', we can only hope it bounces instead of pushing through.
WHY is the key - I think knowing the intention of the MARKET is crucial - better to let the market reveal itself, then trade along with it. I think the back testing looks good.
Let's see if this method can correctly 'predict' the WHEN, WHERE, and WHY price will pivot this time. It is a long way down.
Good luck.

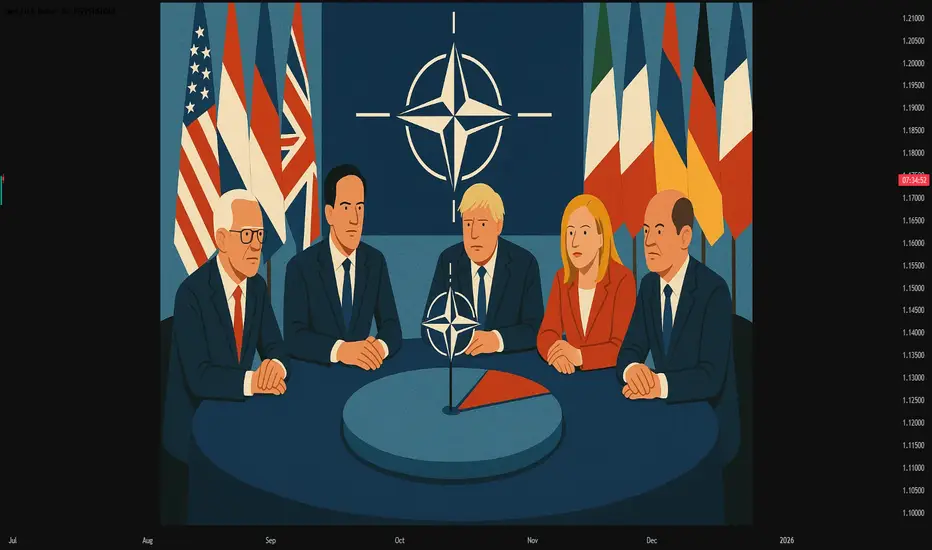
#AN011: NATO Summit, 5% for Defense
Hello, I am Forex Trader Andrea Russo and after the NATO Summit meeting, I want to analyze the situation a bit. Remember that my opinions are strictly personal and what I say may not reflect your thoughts. I do not write with a political or personal ideology. I analyze the situation objectively.
I thank in advance our Official Partner Broker PEPPERSTONE for the support in creating this article.
🔍 Key points of the NATO Summit
Yesterday's NATO Summit in The Hague attracted global attention, with the 32 member countries committing to a strong increase in defense spending, with the goal of 5% of GDP by 2035, of which 3.5% for basic military spending and 1.5% for broader security measures, such as strengthening cybersecurity and infrastructure.
US President Trump praised the outcome as a "major victory" and stressed that increased spending would likely benefit US defense contractors, while reaffirming NATO's commitment to Article 5.
However, countries such as Spain have expressed concern, indicating that it could include military aid rather than pure budget increases.
📈 Financial Market Reaction
🔹 Defense & Aerospace Stocks
Major defense companies across Europe posted immediate gains:
Babcock (UK) +10.7%,
Rheinmetall (Germany) +3.1%,
Thales (France) +2%+,
Leonardo (Italy) +2.6%
🔹 Bond & Currency Action
According to KBC Bank market commentary:
The bond market steepened bearishly, particularly in Europe, as governments are reassessing their fiscal balances to accommodate defense budgets.
The US dollar remained strong, supported by dovish Fed expectations, countering the spike in bond yields.
🌍 Currency Market Implications
EUR/USD:
The momentum of a dovish Fed and US fiscal pressure could support the dollar. However, divergence in bond yields could support moderate euro strength if the ECB remains cautious.
EUR-linked currencies (e.g. SEK, NOK):
These could come under pressure from rising risk premia and possible increase in government bond issuance.
JPY and CHF:
Likely to benefit from high volatility and safe-haven flows amid geopolitical tensions.
🧭 Strategic Outlook
Theme Market Impact
Increased defense spending Supports government bonds, increases government bond yields.
Fiscal tightening Increases credit risk premia.
US defense dominance Strengthens the USD in the short to medium term.
Geopolitical unity Strengthens investor confidence, mitigates risk-off tendencies.
📝 Conclusion
NATO summit signals a geopolitical shift that extends to currency and credit markets. Forex traders should pay attention to:
Yield changes in the US versus Europe due to increased deficit financing.
Currency inflows into the US dollar on defense and risk themes.
Safe-haven demand if tensions in Russia-Ukraine or the Middle East flare up again.
Thanks a lot for making it this far. Stay tuned for more analysis.
Trading a Significant Divergence on EURUSDI saw a huge bearish divergence in EURUSD as the price moving up without backed up by volume. And also its MACD showing lower high vs the price making a higher high.
I am selling EURUSD for correction or trend reversal, both are possible from this level.

EURUSDShorting EUR/USD means you expect the euro to weaken against the U.S. dollar. In other words, you believe the dollar will gain strength or the euro will lose value — or both.
Reasons traders might short EUR/USD:
• The U.S. economy is performing better than the eurozone.
• Interest rates are rising faster in the U.S. than in Europe.
• Political or economic instability in the eurozone.
• Investors seeking safety in the dollar during global uncertainty.

Eurusd 1Hr chart Analaysis EUR/USD is currently in a bullish trend and is expected to reach the 1.17801 – 1.18010 range. A bearish retracement is likely to occur around those levels.
Note: Ongoing tensions in the Middle East could have a significant impact on the market.

EUR/USD at resistanceAs you can see this trend line on the weekly goes back quite a ways, it was supported by and now has become resistance. Unless it closes above on the weekly timeframe, this area is a good short zone

EURUSD: Bears Are Winning! Short!
My dear friends,
Today we will analyse EURUSD together☺️
The in-trend continuation seems likely as the current long-term trend appears to be strong, and price is holding below a key level of 1.16242 So a bearish continuation seems plausible, targeting the next low. We should enter on confirmation, and place a stop-loss beyond the recent swing level.
❤️Sending you lots of Love and Hugs❤️

Bullish rise?The Fiber (EUR/USD) has broken out of the pivot and could rise to the 1st resistance.
Pivot: 1.1569
1st Support: 1.1530
1st Resistance: 1.1631
Risk Warning:
Trading Forex and CFDs carries a high level of risk to your capital and you should only trade with money you can afford to lose. Trading Forex and CFDs may not be suitable for all investors, so please ensure that you fully understand the risks involved and seek independent advice if necessary.
Disclaimer:
The above opinions given constitute general market commentary, and do not constitute the opinion or advice of IC Markets or any form of personal or investment advice.
Any opinions, news, research, analyses, prices, other information, or links to third-party sites contained on this website are provided on an "as-is" basis, are intended only to be informative, is not an advice nor a recommendation, nor research, or a record of our trading prices, or an offer of, or solicitation for a transaction in any financial instrument and thus should not be treated as such. The information provided does not involve any specific investment objectives, financial situation and needs of any specific person who may receive it. Please be aware, that past performance is not a reliable indicator of future performance and/or results. Past Performance or Forward-looking scenarios based upon the reasonable beliefs of the third-party provider are not a guarantee of future performance. Actual results may differ materially from those anticipated in forward-looking or past performance statements. IC Markets makes no representation or warranty and assumes no liability as to the accuracy or completeness of the information provided, nor any loss arising from any investment based on a recommendation, forecast or any information supplied by any third-party.

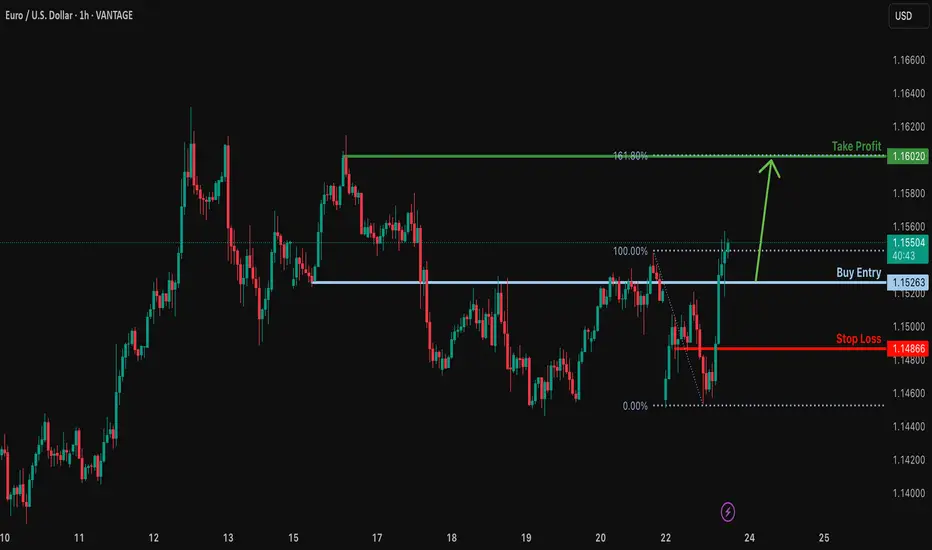
Bullish rise?EUR/USD is falling towards the support level which is an overlap support and could bounce from this level too ur take profit.
Entry: 1.1526
Why we like it:
There is an overlap support level.
Stop loss: 1.1486
Why we like it:
There is a pullback support level.
Take profit: 1.1602
Why we like it:
There is a pullback resistance level that aligns with the 161.8% Fibonacci extension.
Enjoying your TradingView experience? Review us!
Please be advised that the information presented on TradingView is provided to Vantage (‘Vantage Global Limited’, ‘we’) by a third-party provider (‘Everest Fortune Group’). Please be reminded that you are solely responsible for the trading decisions on your account. There is a very high degree of risk involved in trading. Any information and/or content is intended entirely for research, educational and informational purposes only and does not constitute investment or consultation advice or investment strategy. The information is not tailored to the investment needs of any specific person and therefore does not involve a consideration of any of the investment objectives, financial situation or needs of any viewer that may receive it. Kindly also note that past performance is not a reliable indicator of future results. Actual results may differ materially from those anticipated in forward-looking or past performance statements. We assume no liability as to the accuracy or completeness of any of the information and/or content provided herein and the Company cannot be held responsible for any omission, mistake nor for any loss or damage including without limitation to any loss of profit which may arise from reliance on any information supplied by Everest Fortune Group.
EUR/USD tests 20 EMA, Lower band of channelEUR/USD ran into resistance at 1.1630 before easing back below 1.15. However, EUR/USD continues to trade in its rising channel, holding above its 20 and 50 SMA for now. The RSI is pointing lower, suggesting momentum is losing steam.
Immediate support is at 1.1450, the 20 SMA, and the lower band of the rising channel is being tested following weak EZ PMIs and as the USD is the safe-haven of choice amid Middle East tensions. A break below here could open the door to 1.14 and 1.1280.
Buyers will look to rise back above 1.15 and 1.1580 to bring 1.1630 and fresh multi-year highs into focus.
FC

23.06.25 Morning ForecastPairs on Watch -
FX:EURAUD
FX:EURNZD
FX:EURUSD
A short overview of the instruments I am looking at for today, multi-timeframe analysis down to what I will be looking at for an entry. Enjoy!

EURUSD: the PCE on scheduleThe FOMC meeting was the main event watched closely by investors during the previous week. The Fed left rates unchanged, as was widely expected, but still counted on two 25bps cuts till the end of this year. The main information was related to the effects of implemented trade tariffs by the US Administration, for which the Fed expects to be reflected on the economy in the coming period. Inflation is the main concern in this sense, however, it could be only a one-off effect. The Fed continues to be data-driven when it comes to their decision.
As for other macro data posted during the previous week, the Retail Sales in May dropped by -0,9% for the month, which was higher from expected -0,7%. The Industrial Production in May also dropped by -0,2% on a monthly basis, bringing the indicator to the level of 0,6% compared to the previous year. Both figures were lower from market estimates. The Building Permits preliminary in May reached 1.393M, lower from forecasted 1,43M. At the same time Housing Starts in May reached the number of 1.256M, again lower from estimated 1,36M.
The ZEW Economic Sentiment Index in June for Germany was standing at the level of 47,5, higher from market estimate of 35. The same index for the Euro Zone was at the level of 35,3, again higher from forecasted 23,5. The Inflation Rate final in May for the Euro Zone was at the level of 0% for the month and 1,9% on a yearly basis, and without changes from the previous post. The Producers Price Index in Germany in May dropped by -0,2% for the month and -1,2% for the year.
As Middle East tensions have already been priced by markets, the previous week's focus was on the Fed. The market reaction on the news was not stronger as all known facts were already priced in. The eurusd was moving in a range between 1,1613 and 1,1448 during the week. The currency pair is closing the week at the level of 1,1523. The RSI is moving closer to the overbought market side, ending the week at the level of 59. The MA50 continues to diverge from MA200, without an indication of a forthcoming potential cross.
For the week ahead, charts are pointing toward both directions, with equal probabilities. On one side, there is a potential that the currency pair will most likely test the 1,16 level for one more time, but charts are not pointing toward the potential for higher grounds, at this moment. On the opposite side, there is probability that the 1,1450 will be tested for one more time, but the targeting levels will most probably be between 1,1420 and 1,1380. In every case, fundamentals to be watched in a week ahead are the May PCE data on Friday and Fed Chair Powell`s testimony in front of the Congress on Tuesday and Wednesday. These two events might bring higher volatility in case that new information emerges, which was up to now unknown to markets.
Important news to watch during the week ahead are:
EUR: HCOB Manufacturing PMI flash for June in Germany and the Euro Zone, Ifo Business Climate in June in Germany, GfK Consumer Confidence in July for Germany,
USD: S&P Global Composite PMI flash for June, Existing Home Sales in June, Fed Chair Powell testimony in front of the Congress on Tuesday, June 24th, Durable Goods Orders in May, GDP Growth Rate q/q final for Q1, PCE Price Index in May will be posted on Friday, June 27th.

Bearish reversal?EUR/USD is rising towards the resistance level which is a pullback resistance that lines up with the 61.8% Fibonacci retracement and could reverse from this level to our take profit.
Entry: 1.1555
Why we like it:
There is a pullback resistance that lines up with the 61.8% Fibonacci retracement.
Stop loss: 1.1608
Why we like it:
There is a pullback resistance.
Take profit: 1.1483
Why we like it:
There is a pullback support level that aligns with the 61.8% Fibonacci retracement.
Enjoying your TradingView experience? Review us!
Please be advised that the information presented on TradingView is provided to Vantage (‘Vantage Global Limited’, ‘we’) by a third-party provider (‘Everest Fortune Group’). Please be reminded that you are solely responsible for the trading decisions on your account. There is a very high degree of risk involved in trading. Any information and/or content is intended entirely for research, educational and informational purposes only and does not constitute investment or consultation advice or investment strategy. The information is not tailored to the investment needs of any specific person and therefore does not involve a consideration of any of the investment objectives, financial situation or needs of any viewer that may receive it. Kindly also note that past performance is not a reliable indicator of future results. Actual results may differ materially from those anticipated in forward-looking or past performance statements. We assume no liability as to the accuracy or completeness of any of the information and/or content provided herein and the Company cannot be held responsible for any omission, mistake nor for any loss or damage including without limitation to any loss of profit which may arise from reliance on any information supplied by Everest Fortune Group.

AI Algo Systems vs. Manual Trading: Which Delivers Real Results?AI Algo Systems vs. Manual Trading: Which Delivers Real Results? ⚖️
________________________________________
Introduction
With the explosive rise of artificial intelligence (AI) in financial markets, traders everywhere are asking the million-dollar question:
Should I trust my trades to automation, or keep my hands on the wheel? 🧠🤖
This guide offers a real-world, side-by-side comparison between AI-powered algorithmic trading systems and traditional manual trading. We’ll highlight where each method dominates, when they fail, and how you can combine both to build a system that outperforms the rest. 💡
What Are AI Algo Systems? 🤖
AI trading systems use advanced machine learning models to:
• Analyze huge volumes of historical and real-time data 📈
• Detect patterns and trading opportunities faster than any human
• Automatically execute trades using coded logic, without emotion
🔬 Real-World Examples:
• Neural networks (LSTM, CNN): Predicting EUR/USD direction based on years of tick data
• Reinforcement learning agents: Managing position sizing dynamically in crypto scalping
• Predictive classifiers: Spotting likely trend reversals on S&P 500 based on 20+ indicators
Key Benefits:
• 🔄 Emotionless execution: No fear, no greed, just rules
• ⏱️ Lightning-fast trades: React to price action instantly
• 📊 Pattern recognition: Finds subtle correlations people miss
________________________________________
What Is Manual Trading? 👤
Manual trading is powered by human intelligence and judgment. Traders use:
• Price action and SMC/ICT techniques (e.g., order blocks, BOS)
• Fundamental analysis: News, sentiment, macro reports
• Intuition and experience: Reading between the lines the way only humans can
🧑💼 Real-World Examples:
• A trader spots an untested order block on GBP/JPY and waits for liquidity sweep before entering
• Reading a dovish tone in FOMC minutes and fading the initial spike on DXY
• Using “market structure shifts” after a big news event to catch a reversal
Key Benefits:
• 🔍 Contextual awareness: Understand the full market story
• 🎯 Real-time adaptability: Adjust plans on the fly
• 🧠 Creative edge: Find setups no algorithm can code for
________________________________________
Side-by-Side Comparison Table 📋
Feature AI Algo Trading 🤖 Manual Trading 👤
Execution Speed Instant Slower, can lag
Emotions Involved None Prone to fear/greed
Adaptability Limited (needs retrain) High
Learning Curve High (coding/tech) Medium (market logic)
Strategy Flexibility Pre-coded only Unlimited creativity
Backtesting Automated Manual/semi-auto
Session Monitoring 24/5 via server Human-limited hours
________________________________________
When AI Algo Systems Work Best 💾
AI is unbeatable when you need:
• Scalability: Watching 10, 20, or even 100+ pairs 24/5
• High-frequency execution: Entering/exiting trades within milliseconds
• Repetitive strategies: Like mean reversion, breakout scalps, or arbitrage
📈 Example:
• Strategy: EUR/USD London open breakout
• Process: AI model detects volume and volatility spike, enters trade with 0.3% risk, targets FVG
• Results: 60% win rate, 1.8R average reward over 3 months
________________________________________
When Manual Trading Wins 🧠
Manual skills shine when you need:
• Discretionary entries: Especially with complex SMC/ICT structures
• Adapting to breaking news: Sudden CPI, FOMC shocks, geopolitical headlines
• Making sense of market narrative: When volatility is off the charts and AI gets confused
🗞️ Example:
• News: Surprise ECB rate hike
• Setup: Price sweeps liquidity and forms new order block
• Action: Trader enters based on confluence of structure, sentiment, and news
• Why AI fails: Model trained on normal volatility might get stopped out or miss entry entirely
________________________________________
Hybrid Strategy: The Best of Both Worlds 🌐
Elite traders combine the power of AI with human oversight.
Hybrid Workflow:
1. AI scans markets: Flags setups (order blocks, FVGs, volume spikes)
2. You review: Confirm bias with news, sentiment, or higher time frame
3. Entry:
o Manual (you pull the trigger)
o Semi-automated (AI suggests, you approve)
🔁 You save time, avoid missing setups, but keep critical discretion and control.
________________________________________
Risk Management: Algo vs. Manual 📊
AI:
• Stops, lot size, SL/TP are auto-calculated
• Consistent, never emotional
• Example: EA manages all USD pairs with 0.5% fixed risk per trade
Manual:
• Trader might override risk plan
• Discipline needed—easy to “revenge trade” after a loss
• Example: You up your risk size after a losing streak, breaking your rules
Best Practice:
📌 Let AI calculate risk size. Manually approve or override the entry. Double safety net.
________________________________________
Trader Case Study 👤
Name: Ray – $100K funded prop trader
Style: Hybrid (AI scanner + manual ICT confirmations)
Process:
• Sets HTF bias each morning
• AI scans for OB/BOS setups during NY session
• Manual review before entry
Performance:
• Win rate: 63%
• Avg R: 2.5
• Monthly gain: 9.7%
Ray’s Words:
“AI catches what I can’t see. I catch what it can’t understand.”
________________________________________
Mistakes to Avoid ❌
• 🚫 Blindly trusting black-box AI: Always verify signals
• 🚫 Micromanaging every tick: Let automation work, don’t over-interfere
• 🚫 Running AI during high-impact news: Most bots aren’t built for chaos
• 🚫 Ignoring psychology: Even if AI executes, your mindset impacts risk and management
________________________________________
Conclusion ✅
There’s no one-size-fits-all answer. The best traders in 2025 master both worlds. Here’s the winning formula:
• Harness AI’s speed and pattern recognition
• Lean on manual judgment for narrative and nuance
• Blend them with intention and structure for a trading system that’s fast, flexible, and resilient.
💥 Don’t pick sides. Master both.
That’s how the top 1% trade today—and win. 🚀⚙️📊

EURUSDased on the information from various financial news and analysis sources, EURUSD appears to be on an upward trend. Here's a summary of the key points:
Overall Sentiment:
Many analyses suggest a bullish outlook for EUR/USD, with the pair holding substantial gains and hinting at higher highs.
EURUSD Sell SetupBy: MJTrading:
EUR/USD has rallied into a significant resistance zone, approaching the upper boundary of a rising wedge/channel pattern. The price is now hovering around a key confluence zone, where trendline resistance and horizontal supply intersect ( 1.16300 —1.16500 )
There are to possible scenarios:
1) If the price Rejects directly from previous High
🔹 Position 1: Sell Stop @ 1.15915
🛑 Stop Loss: 1.6375
🎯 Take Profit: 1.5454
R/R:1
isk Level: Medium
2) If price tries to reach the boundary of the wedge or make a Fake breakout:
🔹🔹 Position 2: Sell Limit @ 1.16300
🛑 Stop Loss: 1.6930
🎯 Take Profit: 1.5000
R/R:2
Risk Level: Low
📌 This zone offers a high-probability reversal setup
📉 Why it Matters:
Price action shows signs of exhaustion after a parabolic move.
EMA structure is stretched, hinting at a potential pullback.
Lets ZOOM OUT:
Daily Chart:
ZOOM IN:
Stay disciplined, let price come to you, and manage risk.
—
#EURUSD #ForexSetup #TradingStrategy #TechnicalAnalysis #ChartPattern #FXTrading #ShortTrade #MJTrading #BearishReversal #PriceAction #SwingTrade #ForexIdeas #Trendlines #BreakoutOrFakeout #RiskReward
