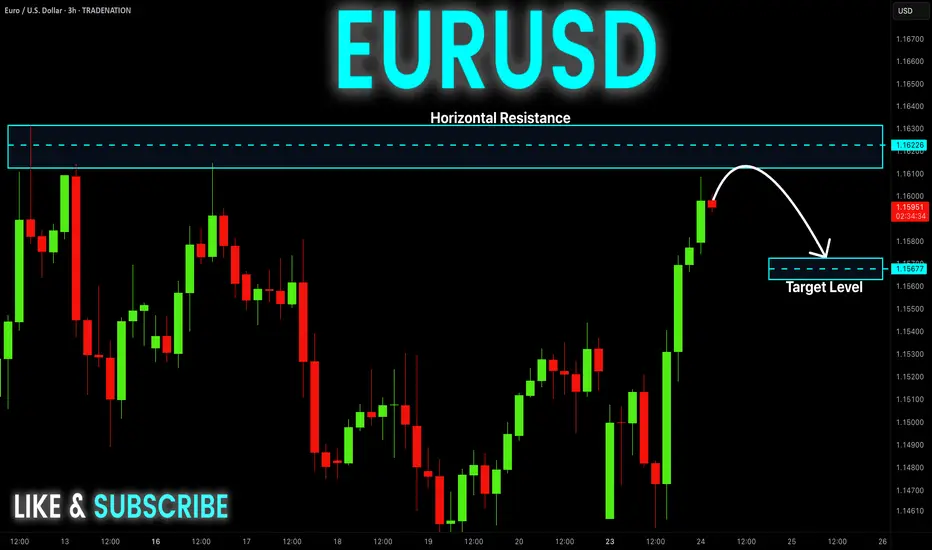
EUR-USD Risky Short! Sell!
Hello,Traders!
EUR-USD made a nice bullish
Move up and has almost reached
A horizontal resistance level
Of 1.1631 and the pair is locally
Overbought so after the retest
A local bearish correction
Is to be expected
Sell!
Comment and subscribe to help us grow!
Check out other forecasts below too!
Disclosure: I am part of Trade Nation's Influencer program and receive a monthly fee for using their TradingView charts in my analysis.
EURUSD_TOM trade ideas
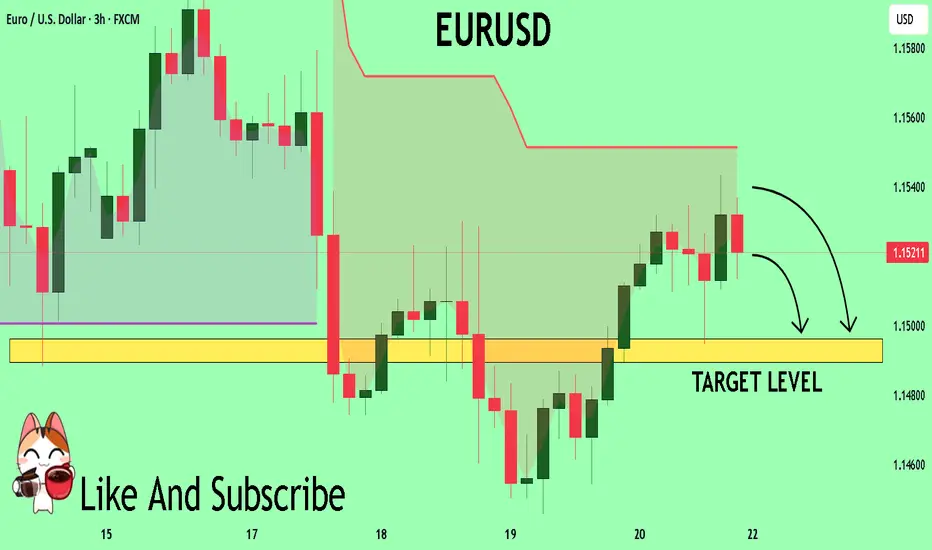
EURUSD Set To Fall! SELL!
My dear subscribers,
My technical analysis for EURUSD is below:
The price is coiling around a solid key level - 1.1521
Bias - Bearish
Technical Indicators: Pivot Points Low anticipates a potential price reversal.
Super trend shows a clear sell, giving a perfect indicators' convergence.
Goal - 1.1496
About Used Indicators:
By the very nature of the supertrend indicator, it offers firm support and resistance levels for traders to enter and exit trades. Additionally, it also provides signals for setting stop losses
Disclosure: I am part of Trade Nation's Influencer program and receive a monthly fee for using their TradingView charts in my analysis.
———————————
WISH YOU ALL LUCK
eurusd short and then long idea short idea price should come to support zone and retest then it can go high maybe . but for now its a good time to catch up the short

EURUSD A Fall Expected! SELL!
My dear friends,
Please, find my technical outlook for EURUSD below:
The price is coiling around a solid key level - 1.1609
Bias - Bearish
Technical Indicators: Pivot Points Low anticipates a potential price reversal.
Super trend shows a clear sell, giving a perfect indicators' convergence.
Goal - 1.1532
About Used Indicators:
The pivot point itself is simply the average of the high, low and closing prices from the previous trading day.
Disclosure: I am part of Trade Nation's Influencer program and receive a monthly fee for using their TradingView charts in my analysis.
———————————
WISH YOU ALL LUCK

EURUSD ShortLive Analysis – EURUSD
Market Structure: Price has tapped into the Daily Market Structure zone.
Price Action: Current structure and price action suggest a potential reversal is in play.
Strategy: This is a Structure-to-Structure trade setup.
Targets:
Lower liquidity pools beneath current price
Main Target: Weekly structured liquidity resting at the dotted line
EURUSD entering the Bear Zone ...Have an eye on the Orange Circle for a possible short position...
Stay tuned for the comprehensive analysis in next IDEA...
Thank you for your attention and support...
#EURUSD #MJTRADING #FOREX

EURUSD Trade Plan: Retracement Into Key Fibo Zone POI.I’m currently watching EURUSD closely 👀. On the daily timeframe, it’s clearly broken structure and is now in a bullish trend 📈. Dropping down to the lower timeframes 🕒, price appears overextended and is now trading into a previous resistance level 🚧.
I’m anticipating a retracement into equilibrium — specifically the 50% level of the current swing, and ideally into the 50–61.8% Fibonacci retracement zone 🔁. If price pulls back into that range, I’ll be watching for a bullish market structure shift 🔄. I don’t want to see it push below the bullish imbalance 📉—I want that zone to hold as support so price can continue north 🔼.
If this plays out, my ideal entry would be around the imbalance and the 50% Fib level, with a stop loss just below the imbalance, and targets set at the current swing high and previous swing high, as detailed in the video 🎯.
⚠️ Disclaimer
This is not financial advice. Trading involves risk and you should only trade with capital you can afford to lose. Please do your own analysis or consult a licensed financial advisor.

EUR/USDScenario 1: Bullish Reversal (If current FVG support holds)
Bias: Short-term bullish, looking for a continuation of the bounce.
Rationale: The price responded positively to an earlier low and is completing an FVG at this juncture. If this FVG is supported and the price breaks out above the latest bullish order block, then a reversal may be signaled.
Entry: Wait for a clear break and test back to the current high range or a demonstrated bullish candle pattern in the FVG area being filled. An entry might be at about 1.1520-1.1530 should confirmation be observed.
Target: The following big resistance level, which could be the liquidity pool ($S) at 1.1540, and thereafter, at 1.1580-1.1600, the
Stop-Loss: Below recent low or an important support level, i.e., below 1.1500 or current Bullish OB.
Scenario 2: Continuing Bearish Pressure (In case current FVG gets filled and it fails to hold)
Bias: Short-term bearish, expecting to see a continuation of the downtrend after the FVG is filled.
Rationale: If it extends this ongoing FVG and then shows signs towards rejection (e.g., bearish candlestick patterns, failure to break through resistances), it could be signaling continuation in the prior downtrend.
Entry: Look for bearish confirmation after the FVG fills, which would be a break down through the newest low or low side of the current range. Potential entry would be at 1.1500-1.1510 on a confirmed break down.
Target: The "Bullish OB" around 1.1440-1.1450, and potentially the lower FVG around 1.1400.
Stop-Loss: At or higher than the newest swing top or key level of resistance, e.g. 1.1530-1.1540
Relevant Factors:
Risk Management: You should always use appropriate position sizing and use a stop-loss to manage your risk.
Confirmation: Hold out for firm price action confirmation before entering any trade.
News Events: Be aware of any scheduled economic news releases or events that could impact EUR/USD, potentially creating huge volatility.
Bigger Timeframes: Always consider the bigger picture context (i.e., day, week) in order to obtain a general trend.

EURUSDHello, I hope you have a good day ❤
Please don't forget to support us so that our activities can continue!🚀
The trend of the above times is completely upward and this move is not far from expected.
But since it is the first week of the new month, be sure to observe capital management.
Be profitable💲💎

SNATCH & RUN: EUR/USD Long Setup (High-Risk Loot Zone)🔥 EUR/USD Heist: Bullish Loot Before the Trap! (Thief Trading Strategy) 🔥
🌟 Hi! Hola! Ola! Bonjour! Hallo! Marhaba! 🌟
Attention, Money Makers & Market Robbers! 🤑💰💸✈️
Based on the 🔥Thief Trading Style🔥, here’s our master plan to loot the EUR/USD "The Fiber" Forex Market! Follow the strategy on the chart—Long Entry is key. We’re targeting the high-risk Red Zone: overbought, consolidating, and primed for a reversal. Beware the trap—bulls must strike fast before bears ambush! 🏆💸
"Take the profit and treat yourself, trader. You deserve this heist!" 💪🎉
🚪 Entry Point (The Vault is Open!)
📈 "Swipe the bullish loot at any price—the heist is LIVE!"
Pro Tip: Use Buy Limit orders within a 15-30 min timeframe (recent swing low/high). ALERTS ARE A MUST!
🛑 Stop Loss (Escape Route)
Thief SL at nearest swing low (1.12500) on the 3H timeframe (Day/Swing trade).
Adjust based on your risk, lot size, and multiple orders.
🎯 Target (Loot & Scoot!)
🎯 1.17200 (or escape earlier if the cops show up!)
⚡ Scalpers’ Quick Grab
👀 Only scalp LONG!
Big wallets? Raid straight in.
Small stacks? Join swing traders for the robbery.
Use Trailing SL to protect your stolen cash! 💰
📢 Why This Heist? (EUR/USD Bullish Momentum)
"The Fiber" is heating up! Key drivers:
Fundamentals (COT Reports, Macro Data)
Sentiment & Intermarket Trends
Future Targets & Score Outlook
🔗 Want the full intel? Check our bio0 for linkks! 👉👉
⚠️ Trading Alert: News = Danger! 📰🚨
News releases = volatility spikes! Protect your loot:
❌ Avoid new trades during news.
🔒 Use Trailing SL to lock profits.
💖 Support the Heist Crew!
💥 Smash the Boost Button! 💥
More boosts = easier money steals!
Strengthen our robbery squad!
Every day is a heist—profit with Thief Trading Style! 🏆🚀
Stay tuned for the next robbery plan! 🤑🐱👤🤩

EURUSD Midweek Outlook | 3H - 15M Dual ViewLeft side chart shows the 3H Bird’s Eye structure — price swept the recent highs but failed to follow through, signaling external bull weakness. That shift in narrative tells me price may be prepping to drop, potentially targeting the SSL below before gathering fuel to attack major highs.
Right side zooms in on the 15M — I’m patiently watching for a clean lower high to break (CHoCH) followed by a pullback to confirm a sell entry. Until I get that proper LTF trigger, I stay on the sidelines. Execution always follows alignment.
Bias: Short
HTF Structure: 3H sweep of highs, showing weakness
LTF View: Waiting for 15M confirmation (break + retest)
Target: SSL below
Mindset Note: Trade what’s shown, not what’s felt. Stay sharp, stay patient.
Bless Trading!

EURUSD Short Part IIEURUSD Analysis
On EURUSD daily chart from CMC Markets quota, indicates a bullish trend with a symmetrical triangle pattern forming. The price has recently broken above a key resistance level, suggesting potential for continued upward movement.
Key Price Levels
Current Price: 1.16932
Stop Loss (SL): 1.16549
Take Profit 1 (TP1): 1.12003
Take Profit 2 (TP2): 1.09318
Trend Analysis
EURUSD shows clear signs on an ascending trend supported by higher lows and higher highs since early 2025. Both orange trend-lines which I created form a symmetrical triangle, with the price nearing the apex, hinting at a potential breakout or reversal which I have been looking for a reversal bearish breakout.
The upward momentum is strong, but the proximity to the upper trend-line and set take-profit levels indicates preparation for a possible correction. I still believe in shorts on EURUSD.
Conclusion
Traders and investors should monitor the price action near the triangle apex for breakout confirmation. The set stop loss and take-profit levels provide a structured approach to managing the trade, balancing potential gains with risk mitigation. Stay tuned for more updates on the trade.

CHECK EURUSD SIGNAL READ CAPTAINeurusd sell now ✅
entry point (1.15350) (1.15300)
TAKE PROFIT 1: (1.15100)
TAKE PROFIT 2: (1.14900)
LAST TARGET(1.14700)
STOP LOSS (1.15600)

CHECK EURUSD SIGNAL READ CAPTAINeurusd sell now ✅
entry point (1.16200) (1.16100)
TAKE PROFIT 1: (1.15800)
TAKE PROFIT 2: (1.15450)
LAST TARGET(1.15050)
STOP LOSS (1.16600)

EURUSD SHORT FORECAST Q2 W25 D20 Y25EURUSD SHORT FORECAST Q2 W25 D20 Y25
Professional Risk Managers👋
Welcome back to another FRGNT chart update📈
Diving into some Forex setups using predominantly higher time frame order blocks alongside confirmation breaks of structure.
Let’s see what price action is telling us today!
💡Here are some trade confluences📝
✅Weekly order block rejection
✅15' order block
✅4 hour order block identified
✅Tokyo ranges to be filled
🔑 Remember, to participate in trading comes always with a degree of risk, therefore as professional risk managers it remains vital that we stick to our risk management plan as well as our trading strategies.
📈The rest, we leave to the balance of probabilities.
💡Fail to plan. Plan to fail.
🏆It has always been that simple.
❤️Good luck with your trading journey, I shall see you at the very top.
🎯Trade consistent, FRGNT X

EURUSD - Shifting from Bearish to Bullish Soon!Hello TradingView Family / Fellow Traders. This is Richard, also known as theSignalyst.
📈EURUSD has been overall bullish trading within the rising wedge marked in blue.
Moreover, the orange zone is a strong support!
🏹 Thus, the highlighted blue circle is a strong area to look for buy setups as it is the intersection of support and lower blue trendline acting as a non-horizontal support.
📚 As per my trading style:
As #EURUSD approaches the blue circle zone, I will be looking for bullish reversal setups (like a double bottom pattern, trendline break , and so on...)
📚 Always follow your trading plan regarding entry, risk management, and trade management.
Good luck!
All Strategies Are Good; If Managed Properly!
~Rich
Disclosure: I am part of Trade Nation's Influencer program and receive a monthly fee for using their TradingView charts in my analysis.

ABC Bullish Hello awesome traders, hope you're having a great week!
We’ve got a clean ABC bullish setup unfolding beautifully on EURUSD 4H:
🔶 Pattern: ABC Bullish
🕓 Timeframe: 4H
⚡️ Structure: AB=CD completion at 61.8% with PRZ confluence
📍 Entry Level: 1.15058 (confirmed breakout + retest)
🎯 Target 1: 1.16006 (AB=CD)
🎯 Target 2: 1.16561 (extended projection)
🛑 Invalidation: Below 1.13717 (D-point)
Technical Highlights:
✅ 61.8% retracement support at D
✅ 78.6% BC retracement
✅ Price bounced cleanly and is consolidating above EL
✅ Momentum build above structure, higher lows in play
📊 Watching for continuation toward 1.1600 and beyond if structure holds.
Trade smart, protect capital, and let the pattern do the work!

EUR/USD - H4 - Triangle Formation (31.05.2025)The EUR/USD pair on the H4 timeframe presents a recent Formation of a Triangle Pattern.
1. Wait for Breakout with Good Volume
2. Conformation in short Timeframe Must
🎁 Please hit the like button and
🎁 Leave a comment to support for My Post !
Fundamental Updates :
Dollar mixed on tariff uncertainty, U.S. President Donald Trump to battle a U.S. trade court ruling that blocked most of his proposed tariffs.
Your likes and comments are incredibly motivating and will encourage me to share more analysis with you.
Best Regards, KABHI_TA_TRADING
Thank you.
Disclosure: I am part of Trade Nation's Influencer program and receive a monthly fee for using their TradingView charts in my analysis.

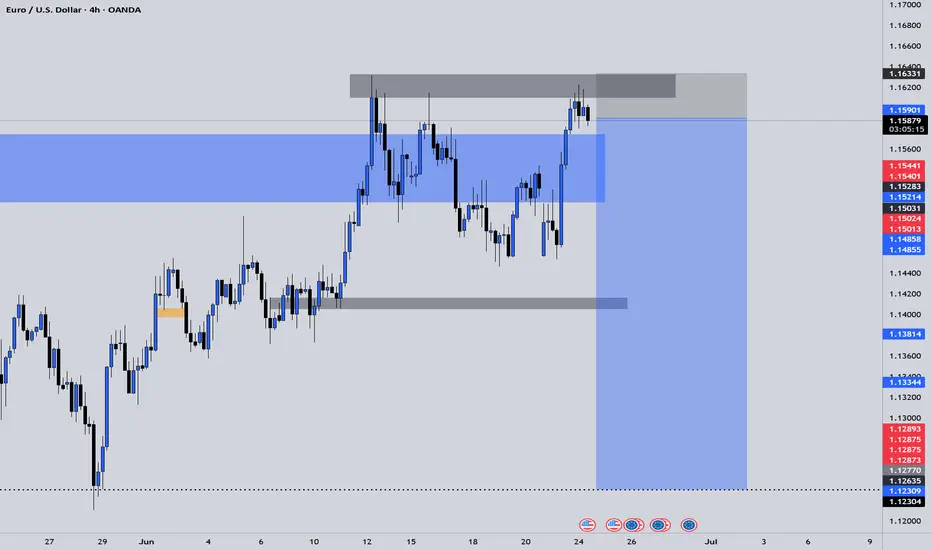
Euro H4 | Potential reversal off a multi-swing-high resistanceThe Euro (EUR/USD) is rising towards a multi-swing-high resistance and could potentially reverse off this level to drop lower.
Sell entry is at 1.1609 which is a multi-swing-high resistance.
Stop loss is at 1.1675 which is a level that sits above the 127.2% Fibonacci extension.
Take profit is at 1.1535 which is a pullback support that aligns with a 50% Fiboancci retracement.
High Risk Investment Warning
Trading Forex/CFDs on margin carries a high level of risk and may not be suitable for all investors. Leverage can work against you.
Stratos Markets Limited (tradu.com ):
CFDs are complex instruments and come with a high risk of losing money rapidly due to leverage. 63% of retail investor accounts lose money when trading CFDs with this provider. You should consider whether you understand how CFDs work and whether you can afford to take the high risk of losing your money.
Stratos Europe Ltd (tradu.com ):
CFDs are complex instruments and come with a high risk of losing money rapidly due to leverage. 63% of retail investor accounts lose money when trading CFDs with this provider. You should consider whether you understand how CFDs work and whether you can afford to take the high risk of losing your money.
Stratos Global LLC (tradu.com ):
Losses can exceed deposits.
Please be advised that the information presented on TradingView is provided to Tradu (‘Company’, ‘we’) by a third-party provider (‘TFA Global Pte Ltd’). Please be reminded that you are solely responsible for the trading decisions on your account. There is a very high degree of risk involved in trading. Any information and/or content is intended entirely for research, educational and informational purposes only and does not constitute investment or consultation advice or investment strategy. The information is not tailored to the investment needs of any specific person and therefore does not involve a consideration of any of the investment objectives, financial situation or needs of any viewer that may receive it. Kindly also note that past performance is not a reliable indicator of future results. Actual results may differ materially from those anticipated in forward-looking or past performance statements. We assume no liability as to the accuracy or completeness of any of the information and/or content provided herein and the Company cannot be held responsible for any omission, mistake nor for any loss or damage including without limitation to any loss of profit which may arise from reliance on any information supplied by TFA Global Pte Ltd.
The speaker(s) is neither an employee, agent nor representative of Tradu and is therefore acting independently. The opinions given are their own, constitute general market commentary, and do not constitute the opinion or advice of Tradu or any form of personal or investment advice. Tradu neither endorses nor guarantees offerings of third-party speakers, nor is Tradu responsible for the content, veracity or opinions of third-party speakers, presenters or participants.

Trading balanceTrading balance The price of the asset has rebounded from the balance zone. With the prospect of growth into the resistance zone.

Bottom in for the dollar against the EuroI know many people are calling for the decline of the dollar and to invest in Europe, but the chart shows a different picture.
The chart shows that the dollar has bottomed against the Euro and looks set to make a run at the highs.
I think over the coming months/years, the dollar will go back above par against the Euro and will likely outperform the Euro for the coming years.
The recent decline in the dollar was just to backtest support, and now that we have done that, I think the bottom is in.
Breaking above the trend line should accelerate the bullish move.

EUR/USD analysis and pending orderTwo days ago, there was a FED meeting, where it was stated that the benchmark interest rate will be kept at 4.25-4.50% level.
What is important is what they told - the expectations - economicp rojections are lower, and inflation is higher.
Maybe they’ll decrease rates in future?
Right now, it’s not so important. It’s summer already, and by the old “Sell in May, and go aways” mentality, I don’t expect some huge impact on the market.
I know… Iran, Israel, Trump, maybe even Putin? Anybody can do some stupit stuff and everything can go to Hell.
And it’s Friday, not very smart time to open trades, so I’m putting pending order.
I decided for EUR/USD.
Timeframe is 4h.
On my chart I can see clear uptrend in the last couple of weeks, especially in the last 3 months.
Also, I see lower highs.
Upward trend is breached… Where it could stop?
Overall, I don’t expect the pair will come near parity, even though ECB lowered rates before FED did.
But some “selloff”, probably.
I used good old Fibonacci, draw it, and the price could potentialy drop to 50% level or even ideal 61…8%-78.6% zone.
Pending entry: 1.15577
TP: 1.12645
SL: 1.1671
If it activates today, I’ll leave it over the weekend.

EURUSD LONG FORECAST Q2 W26 D23 Y25EURUSD LONG FORECAST Q2 W26 D23 Y25
Professional Risk Managers👋
Welcome back to another FRGNT chart update📈
Diving into some Forex setups using predominantly higher time frame order blocks alongside confirmation breaks of structure.
Let’s see what price action is telling us today!
💡Here are some trade confluences📝
✅Daily order block
✅15' order block
✅Intraday breaks of structure
✅4H Order block
🔑 Remember, to participate in trading comes always with a degree of risk, therefore as professional risk managers it remains vital that we stick to our risk management plan as well as our trading strategies.
📈The rest, we leave to the balance of probabilities.
💡Fail to plan. Plan to fail.
🏆It has always been that simple.
❤️Good luck with your trading journey, I shall see you at the very top.
🎯Trade consistent, FRGNT X
