EUR/USD Bullish Setup: Long from Fib & Trendline SupportEUR/USD is in a bullish continuation. We’re now looking for a long entry between the 0.618 Fibonacci level and trendline support, with the stop-loss placed below recent lows. Targeting current highs and potential new highs.
EURUSD_TOM trade ideas

EURUSD LAST LIQUIDITY GRAB BEFORE WE CRUSH :))Take 15m SELL as seen on the chart, with help of DIVENGANCE @ LIQUIDITY AREA give me more reason to take this SELL
I can see all the way to 1.113 but we will take profit along the way till final destination
Monday was horrible but Tuesday can be our start of the week :)
Thats trading for you :))

EURUSD LONG FORECAST Q2 W26 D23 Y25EURUSD LONG FORECAST Q2 W26 D23 Y25
Professional Risk Managers👋
Welcome back to another FRGNT chart update📈
Diving into some Forex setups using predominantly higher time frame order blocks alongside confirmation breaks of structure.
Let’s see what price action is telling us today!
💡Here are some trade confluences📝
✅Daily order block
✅15' order block
✅Intraday breaks of structure
✅4H Order block
🔑 Remember, to participate in trading comes always with a degree of risk, therefore as professional risk managers it remains vital that we stick to our risk management plan as well as our trading strategies.
📈The rest, we leave to the balance of probabilities.
💡Fail to plan. Plan to fail.
🏆It has always been that simple.
❤️Good luck with your trading journey, I shall see you at the very top.
🎯Trade consistent, FRGNT X

EURUSD: Expecting Bearish Continuation! Here is Why:
The recent price action on the EURUSD pair was keeping me on the fence, however, my bias is slowly but surely changing into the bearish one and I think we will see the price go down.
Disclosure: I am part of Trade Nation's Influencer program and receive a monthly fee for using their TradingView charts in my analysis.
❤️ Please, support our work with like & comment! ❤️
EU SHORT TERM BEARS?EURUSD have been bullish overall.
Short term sells coming into place?
Not an A+ Setup, Beware

EURUSD SHORT FORECAST Q2 W25 D20 Y25EURUSD SHORT FORECAST Q2 W25 D20 Y25
Professional Risk Managers👋
Welcome back to another FRGNT chart update📈
Diving into some Forex setups using predominantly higher time frame order blocks alongside confirmation breaks of structure.
Let’s see what price action is telling us today!
💡Here are some trade confluences📝
✅Weekly order block rejection
✅15' order block
✅4 hour order block identified
✅Tokyo ranges to be filled
🔑 Remember, to participate in trading comes always with a degree of risk, therefore as professional risk managers it remains vital that we stick to our risk management plan as well as our trading strategies.
📈The rest, we leave to the balance of probabilities.
💡Fail to plan. Plan to fail.
🏆It has always been that simple.
❤️Good luck with your trading journey, I shall see you at the very top.
🎯Trade consistent, FRGNT X

EURUSD - Looking to the upside retest of SupplyLooking to the upside, first lets get that push to lower level of liquidity swing then a push to the upside. Only on bullish confirmation at our highlighted level. I think we have one more retest before catching a potential short (pullback) on the larger time frame. Long term target for EURUSD is 1.200.

EURUSD SELL expectancy EURUSD SELL expectancy, looking at the chart you can see that EURUSD is not likely to break the high of yesterday. The buy is 30% the sell is 70% possible outcome

ABC Bullish Hello awesome traders, hope you're having a great week!
We’ve got a clean ABC bullish setup unfolding beautifully on EURUSD 4H:
🔶 Pattern: ABC Bullish
🕓 Timeframe: 4H
⚡️ Structure: AB=CD completion at 61.8% with PRZ confluence
📍 Entry Level: 1.15058 (confirmed breakout + retest)
🎯 Target 1: 1.16006 (AB=CD)
🎯 Target 2: 1.16561 (extended projection)
🛑 Invalidation: Below 1.13717 (D-point)
Technical Highlights:
✅ 61.8% retracement support at D
✅ 78.6% BC retracement
✅ Price bounced cleanly and is consolidating above EL
✅ Momentum build above structure, higher lows in play
📊 Watching for continuation toward 1.1600 and beyond if structure holds.
Trade smart, protect capital, and let the pattern do the work!

eurusd short and then long idea short idea price should come to support zone and retest then it can go high maybe . but for now its a good time to catch up the short

FVG (Fair Value Gap) or Imbalance Zones (grey boxes):Key Zones & Markings:
SSL (Sell Side Liquidity) - "True return to support" (bottom horizontal line around 1.13700):
Indicates that price has swept the sell-side liquidity, grabbing stop-losses below previous lows.
This often precedes a reversal if it aligns with a key support zone.
FVG (Fair Value Gap) or Imbalance Zones (grey boxes):
Price is expected to retrace back into these imbalanced zones.
These zones act as magnet areas where price might rebalance before further continuation.
Target Zone (Top Horizontal Line at ~1.16200):
Marked as the bullish target, likely aligning with buy-side liquidity (BSL) or unfilled imbalances.
Potential take profit area for long entries from the support zone.
📈 Market Structure:
Price made a lower low, swept liquidity (SSL), and is now showing potential bullish intent.
Anticipated move:
Reversal from support
A clean bullish move toward FVGs
Final target near 1.16200
🎯 Strategy Idea:
Long Entry Zone: Near 1.137–1.140 (liquidity sweep + support).
Target: 1.15500 (intermediate) and 1.16200 (final).
SL (Stop Loss): Could be below the most recent low (if re-entry needed).
🧠 Concept Used:
Liquidity sweep (SSL)
Return to support
Fair Value Gap (FVG) fill
Smart Money long setup

EURUSD Midweek Outlook | 3H - 15M Dual ViewLeft side chart shows the 3H Bird’s Eye structure — price swept the recent highs but failed to follow through, signaling external bull weakness. That shift in narrative tells me price may be prepping to drop, potentially targeting the SSL below before gathering fuel to attack major highs.
Right side zooms in on the 15M — I’m patiently watching for a clean lower high to break (CHoCH) followed by a pullback to confirm a sell entry. Until I get that proper LTF trigger, I stay on the sidelines. Execution always follows alignment.
Bias: Short
HTF Structure: 3H sweep of highs, showing weakness
LTF View: Waiting for 15M confirmation (break + retest)
Target: SSL below
Mindset Note: Trade what’s shown, not what’s felt. Stay sharp, stay patient.
Bless Trading!

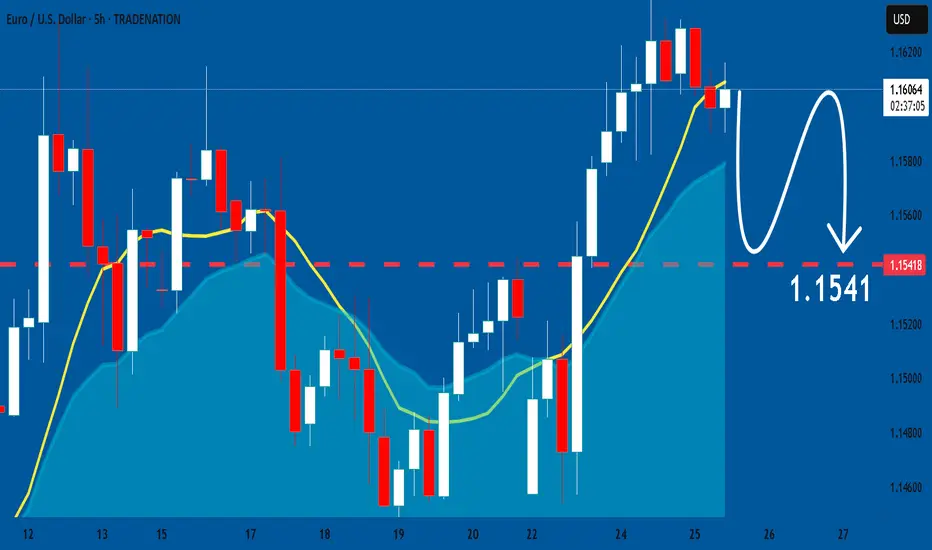
EURUSD 15M READY FOR CRASH TO 1.113???At the moment the price action show BEARISH SIGN (MAKING HH/HL) and trade below SUPPORT turn RESISTANCE @ around 1.1542
Market open with the GAP DOWN today, which as you can see we already fill it
One can go in @ the GAP (AGGRESIVE ENTRY)
Or wait till 1.4874 SUPPORT taken away (MUCH SAFER ENTRY)
All and all im very BEARISH WITH EURUSD THIS WEEK
All the best trader

EURUSD A Fall Expected! SELL!
My dear friends,
Please, find my technical outlook for EURUSD below:
The price is coiling around a solid key level - 1.1609
Bias - Bearish
Technical Indicators: Pivot Points Low anticipates a potential price reversal.
Super trend shows a clear sell, giving a perfect indicators' convergence.
Goal - 1.1532
About Used Indicators:
The pivot point itself is simply the average of the high, low and closing prices from the previous trading day.
Disclosure: I am part of Trade Nation's Influencer program and receive a monthly fee for using their TradingView charts in my analysis.
———————————
WISH YOU ALL LUCK

EURUSD Short Part IIEURUSD Analysis
On EURUSD daily chart from CMC Markets quota, indicates a bullish trend with a symmetrical triangle pattern forming. The price has recently broken above a key resistance level, suggesting potential for continued upward movement.
Key Price Levels
Current Price: 1.16932
Stop Loss (SL): 1.16549
Take Profit 1 (TP1): 1.12003
Take Profit 2 (TP2): 1.09318
Trend Analysis
EURUSD shows clear signs on an ascending trend supported by higher lows and higher highs since early 2025. Both orange trend-lines which I created form a symmetrical triangle, with the price nearing the apex, hinting at a potential breakout or reversal which I have been looking for a reversal bearish breakout.
The upward momentum is strong, but the proximity to the upper trend-line and set take-profit levels indicates preparation for a possible correction. I still believe in shorts on EURUSD.
Conclusion
Traders and investors should monitor the price action near the triangle apex for breakout confirmation. The set stop loss and take-profit levels provide a structured approach to managing the trade, balancing potential gains with risk mitigation. Stay tuned for more updates on the trade.

CHECK EURUSD SIGNAL READ CAPTAINeurusd sell now ✅
entry point (1.15350) (1.15300)
TAKE PROFIT 1: (1.15100)
TAKE PROFIT 2: (1.14900)
LAST TARGET(1.14700)
STOP LOSS (1.15600)

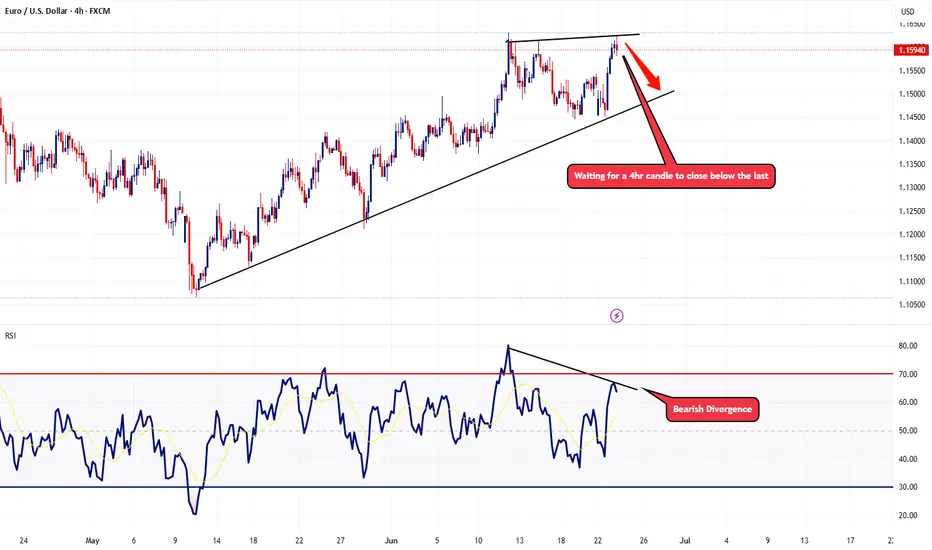
EURUSD Potential Topping ActionTaking a look at the 4hr chart, RSI is showing signs that the bullish momentum is starting to fade with the bearish divergence. In the event we get a 4hr candle that closes below the last, I'll be looking to start scaling some short positions with this pair.
Trade Safe - Trade Well.
EURUSD facing resistance at Triple TopEURUSD facing resistance at Triple Top. With new geo-political situtaion yesterday night, Eith it will retace from this level or from upper channel line.

EUR USD LONG RESULT Price fell inside a closing wedge pattern towards the end of the last trading week and broke out of the wedge pattern with the major resistance Trendline laying above for test.
I look the long setup from the support zone in Confluence with the support Trendline of the falling wedge, and price held and moved better than expected hitting our TP.
We'll see if price would dump again from the current resistance zone and major bearish Trendline or break above and probably create new highs, we'll see.
_THE_KLASSIC_TRADER_.

EURUSD is in a Downside DirectionHello Traders
In This Chart EURUSD HOURLY Forex Forecast By FOREX PLANET
today EURUSD analysis 👆
🟢This Chart includes_ (EURUSD market update)
🟢What is The Next Opportunity on EURUSD Market
🟢how to Enter to the Valid Entry With Assurance Profit
This CHART is For Trader's that Want to Improve Their Technical Analysis Skills and Their Trading By Understanding How To Analyze The Market Using Multiple Timeframes and Understanding The Bigger Picture on the Charts

EURUSD SHORT TRADE IDEAAfter seeing some bearish pressure, we can look to enter a short trade after waiting for confirmation
EURUSD: Bears Will Push Lower
The analysis of the EURUSD chart clearly shows us that the pair is finally about to tank due to the rising pressure from the sellers.
Disclosure: I am part of Trade Nation's Influencer program and receive a monthly fee for using their TradingView charts in my analysis.
❤️ Please, support our work with like & comment! ❤️

EUR/USD - H4 - Triangle Formation (31.05.2025)The EUR/USD pair on the H4 timeframe presents a recent Formation of a Triangle Pattern.
1. Wait for Breakout with Good Volume
2. Conformation in short Timeframe Must
🎁 Please hit the like button and
🎁 Leave a comment to support for My Post !
Fundamental Updates :
Dollar mixed on tariff uncertainty, U.S. President Donald Trump to battle a U.S. trade court ruling that blocked most of his proposed tariffs.
Your likes and comments are incredibly motivating and will encourage me to share more analysis with you.
Best Regards, KABHI_TA_TRADING
Thank you.
Disclosure: I am part of Trade Nation's Influencer program and receive a monthly fee for using their TradingView charts in my analysis.
