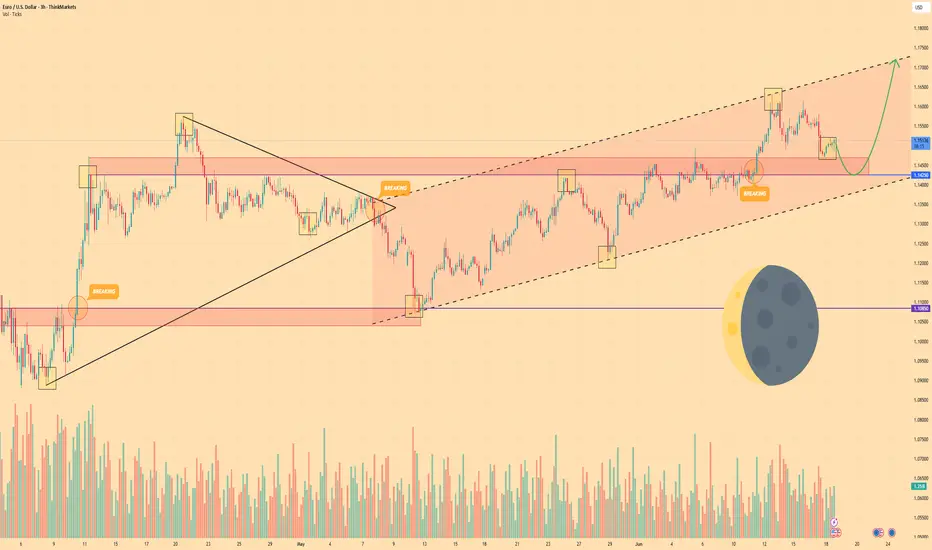
EURO - Price can correct to support area and then continue riseHi guys, this is my overview for EURUSD, feel free to check it and write your feedback in comments👊
Some days ago, price declined below support level and then started to grow inside a triangle pattern.
In this pattern, Euro broke $1.1085 level and even rose higher than $1.1425 level, but soon made a correction.
Later price exited from triangle and fell to support level, after which it started to grow inside rising channel.
Inside channel, price rose near support line and later reached $1.1425 level one more time, and some time traded close.
Soon, Euro broke this level and rose to resistance line of channel and then started to move down.
In my opinion, EUR can fall to support area and then continue to grow in channel to $1.1720 resistance line.
If this post is useful to you, you can support me with like/boost and advice in comments❤️
Disclaimer: As part of ThinkMarkets’ Influencer Program, I am sponsored to share and publish their charts in my analysis.
EURUSD_TOM trade ideas
EURUSD Stalling—Breakout or Breakdown Next?EURUSD has been trending higher but is now flashing signs of exhaustion. While shorts remain risky without more confirmation, aggressive traders could explore them near the highs. Longs also carry increasing risk at these extended levels. Two idea paths: a cautious long continuation, or a speculative reversal trade. A clean break of key trendlines will likely invalidate short setups and resume the uptrend.

EURUSD H2 Best Levels to BUY/SELL and Market Update🏆 EURUSD Market Update m20 short-term trade
📊 Technical Outlook
🔸Short-term: BEARS 1275
🔸1500/1540 short sell rips/rallies
🔸Mid-Term outlook: BULLS 1750
🔸bulls buy low 1250/1275 reload
🔸bulls exit at 1750 swing trade
🔸Price Target Bears: 1250/1275
🔸Price Target Bulls: 1750
🌍 Macro & Political Drivers
U.S. tax & spending concerns: The Congressional Budget Office now projects President Trump's tax‑and‑spending bill will raise deficits by about $2.8 trillion over the next decade. This massive debt addition is pressuring the U.S. dollar, as rising Treasury issuance and weaker fiscal confidence weigh on demand.
Geopolitical tensions: Escalation in the Israel–Iran conflict is pushing investors toward the safe-haven U.S. dollar. The DXY jumped to around 98.80 as President Trump’s remarks on Iran sent the EUR/USD down to approximately 1.1484.
EU developments: ECB officials, including Christine Lagarde, are doubling down on strengthening Europe’s financial infrastructure to elevate the euro as a viable alternative to the dollar — calling this a “global euro moment.”
Key resistance is around 1.1550–1.1575; downside support zones near 1.1450 and broader range 1.1360–1.1420 remain intact, though current levels suggest consolidation above the lower range. Strength from safe-haven flows could stall upward momentum.
📊 ECB Policy & Inflation Signals
The ECB cut rates by 25 bp last week to 2.0%, reinforcing the message that inflation remains subdued (1.9% in May) and prompting a data-driven, meeting-by-meeting decision approach.
ECB speakers stress “agile pragmatism” given global uncertainties, citing the euro’s ~10% rally year-to-date but cautioning amid rising oil prices and geopolitical risks.
⚡ What to Watch Next
Catalyst Outlook
U.S. yields & bond auctions More issuance tied to tax plans could steepen the curve and support the USD.
Middle East headlines Escalation may continue to offer dollar safe-haven benefits, pressuring EUR/USD.
EU economic data Inflation softness (e.g., France) could weaken ECB’s stance, re-pressuring the euro.
Technical levels Watch 1.1450 support—holds for possible rebound; resistance 1.1550–1.1575 for upside pressure.
✅ Summary
Current: EUR/USD around 1.1484, with bearish tilt amid risk aversion.
Bull case: Ongoing U.S. fiscal weakness, delayed tariffs, and ECB support for euro could cap downside.
Bear case: Safe-haven demand from geopolitical tensions, Fed‑ECB divergence, and technical breakdown through 1.1450 could push toward 1.1360.

Can the EUR/USD break out of its range-bound trading?The EUR/USD has advanced for the third consecutive trading day, rebounding above the key 1.1500 level and trading around 1.1530 during the European session. US President Trump's statement that it would take two weeks to decide whether to intervene in the Middle East conflict effectively alleviated market concerns over conflict escalation, providing support for the euro. Analysts believe that the exchange rate is likely to remain range-bound between 1.1400 and 1.1600 over the next 1-2 weeks. Any new developments in geopolitical tensions could significantly impact the exchange rate. If positive progress is made in the Iran nuclear talks, the exchange rate is expected to challenge the upper boundary of the range; conversely, if the Middle East situation deteriorates further, the exchange rate may retest the 1.14 support level.
you are currently struggling with losses,or are unsure which of the numerous trading strategies to follow,You have the option to join our VIP program. I will assist you and provide you with accurate trading signals, enabling you to navigate the financial markets with greater confidence and potentially achieve optimal trading results.
Trading Strategy:
buy@1.4500-1.4700
TP:1.5300-1.5500

#AN009: US attacks IRAN, what will happen?
On June 22, 2025, the United States launched air strikes on three Iranian nuclear sites (Fordow, Natanz, Isfahan), using bunker-buster bombs and Tomahawk missiles, some dropped by B-2 stealth bombers
President Trump declared that the facilities were “completely and totally obliterated”
📈 Tensions and geopolitical context
Tehran responded with missiles aimed at Israel and promised “tough responses”
The UN and key figures such as Guterres and Medvedev have defined the action as a dangerous escalation with the risk of a new conflict on a regional scale.
Israel supported the attacks, while Iran convened the UN Security Council to condemn the aggression.
💥 Market Impact
⚡ Energy Sector
Oil prices jump towards $90–100 per barrel on fears of flows from Iran and potential closures of the Strait of Hormuz.
Investors reacted with a move towards safe haven assets such as the Dollar, Gold and Treasuries.
📊 Equities and sensitive sectors
Starts on an uncertain tone: S&P500 and Nasdaq futures “volatile open”, with penalties on travel and tech, and increases on energy and defense.
Gulf markets open slightly higher (Saudi, Qatar, Bahrain, Kuwait), thanks to the attenuation of initial sell-offs.
🌍 Global economic impact
Weakening predictions from the World Bank, IMF and OECD predict an economic slowdown due to energy shocks and increased global tensions.
📌 Currency and Forex Scenario
USD has gained ground as a safe haven asset, benefiting from Safety flows.
Commodity-linked pairs, such as AUD/USD, NZD/USD and CAD/USD, will be pressured by rallying oil.
Potential increase in volatility on EUR/USD and GBP/USD: they rotate towards safe haven and US/China political risk.
📣 What to watch out for
Daily and H4 candlesticks in EUR/USD and GBP/USD to understand if support holds under geopolitical stress.
Volatility indicators (VIX | MOVE) are rising, it is useful to calibrate the size and prefer structured trades.
In the coming days it will be essential to monitor:
Reuters/Bloomberg for updates on possible sanctions or public retaliation.
ASEAN and Asia for regional reactions on energy supplies.
Central banks on inflation expectations due to high oil.
💡 Conclusions – Market and Forex Impact
This military action represents a classic geopolitical shock: rising dollar and defensive assets, pressure on oil and high volatility on stock markets and exchange rates. Unlike Israeli attacks, the direct entry of the US increases the degree of macro uncertainty.
For Forex traders:
USD Index: potential rebound within the bullish trend channel
Pairs with commodities: activate strategies on breakout key levels (e.g. AUD/USD, CAD/USD)
Anti-USD FX (EUR, GBP, JPY): under pressure and to be used in range rebound.
For the equity sector:
Rotation towards defensive sectors, defense, energy.
Possible entry into government bonds as a high inflation/political hedge.
Overall, the impact is clear: increased geopolitical risk → high volatility → shift towards USD/safe haven asset → penalization of sensitive assets.
EURUSD: Important Supports & Resistances For Next Week 🇪🇺🇺🇸
Here is my latest structure analysis for EURUSD for next week.
Consider these supports and resistances for breakout/pullback trading.
❤️Please, support my work with like, thank you!❤️
I am part of Trade Nation's Influencer program and receive a monthly fee for using their TradingView charts in my analysis.

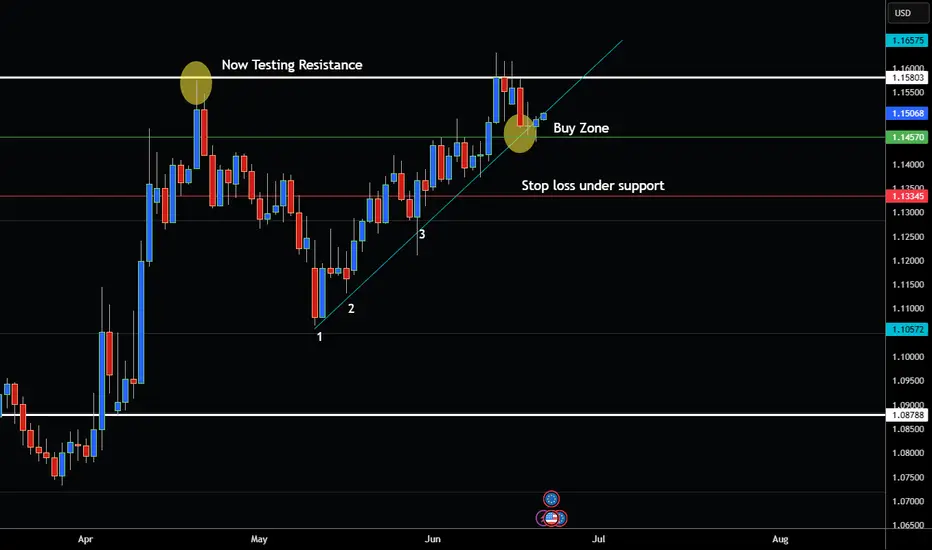
EUR/USD NOW IN BUY ZONE!Looking very bullish Plus bounced off support recently at 1.457.
However watch out for resistance at 1.158 it could pause, reverse or break through.
Of course daily close above resistance would be a very strong bullish trend continuation sign.
Always use Risk Management!
(Just in case your wrong in your analysis most experts recommend never to risk more than 2% of your account equity on any given trade.)
Hope This Helps Your Trading 😃
Clifford
Long position on the 1h/15m LTFThis is a position that just got filled a while ago.
It was executed using supply and demand zones on the LTF.

EURUSD 15M CHART PATTERNHere's a structured summary of your EUR/USD trade setup:
---
📈 EUR/USD Buy Setup
Entry (Buy): 1.14660
Take Profit Targets:
1. TP1: 1.14940
2. TP2: 1.15100
3. TP3: 1.15330
Stop Loss: 1.14260
---
⚖ Risk-Reward Ratios
Let’s break down the potential Risk:Reward (R:R) for each target:
Risk per trade: 1.14660 – 1.14260 = 40 pips
R:R for each TP level:
TP1 (1.14940): (1.14940 – 1.14660) = 28 pips → R:R = 0.7:1
TP2 (1.15100): (1.15100 – 1.14660) = 44 pips → R:R = 1.1:1
TP3 (1.15330): (1.15330 – 1.14660) = 67 pips → R:R = 1.7:1
---
🧠 Strategy Suggestions
Scaling Out: You could take partial profits at each TP level to lock in gains and manage risk.
SL Management: Consider moving stop loss to breakeven after TP1 is hit.
Volatility Awareness: Watch for any economic events or Fed/ECB news that might increase volatility.
---
Would you like a position size calculator or a chart visualization for this setup?

How do you eat an elephant? Small pieces at a time (EURUSD)I know we all are anticipating huge bearish moves from this pair. Some of us sold early and got kicked out. Other sellers have turned bullish. I believe we have found a top here. Sell and take all profit at 1,15765

EURUSD Bullish flag breakout at 1.1525Trend Overview:
The EUR/USD currency pair maintains a bullish sentiment, supported by a sustained rising trend. Recent intraday price action shows a bullish flag breakout, a continuation pattern that typically signals further upside potential.
Key Levels to Watch:
Support:
1.1525 – critical former consolidation zone and breakout base
Below that: 1.1440 and 1.1360 as deeper retracement targets
Resistance:
Initial target: 1.1700
Further resistance at: 1.1740 and 1.1780
Scenarios:
Bullish Continuation:
A retest and hold of the 1.1525 support would confirm strength post-breakout
Could trigger renewed buying toward 1.1700, then 1.1740 and 1.1780
Bearish Reversal:
A daily close below 1.1525 would invalidate the bullish flag
Opens the path for a deeper correction toward 1.1440 and 1.1360
Conclusion:
EUR/USD remains technically bullish following the flag breakout, with upside momentum favoured above 1.1525. Traders should watch for price action near this key level — holding it supports a bullish continuation, while a breakdown may trigger a short-term bearish correction.
This communication is for informational purposes only and should not be viewed as any form of recommendation as to a particular course of action or as investment advice. It is not intended as an offer or solicitation for the purchase or sale of any financial instrument or as an official confirmation of any transaction. Opinions, estimates and assumptions expressed herein are made as of the date of this communication and are subject to change without notice. This communication has been prepared based upon information, including market prices, data and other information, believed to be reliable; however, Trade Nation does not warrant its completeness or accuracy. All market prices and market data contained in or attached to this communication are indicative and subject to change without notice.


EURUSD shortIn my previous analysis in Friday, June 20, I had short pending order on this pair.
Due to US attack on Iran base's over the weekend, I closed it and put another pending short position visible here.
SL: 1.1582
Entry: 1.1550
TP: 1.1357
I expect higher volatility today, but don't expect bigger jump to the upside, so my risk:reward is bigger now.
I expect the price to clean Friday high's and go down again.

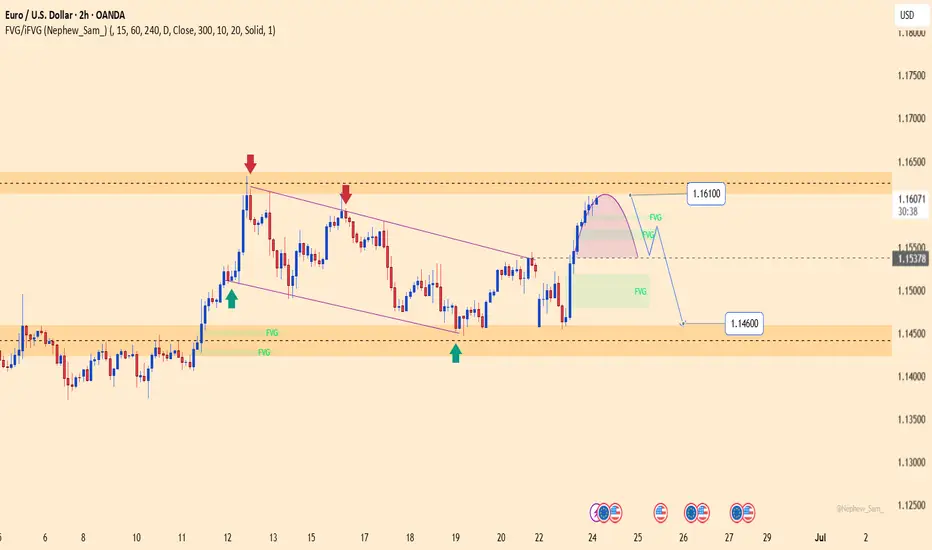
EURUSD – Rejected at 1.16100, bearish pressure re-emergingEURUSD has just completed a technical rebound toward the 1.16100 resistance zone, which has previously rejected price multiple times. The current structure suggests a mild reversal, with a potential pullback toward 1.15378. A break below this support could extend the decline toward 1.14600.
Recent upside momentum came mainly from temporary USD weakness, but the greenback remains supported by expectations that the Fed will keep interest rates elevated, while Eurozone PMI data continues to disappoint.
In summary, 1.16100 remains a key resistance level. If price shows clear rejection here, EURUSD may be poised for a deeper correction in the short term.
EURUSDThis levels is for reactions to support and resistace.
Price can now in Bull-trend if keep 1.145$ in sypport and breaked trendline.
⚠️Control risk management for positions.


Support and Resistance Zones
Resistance zone is marked near 1.16000.
Support zone is marked around 1.14500.
Price Action:
Price is currently near 1.15776, heading towards the resistance.
There’s a strong white candle indicating bullish momentum.
Projected Price Path:
A white projection line suggests a move upwards to test the resistance zone.
Then, a grey projection line suggests a potential reversal from the resistance, falling back to test the support level.
Interpretation:
This is likely a range-trading or false breakout trap analysis:
The trader is possibly expecting a fake breakout above the resistance before a drop back down toward the support area.

A bullish breakout from the descending channel is anticipated.Chart Breakdown
🔻 Price Action & Structure:
The market is currently trending downward within a descending channel, marked by two parallel white trendlines.
The current price is around 1.14797, with visible lower highs and lower lows, indicating a short-term bearish trend.
🔄 Projected Move:
A bullish breakout from the descending channel is anticipated.
The white projected path shows:
A dip toward the demand zone (highlighted in teal-green) around 1.13400–1.13800.
A reversal from that zone, forming higher highs and higher lows.
A move toward the upper liquidity zone, labeled EQH (Equal Highs) around 1.16000, suggesting a target for buy-side liquidity.
🧠
EQH = Equal High Liquidity
:
The EQH zone marks an area where previous highs are equal or nearly equal — a common target for price manipulation or stop-hunting.
It’s expected that the market will sweep this area for liquidity before possibly reversing or continuing.
💡 Interpretation:
The setup reflects a liquidity-based strategy using smart money concepts.
Bearish short-term → bullish medium-term outlook.
Potential trade idea: Wait for price to tap the lower demand zone, then look for entry confirmation (e.g., bullish engulfing or Ch0CH) to ride toward EQH.

EUR-USD Will Keep Growing! Buy!
Hello,Traders!
EUR-USD is trading in an
Uptrend along the rising
Support and the pair will
Soon retest the support
From where we will be
Expecting a bullish rebound
And a bullish continuation
Buy!
Comment and subscribe to help us grow!
Check out other forecasts below too!
Disclosure: I am part of Trade Nation's Influencer program and receive a monthly fee for using their TradingView charts in my analysis.

EURUSD: TRADE WHAT YOU SEEThis current price has a history... that's why i advice people to navigate the market like an elephant .... watch howmany times price fell from this level in the past and how many pacent it dropped ...use a line ..do your analysis based on history...if it breacks that level ..its going straight to -61.8 or straight to the monthly trendline ...

EURUSD is moving within the 1.14000 - 1.16100 range👀 Possible scenario:
The euro fell toward 1.14600 on June 23 as safe-haven flows boosted the U.S. dollar following surprise U.S. airstrikes on Iranian nuclear sites. Markets had hoped for diplomacy after Trump previously hinted at a delayed decision.
Investors remain cautious amid fears of retaliation or oil supply disruptions, lifting demand for dollar assets. Focus now turns to eurozone and U.S. PMI data. Weak European readings could push EUR/USD lower, while strong results may spark a rebound toward 1.15400.
✅ Support and Resistance Levels
Now, the support level is located at 1.14000
Resistance level is located at 1.16100

EUR/USD 2-Hour Chart Analysis2-hour candlestick chart for the Euro/U.S. Dollar (EUR/USD) currency pair, sourced from OANDA, as of June 23, 2025. The current exchange rate is 1.14705, reflecting a 0.45% decrease (-0.00517). The chart highlights recent price movements, with a marked resistance zone around 1.15218 and a support zone near 1.14483. An upward trend is indicated with an arrow, suggesting potential price action toward the resistance level.

EU bias idea Expecting something like this to playout on eu keeping in view the bullish bias of dxy which resulted due to its failure to close below the W/M fvg. Can playout during pmi release as well.
DYOR
