CHECK EURUSD SIGNAL READ CAPTAIN(eurusd) buy zone
(trade satup)
entry point (1.14800) to (1.14700) 📊
first target (1.15000)📊
2nd target (1.15350) 📊
last target (1.15700) 📊
stop loss (1.14400)❌
EURUSD_TOM trade ideas

EURUSD - SHORT We have built up quite a lot of liquidity before our major supply zone.
Will give an update in the morning after seeing where price is at

EURUSD On G.Force There's a lot going on in EURUSD such that it requires combination of both technical and fundamental...if you are not an experienced trader ...stay off ....there is enough money to be made and also lot more to loose

Potential bearish scenario for the EURUSD. First Target 1.14747Higher time frame analysis
After price took out the monthly highs of 1.15729, we look to the monthly fair value gap of 1.10649 as a draw on liquidity. While this is the basis we will use as a filter for bias. Our target will be a much shorter term target.
Intermediate timeframe analysis
Following Tuesday's (17 June 2025) price action, we noted that a type 1 bearish dealing range has been formed on the 1h chart as noted in the chart above. Furthermore, note the 1H bearish order block sitting at the equilibrium point of the dealing range. This is also supported by a 1H IFVG in the discount of the dealing range. This creates a high probability setup to enter, targeting the lows of 1.14743.
Alternative scenario 1
Should we see the high of the order block of 1.15388 ran through we will look for a potential entry at 1.15531 with the same target.
Alternative scenario 2
Should this analysis fail, we could see the relative equal highs at 1.6311 being ran out. This would be the case of Tuesdays low becomes the low of the week which is a typical signature in weekly price action.
Bonus
You may note that each setup also provides a secondary target at the terminus of the 1H bearish Market maker sell model. This can be a separate entry or a partial target of one position depending on ones appetite. This would offer a rather handsome risk to reward ratio which would be worth the while.

Market next move Disruption to Bullish Scenario:
1. Resistance Zone Around 1.1540 – 1.1550
The price is approaching a psychological and potential resistance level around 1.1540–1.1550.
If the bulls fail to break this zone convincingly, a rejection could lead to a pullback or reversal.
2. Bearish Divergence in Volume
Despite upward movement in price, the volume doesn't show a strong bullish breakout. If momentum weakens while price rises, it might indicate a bearish divergence.
3. Rising Wedge Formation
The current price channel resembles a rising wedge, which is typically a bearish pattern.
A breakdown from this pattern (below the “support area” trendline) could trigger a sell-off toward 1.1500 or lower.
4. Economic Data or News Risk
Any sudden USD strength due to economic reports, Federal Reserve commentary, or geopolitical tension could flip the sentiment instantly.
Icons below the chart hint at upcoming news from the Eurozone or U.S., which could lead to volatility.
5. Overbought Condition
If technical indicators like RSI or MACD (not shown in this chart) are in overbought territory, a correction or profit-taking may happen soon.

EURUSDLarge speculators are heavily long EUR while USD longs are mild.
EUR (base) is fundamentally stronger than USD (quote), giving bullish bias for EUR/USD.

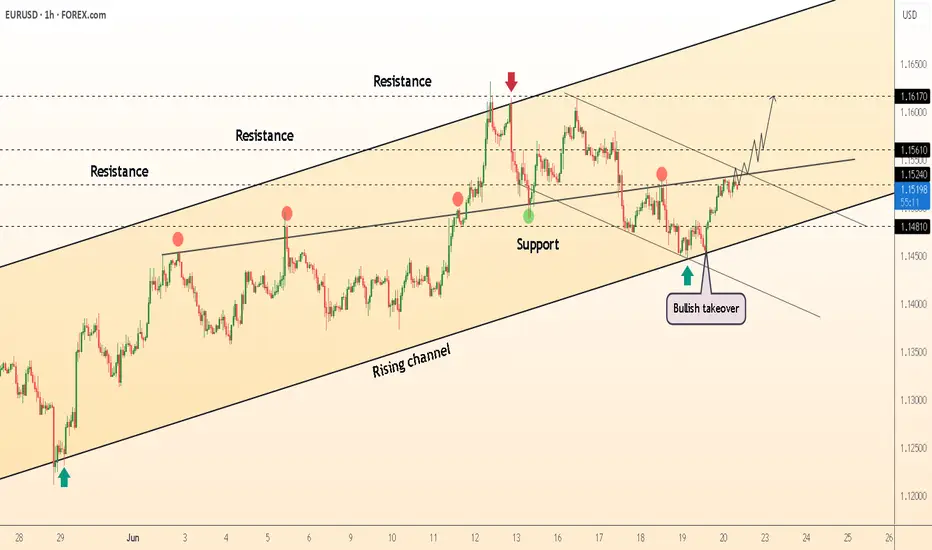
DeGRAM | EURUSD reached the resistance level📊 Technical Analysis
● Bulls defended the rising-channel mid-line (≈1.1480), turning it into support and snapping the intraday falling wedge; hourly closes now print higher highs above the reclaimed 1.1520 pivot.
● A tight bull flag is forming against 1.1560; its 1.618 swing coincides with the upper rail / 1.1617 resistance, keeping the channel’s momentum bias pointed north.
💡 Fundamental Analysis
● Softer US housing starts and a slide in 2-yr yields pulled the DXY to two-week lows, while ECB’s Knot warned “premature cuts risk inflation flare-ups,” widening the short-rate gap in the euro’s favour.
✨ Summary
Long 1.1515-1.1530; flag break >1.1560 targets 1.1617, stretch 1.1670. Bias void on an H1 close below 1.1480.
-------------------
Share your opinion in the comments and support the idea with a like. Thanks for your support
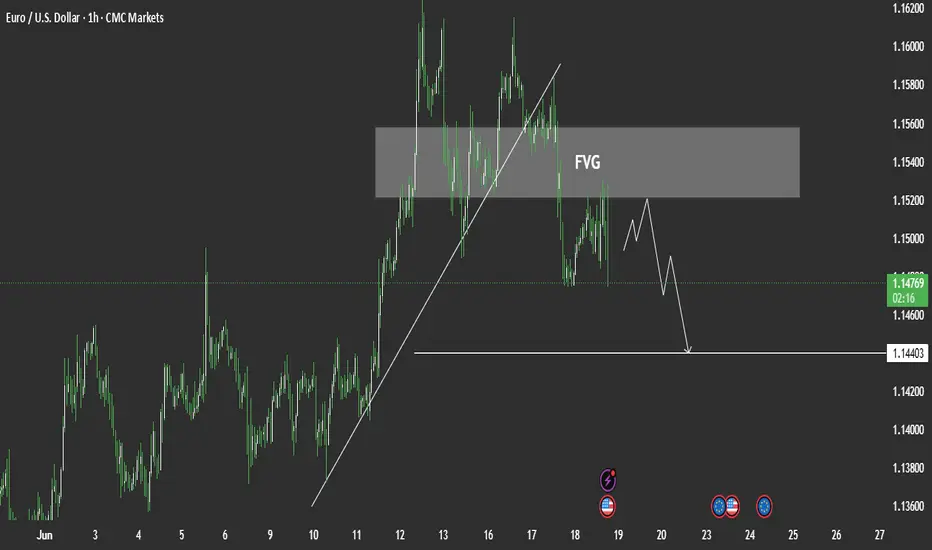
EUR/USD – Technical Price Forecast🔍 EUR/USD – Technical Price Forecast
As of June 18, 2025
Current Price: 1.15040
Bias: Bearish (Short-term)
Timeframe Context: Likely 4H or Daily
🧩 Market Structure Breakdown
🔺 Trend Context
Primary Trend (recent weeks): Bullish impulse from early June
Current Phase: Retracement / potential reversal
⬇️ Recent Price Action
Lower highs forming (arrows mark swing failure at ~1.1650 and ~1.1600).
Price has broken market structure to the downside around 1.1550 with a strong bearish candle.
Current retracement is weak and corrective, lacking momentum.
📐 Key Technical Levels
Level Type Observation
1.1650 Resistance Swing high / aggressive rejection
1.1600 Resistance Lower high + supply zone
1.1550 Supply zone Breakdown area
1.1500 Current zone Minor consolidation
1.1450–1.1400 Demand zone Prior accumulation zone (support)
1.1350 Next support Clean inefficiency below
📉 Liquidity & Order Flow Insight
Sell-side liquidity likely rests below 1.1400.
The recent bullish pullback appears to be a liquidity grab, not a reversal.
Imbalance created by recent bearish move remains unfilled.
📊 Candlestick Behavior
Strong bearish engulfing candle on the move from 1.1550 to 1.1480 indicates supply absorption.
Current candles are corrective and small-bodied — suggesting weak buying and potential continuation down.
🔮 Price Prediction / Forecast
Time Horizon Forecast Summary
Short-term (1–3 days) Expect minor bullish retracement to 1.1530–1.1550, followed by rejection.
Medium-term (3–7 days) Breakdown toward 1.1450, targeting liquidity below support zone.
Extended scenario If 1.1400 breaks cleanly, expect a drop toward 1.1350 and possibly 1.1300 as next support.
📌 Invalidation Level: A daily close above 1.1600 would invalidate this bearish scenario and imply further upside potential.
🧠 Strategy Implications (Pro Traders)
Sell the rally into 1.1530–1.1550 supply with stops above 1.1600.
Take profit levels:
TP1: 1.1450
TP2: 1.1400
TP3 (extension): 1.1350
Risk Management:
Risk-to-reward ratio ≥ 2:1. Confirm entry with bearish price action on lower timeframes (e.g., 1H).
⚠️ Macro Consideration
Multiple economic events approaching (U.S. and EU flags shown) — expect volatility. Hold trades cautiously around high-impact news.

EURUSD Breaks Structure: Bullish Continuation Opportunity💶 EUR/USD Analysis – Bullish Momentum Builds 📈
Taking a look at the EUR/USD on the daily chart, it’s clear the pair is currently in a strong bullish trend 🚀. Momentum has been building consistently, reflecting underlying euro strength and continued USD weakness.
🕓 On the 4H timeframe, we’ve now seen a clear shift in market structure to the upside, confirming bullish intent. Look for a continuation entry after a retracement back into equilibrium — ideally around the 50% level of the current price swing 🔄📐.
🎯 Trade Plan Idea:
Wait for price to pull back into equilibrium 🌀
Entry: Long from the discounted zone 🟩
Stop loss: Just below the recent swing low 🔻
Target: Previous high as a logical take-profit zone 🎯📊
⚠️ Disclaimer:
This content is for educational and informational purposes only and should not be considered financial advice. Always do your own research and consult with a qualified financial advisor before making any trading decisions. 📚💼

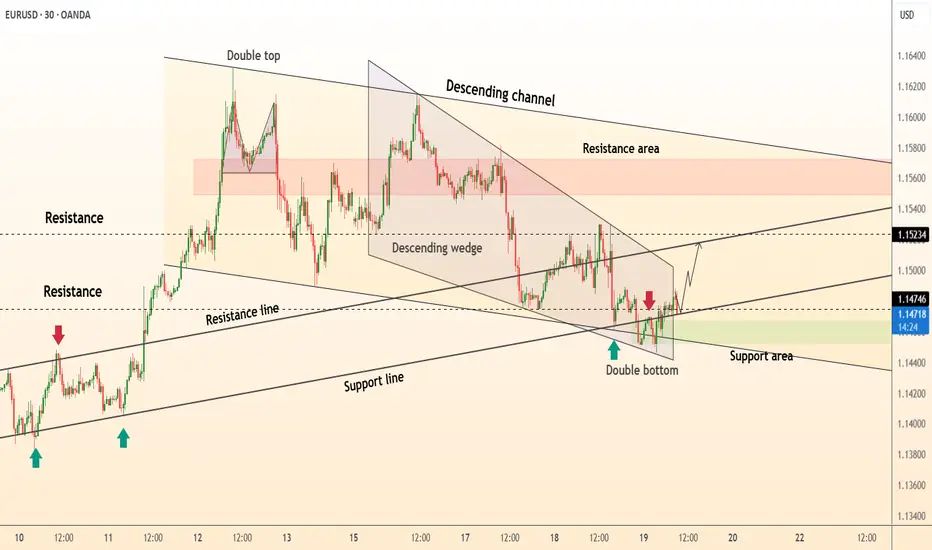
DeGRAM | EURUSD double bottom📊 Technical Analysis
● The price is currently testing the upper resistance of a descending wedge pattern after forming a clear double bottom formation. This double bottom occurred precisely at a confluence of support, where the long-term ascending support line intersects with the lower boundary of the wedge, indicating a strong potential for a bullish reversal from the 1.1450-1.1470 area.
● This recent bullish price action follows a prior "double top" pattern that initiated the corrective move downwards into the current wedge. A decisive breakout and hold above the wedge's resistance would invalidate the recent bearish pressure and confirm that buyers are taking control, with the first significant target being the horizontal resistance line near 1.1523.
💡 Fundamental Analysis
● Market attention is centered on the upcoming U.S. Federal Reserve policy meeting. While no rate change is expected, forward guidance is key. Current market sentiment, as noted by analysts at RoboForex and FreshForex, is pricing in the possibility of a Fed rate cut later this year, which could place downward pressure on the US Dollar.
● Conversely, the Euro is finding support from a comparatively hawkish European Central Bank (ECB). Recent reports indicate that the probability of an ECB rate cut has diminished, suggesting a policy divergence that favors EUR strength against the USD, underpinning the technical case for a move higher.
✨ Summary
Long entry on a confirmed 30-minute candle close above the descending wedge resistance (~1.1485); initial target 1.1523 → 1.1560. The bullish outlook is invalidated on a close below the double bottom support at 1.1450.
-------------------
Share your opinion in the comments and support the idea with a like. Thanks for your support

EURUSD on the riseYesterday, EURUSD failed to continue its pullback and has already recovered the drop caused by the news.
This suggests the correction might be over, and we could be seeing the start of a new bullish move.
The target is a breakout above the previous highs, aiming for 1,1706.
All positions we’re looking for are only in the direction of the main trend.

Market next move 🟥 Disrupted Analysis: Bearish Divergence on EUR/USD (1H)
Weak Support Zone:
The price labeled as "Support" was never a well-tested zone. It appears to be a minor structure, and the bounce lacks strong confirmation or significant volume.
Volume Decline During Rise:
The recent upward candles show shrinking volume, a sign that the buying momentum is weakening, not strengthening. Bulls are losing energy.
Potential Double Top Formation:
If price action near current levels stalls, a double top could form, which is a classic bearish reversal pattern. Watch for rejection below 1.1550.
Bearish Target Zone (if reversal begins):
First target: 1.1450 (minor support)
Break below that opens 1.1370 zone (volume support area)
---
📉 Disrupted Price Path (Opposing the Yellow Arrow)
Rejection
↓
┌─────────┐
│ ▼
│ Pullback to "Support"
▼ │
Breakdown │
▼ │
Target Zone ▼

ELLIOTT WAVE EURUSD H4 update
EW Trade Set Up H4
minute wave ((ii)) is running.
the
The upside move from 1.1070a of 120525 to 1.1635a of 120625 does not seem a motive wave , so a sideways (flat) correction of the minute wave ((ii)) is more likely
key levels (area)
1.1590
1.1538
1.1366 POC
1.1169
1.1080

EUR/USD 1H Time Frame – Bearish Trend FormingEUR/USD 1H Time Frame – Bearish Trend Forming
The EUR/USD pair continues to exhibit a bearish trend on the 1-hour chart, indicating increasing downside pressure. The price remains below key resistance levels, suggesting that sellers are still in control.
Technical Overview:
Resistance zone 1.15200
Support Level 1.14400
do you know some tips about this analysis check free and share in comments Thanks.
EURUSD - Bearish Double TOPHello Traders !
The EURUSD failed to create a new higher high.
The price formed a Double TOP pattern.
Currently, The neckline is broken !
So, I expect a bearish move📉
_____________
TARGET: 1.13995🎯

EURUSD Under Pressure Amid Geopolitical TensionsEURUSD – Technical Overview
EUR/USD is currently trading below the pivot zone at 1.1530, indicating a continuation of the bearish trend.
If the price remains below 1.1450, we may see an extension of the downtrend toward 1.1373, and potentially 1.1270.
However, if the pair holds above 1.1450, it may regain bullish momentum toward 1.1558 and 1.1625.
Geopolitical tensions in the Middle East could impact EUR/USD if the situation escalates, increasing risk-off sentiment and USD demand.
Key Levels:
• Pivot: 1.1530
• Support: 1.1450 / 1.1373 / 1.1270
• Resistance: 1.1558 / 1.1625 / 1.1675

Core Impact Logic of the Middle East Situation on EURUSD(I) Energy Transmission Chain: Oil Price Fluctuations → Eurozone Inflation and Economy
The escalation of the Middle East situation (the Iran - Israel conflict, risks in the Strait of Hormuz) directly impacts the global energy supply chain:
If the conflict expands to block the Strait of Hormuz (transports ~20% of global crude oil 🛢️), Brent crude has already soared from recent lows—spiking over 5% on June 17 amid tensions ⛽️. This pushes up imported inflation in the Eurozone.
As a net energy - importing region 🌍, prolonged high oil prices will squeeze corporate profits, suppress consumption, and drag Eurozone economic recovery (German/French manufacturing is acutely energy - cost - sensitive 🏭). This weakens the euro’s fundamental support.
(II) Geopolitical Safe - Haven Sentiment: The "Safe - Haven Balance" Between USD & EUR
Amid Middle East tensions, the US dollar’s traditional safe - haven status competes with Eurozone havens like German bonds 📈:
If the US (e.g., the Trump administration) intervenes militarily 💥, market fears of "America mired in war" rise. USD safe - haven demand may temporarily weaken ⬇️, and the euro benefits as funds shift 🔄
⚡️⚡️⚡️ EURUSD ⚡️⚡️⚡️
🚀 Buy@ 1.14500 - 1.15000
🚀 TP 1.15500 - 1.15600
Accurate signals are updated every day 📈 If you encounter any problems during trading, these signals can serve as your reliable guide 🧭 Feel free to refer to them! I sincerely hope they'll be of great help to you 🌟 👇

# EURUSD H1 SUPPLY WITH LIQUIDITY # EURUSD H1 Supply with mss with proper Liquidity entry with little pips of sl and big tp

EURUSD The Target Is DOWN! SELL!
My dear subscribers,
This is my opinion on the EURUSD next move:
The instrument tests an important psychological level 1.1588
Bias - Bearish
Technical Indicators: Supper Trend gives a precise Bearish signal, while Pivot Point HL predicts price changes and potential reversals in the market.
Target - 1.1555
About Used Indicators:
On the subsequent day, trading above the pivot point is thought to indicate ongoing bullish sentiment, while trading below the pivot point indicates bearish sentiment.
Disclosure: I am part of Trade Nation's Influencer program and receive a monthly fee for using their TradingView charts in my analysis.
———————————
WISH YOU ALL LUCK

EUR/USD Holds Neutral Tone Ahead of Fed DecisionIn recent hours, the pair has shown limited movement of just 0.5%, reflecting a neutral bias as the market prepares for the upcoming Federal Reserve policy announcement. At this point, expectations suggest that the U.S. central bank will maintain a neutral stance, keeping the interest rate steady at 4.5% in the short term.
However, the key focus will be on the Fed’s accompanying statement, where the greatest uncertainty lies. If the tone remains hawkish, it's likely that demand for the U.S. dollar will strengthen, potentially adding downward pressure to EUR/USD.
Uptrend Remains Intact
Since early March, the pair has maintained a steady bullish trend, without any major corrections that would threaten the current structure. That said, the price has once again approached key resistance zones, but has yet to break through them in a sustained manner—opening the door for range-bound movement if this pattern continues.
Technical Indicators
RSI: The Relative Strength Index has begun to show lower highs, while EUR/USD continues to print higher highs. This bearish divergence indicates an imbalance in market forces, potentially signaling room for a short-term correction.
MACD: The MACD histogram is fluctuating near the zero line, reflecting a technically neutral environment. As long as this behavior continues, the pair may enter a consolidation phase, awaiting a clearer directional signal.
Key Levels to Watch:
1.15443 – Current Resistance: Marks the multi-month high. A sustained move above this level could revive the bullish momentum.
1.13177 – Intermediate Support: Aligns with a recent neutral zone and the 50-period moving average. It acts as a technical support in the event of short-term pullbacks.
1.10428 – Key Support: Represents the lowest level of recent months. A break below this area could trigger a stronger bearish bias, putting the current uptrend at risk.
Written by Julian Pineda, CFA – Market Analyst
Follow him at: @julianpineda25

EURUSD: Market of Buyers
The charts are full of distraction, disturbance and are a graveyard of fear and greed which shall not cloud our judgement on the current state of affairs in the EURUSD pair price action which suggests a high likelihood of a coming move up.
Disclosure: I am part of Trade Nation's Influencer program and receive a monthly fee for using their TradingView charts in my analysis.
❤️ Please, support our work with like & comment! ❤️

EURUSD pushing away from 2025 highsAfter creating a new 2025 high last week, MARKETSCOM:EURUSD is now in a slight correction mode. Will the bears take control from here? Let's have a look.
FX_IDC:EURUSD
Let us know what you think in the comments below.
Thank you.
77.3% of retail investor accounts lose money when trading CFDs with this provider. You should consider whether you understand how CFDs work and whether you can afford to take the high risk of losing your money. Past performance is not necessarily indicative of future results. The value of investments may fall as well as rise and the investor may not get back the amount initially invested. This content is not intended for nor applicable to residents of the UK. Cryptocurrency CFDs and spread bets are restricted in the UK for all retail clients.
