EUR/USD Long-Term Trade Idea (Bullish to Bearish Transition)The EUR/USD pair is expected to enter a bullish phase in the near term, potentially rising toward the key resistance zones between 1.18616 and 1.20143. These levels are likely to act as strong reversal points, where the pair could encounter significant selling pressure.
Once price reaches this zone, a bearish reversal is anticipated, aligning with broader technical signals and long-term resistance structures.
This setup presents an opportunity to ride the bullish momentum toward these levels, then potentially shift to a sell bias upon confirmation of rejection or reversal patterns within that zone.
“Buy the strength, sell the exhaustion — let the market come to you.”
EURUSD_TOM trade ideas

EURUSD: Price Action + Elliott Wave + SMC Analysis
"Hello traders!
Today, we're diving deep into EURUSD with a comprehensive analysis combining Price Action, Elliott Wave principles, and Smart Money Concepts (SMC).
On the chart, we observe key price action elements including:
* A 'Psychological FVG' (Fair Value Gap) around the 1.15100 - 1.15261 area, which could act as a potential resistance or reversal poin
* A target or support level identified around 1.14494 and further down at 1.14502.
Looking ahead, the diagram on the right illustrates a potential Elliott Wave structure integrated with SMC concepts:
* We see proposed waves leading to a 'BOS' (Break of Structure) indicating a shift in market control.
* An 'Imbalance' zone is highlighted, suggesting an area where price might seek to rebalance before continuing its move.
* The overall structure points towards a continued bearish momentum after potential retracements.
Key Takeaways:
* Watch the identified FVG for potential reactions.
* Monitor for further BOS confirmations to validate the bearish outlook.
* The 'Imbalance' zone could offer shorting opportunities if price retests it.
This analysis provides a multi-faceted approach to understanding potential future price movements in EURUSD. Always remember to manage your risk effectively.
What are your thoughts on this analysis? Share your insights in the comments below!
#EURUSD #Forex #PriceAction #ElliottWave #SMC #TradingAnalysis #TechnicalAnalysis #MarketOutlook #ForexTrading"

EURUSD 1H is forming a Potential Bullish Reversal pattern
Price formed a Potential Double Bottom pattern with a neckline as current Temporary Resistance.
• ✅ Entry is triggered only after a confirmation candle breaks above the neckline.
• Buy Stop is placed around the neckline to catch the momentum move.
• Stop Loss is at the recent lower Low (safe and logical placement).
• 🎯 Take Profit levels are based on measured move projections.
Trade Plan:
• Buy Stop = 1.15264
• Stop Loss = 1.14552
• Take Profit 1: 1.15960
• Take Profit 2: 1.16663
• Lot size : 1:2 Risk Reward Ratio
“Waiting for neckline to break with Bullish confirmation candle” – this ensures you enter only on strong momentum.
EURUSD is forming a Potential Bullish Reversal pattern with wait and watch scenario.
Key Highlights:
• ✅ Pattern: Double Bottom
• ⚠️ Confirmation: Break + Bullish candle
• 🔄 Risk Management: Tight SL, 2 TP levels
• 🧩 Confluence: Trendline break + structure shift + RSI Divergence

EUR/USD Bearish Reversal AnalysisEUR/USD Bearish Reversal Analysis 📉🧭
🔍 Technical Breakdown:
Trend Structure:
EUR/USD was trading inside an ascending channel, respecting both support and resistance trendlines.
🔴 Double Rejection at Resistance:
Price action faced strong rejection near the upper boundary of the channel and resistance zone (~1.16500), forming a lower high, suggesting bearish exhaustion.
🟠 Key Breakdown Zone:
A critical horizontal support around 1.13560 has been identified as a short-term target zone. This level previously acted as a demand zone and now may be retested.
🔽 Forecast Path:
A projected bearish wave is anticipated:
A potential pullback or consolidation may occur before resuming the downtrend.
Once 1.13560 is broken, price could drop further toward the major support zone around 1.12000, marked by the previous accumulation area.
🟦 Support Zone:
This final target aligns with a major structural support from late May, strengthening the bearish outlook if the breakdown continues.
📌 Conclusion:
EUR/USD is showing signs of a bearish reversal after failing to sustain above resistance. As long as it remains below the mid-channel region, further downside toward 1.12000 is likely, with 1.13560 as the key short-term level to watch.

EURUSD price Bullish moment The Euro continues to gain strength against the US Dollar within a clearly defined ascending parallel channel. After a period of consolidation between June 6–10, price broke out with strong bullish momentum and is now respecting the channel's structure.
🔍 Key Levels to Watch:
🔺 Resistance Zone: 1.16083 – 1.16419
🔺 Upper Target: 1.16832 – 1.17000
🔻 Immediate Support: 1.15256
🔻 Strong Support: 1.14949
📈 Bullish Scenario : If price holds above 1.15256, we may see a move toward 1.16083 and potentially a breakout to test 1.16419 and 1.16832.
📉 Bearish Scenario: A drop below 1.15256 and a break of the ascending trendline may expose 1.14949 as the next key support.
🧠 Market Insight: This setup favors a bullish continuation while within the channel, supported by recent strong upside moves. Traders should look for confirmation around 1.16083 before expecting a breakout.
✅ Plan your entries wisely. Trade what you see, not what you feel.

I'm selling EURUSD, sliding down as we planned!Per my previous post, EURUSD is now bearish, and we are anticipating a continuation from here.
Apply proper risk management.
Follow me and turn on notification so you'll see my trades on time and enter them on time

eur/usdTRADE 5 long term i belive we are still bearish but long term retracement has been in order and is still going but it has hit a key resistance level that i dont belive it to break if it does break it we will look for it to hit the surport line and then use it as a entry, as fgor now though a engulfing candle pattern happend and i do belive us to go in the bearish movment back down lets see where it takes us

Refined EURUSD setup Saw a 2H choch last night and today we've kept moving lower creating a new internal range.
Going to be waiting for price to shift bullish internally before trying to get into any longs. If I do not see any bullish intention then I will short following the 2H internal structure moving my SL where appropriate
I am still bullish on EURUSD but just waiting on confirmation before taking any longs

EURUSD - Getting Over-Bought?Hello TradingView Family / Fellow Traders. This is Richard, also known as theSignalyst.
📈EURUSD has been overall bullish trading within the rising channels marked in red and blue. However, it is currently retesting the upper bound of the channels.
Moreover, the orange zone is a major daily high.
🏹 Thus, the highlighted red circle is a strong area to look for sell setups as it is the intersection of the upper blue/red trendlines and daily high.
📚 As per my trading style:
As #EURUSD approaches the red circle zone, I will be looking for bearish reversal setups (like a double top pattern, trendline break , and so on...)
📚 Always follow your trading plan regarding entry, risk management, and trade management.
Good luck!
All Strategies Are Good; If Managed Properly!
~Rich
Disclosure: I am part of Trade Nation's Influencer program and receive a monthly fee for using their TradingView charts in my analysis.

EURUSD LONGPrice swept below support around 1.1473, grabbing liquidity and quickly bouncing back — this is a classic Wyckoff spring setup.
📌 Key Levels
Entry: Around 1.1500
Stop Loss: Below 1.1424 (spring low)
Target 1: 1.1567 (range high)
Target 2: 1.1614 (measured move)
🔍 Why I like this setup:
Fake breakdown (spring) and quick recovery
Buyers showed up right after the sweep
Expecting price to return to the top of the range and possibly break higher . This a trade we hold
💡 A spring is where smart money steps in after trapping sellers — I'm following them.
“I always say that you could publish my rules in the newspaper and no one would follow them. The key is consistency and discipline.”

Potential bearish drop?EUR/USD has rejected off the resistance level which is a pullback resistance that aligns with the 38.2% Fibonacci retracement and could drop from this level to our take profit.
Entry: 1.1524
Why we like it:
There is a pullback resistance level that align with the 38.2% Fibonacci retracement.
Stop loss: 1.1572
Why we like it:
There is a pullback resistance level that is slightly above the 61.8% Fibonacci retracement.
Take profit: 1.1452
Why we like it:
There is a pullback support level that lines up with the 127.2% Fibonacci extension.
Enjoying your TradingView experience? Review us!
Please be advised that the information presented on TradingView is provided to Vantage (‘Vantage Global Limited’, ‘we’) by a third-party provider (‘Everest Fortune Group’). Please be reminded that you are solely responsible for the trading decisions on your account. There is a very high degree of risk involved in trading. Any information and/or content is intended entirely for research, educational and informational purposes only and does not constitute investment or consultation advice or investment strategy. The information is not tailored to the investment needs of any specific person and therefore does not involve a consideration of any of the investment objectives, financial situation or needs of any viewer that may receive it. Kindly also note that past performance is not a reliable indicator of future results. Actual results may differ materially from those anticipated in forward-looking or past performance statements. We assume no liability as to the accuracy or completeness of any of the information and/or content provided herein and the Company cannot be held responsible for any omission, mistake nor for any loss or damage including without limitation to any loss of profit which may arise from reliance on any information supplied by Everest Fortune Group.

long on EURUSD 15m*The content on this analysis is subject to change at any time without notice, and is provided for the sole purpose of assisting traders to make independent investment decisions.

EUR/USD Potential Reversal from Resistance Zone –Bearish OutlookThe EUR/USD pair has been trading within a well-defined ascending channel for several weeks. Price recently tested a strong resistance zone near 1.15850 – 1.16000, which aligns with the upper boundary of the channel and a previously marked supply area.
Key observations:
The price action shows signs of rejection from the resistance zone with a potential double-top or fakeout pattern forming.
A projected bearish trajectory is marked, suggesting a possible break below the channel support.
Immediate bearish targets are set at key demand zones around 1.14500, 1.12500, and further down to 1.10500.
A large red arrow indicates the strong downside bias if the price confirms the breakdown.
Conclusion:
If EUR/USD fails to sustain above the 1.15850 resistance zone and breaks below the ascending channel, a strong bearish correction is anticipated. Traders should watch for confirmation of the breakdown before entering short positions.

EURUSD,GBPUSD and USDJPY Analysis todayHello traders, this is a complete multiple timeframe analysis of this pair. We see could find significant trading opportunities as per analysis upon price action confirmation we may take this trade. Smash the like button if you find value in this analysis and drop a comment if you have any questions or let me know which pair to cover in my next analysis.


Markets on EdgeGlobal markets tread cautiously today amid rising Middle East tensions and investor jitters ahead of the Fed’s policy decision. Israel’s continued airstrikes on Iran, now in their 6th day, are weighing heavily on sentiment, with European stocks and oil prices lacking direction.
📊 US Dollar Watch:
Traders are closely eyeing the U.S. Dollar Index (DXY) weekly chart:
• 🔻 Price hit a new low, but RSI divergence signals waning downside momentum.
• ⚠️ Approaching long-term uptrend support from 2011 near 96.30 — could trigger profit-taking.
🪙 EUR/USD Weekly:
• ⚠️ Momentum fading as it nears the 78.6% retracement at 1.1696.
• RSI shows bearish divergence despite recent price highs.
📌 Key Takeaway: Charts suggest potential for a pause or reversal in recent USD weakness.
This is not investment advice.
#Forex #USD #EURUSD #DXY #FederalReserve #Markets #TechnicalAnalysis #Geopolitics #Trading

EUR/USD Slides Below Trendline The EUR/USD pair is trending lower and forming a short-term downtrend beneath a descending trendline, as the U.S. Dollar (USD) remains supported by its safe-haven appeal amid escalating tensions in the Middle East between Israel and Iran.
At the time of writing, the pair is trading around 1.1500, with bearish momentum still dominating. As long as the trendline holds, sellers maintain the upper hand — making trend-following short positions worth considering.
Wishing you all successful and smooth trading!

EU SELL IDEAWe identified our daily high & low. We also see price creating lower highs & lower lows, found our key levels of support & previous resistance . Now we ride the wave down to the previous daily low. We also see double engulfing & a break of our counter trend on the 15 min!
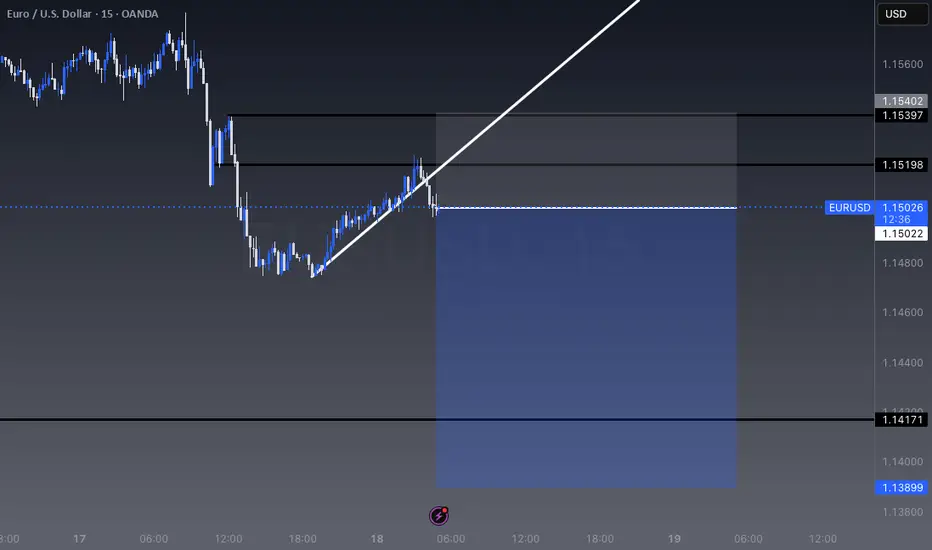

EURUSD: AN OPPORTUNITY TO BUY!! PEPPERSTONE:EURUSD I'm buying at current market price, I'll target the 1.16147 as my profit target.
EURUSD Has breakout the ascending channel bullish strong now EURUSD Breakout Alert!
EURUSD has broken out of the descending channel with strong bullish momentum from the key support level at 1.15100.
📈 Technical Outlook (4H Time Frame):
🔹 Key Support: 1.15100 (confirmed bounce)
🔹 1st Resistance Target: 1.16300
🔹 Bullish Order Block: 1.12900 – strong demand zone below
This breakout signals potential continuation to the upside. Stay tuned as price action develops! 🔥
📌 Like, Follow, Comment & Join us for more real-time updates!
Trade smart, stay informed 😜
— Posted by Livia

EUR/USD – Bearish Setup Activated
Price rejected key resistance and broke below the trendline, confirming a sell bias. Entered short after confirmation candle.
Targeting next support zone with strong RR.
Structure: Lower Highs & Lower Lows
Tools Used: Elliott Wave, SMC, Parallel Channel
Timeframe: ., 30m]
#ForexTrading #EURUSD #SmartMoney #PriceAction #SellSetup #TradingViewAnalysis"

