Eurusd Short-term bearish EUR/USD is showing bearish momentum, breaking below key support with lower highs forming. Selling pressure is increasing amid a stronger USD outlook, favoring a short position.
EURUSD_TOM trade ideas

Lingrid | EURUSD Pullback - Awaiting Trend Continuation SignalFX:EURUSD is consolidating above the upward trendline after forming a triangle within the broader ascending channel. The recent pullback tested the 1.1444 support zone, with a rebound hinting at renewed bullish pressure. A push beyond 1.1620 could unlock upside toward the 1.1700 resistance mark.
📈 Key Levels
Buy zone: 1.1444–1.1470
Sell trigger: breakdown below 1.1444
Target: 1.16200
Buy trigger: breakout above 1.1523 resistance
💡 Risks
Triangle breakdown could shift the short-term bias bearish
Failure to reclaim 1.1620 may stall bullish momentum
A sharp drop below the black trendline would invalidate the structure
If this idea resonates with you or you have your own opinion, traders, hit the comments. I’m excited to read your thoughts!

DON'T BE CAUGHT OFFGUARD, EURUSD IS BEARISHEurusd is bearish, it is selling. Don't be caught off guard. Once we see another clear BOS, we enter more. I want you to learn compounding with this trade. I want you to learn holding trade. You can create separate account for my trades and you will see the huge difference it will make in your trading account.
Follow me as my trades are mostly market orders so you'll see them on time and enter on time.

EURUSD OUTLOOK 1 - 4 JulyStill Bullish on EU. No Fundamental or technical reasons to be short.
We could have a short term pullback within the daily range to then continue long..
If we get that 4H pullback I will only long after getting a 4H technical confirmation.

Euro will make correction to support line of channelHello traders, I want share with you my opinion about Euro. In this chart, we can see how the price entered to triangle, where it at once bounced from the support line and rose to the 1.1100 support level, which coincided with the buyer zone. Soon, price broke this level, after a small correction, and continued to move up to the 1.1575 current support level, which coincided with the support area. This area also coincided with the resistance line of the triangle, and the Euro rebounded from this line and started to decline. In a short time, it declined to the buyer zone, where it turned around and started to move up. Soon, Euro exited from triangle and continued to rise inside an upward channel, where it made a correction first and then continued to grow. Later, EUR rose to 1.1575 current support level, one more time and even almost broke it, but failed and corrected. But soon, it finally broke this level and rose to the resistance line of the channel, where at the moment it continues to trade near. In my mind, Euro will rebound from this line and go to the correction until to support line of the channel, breaking the support level. For this case, my TP is located near this line - at the 1.1490 points. Please share this idea with your friends and click Boost 🚀
Disclaimer: As part of ThinkMarkets’ Influencer Program, I am sponsored to share and publish their charts in my analysis.

EURUSD: Support & Resistance Analysis for Next Week 🇪🇺🇺🇸
Here is my latest structure analysis
and important supports & resistances for EURUSD for next week.
Consider these structures for pullback/breakout trading.
❤️Please, support my work with like, thank you!❤️
I am part of Trade Nation's Influencer program and receive a monthly fee for using their TradingView charts in my analysis.

EURUSD – Watch for Short-Term Reversal at Key ResistanceHello everyone! What’s your take on EURUSD?
EURUSD is clearly in a strong uptrend, but we should also keep an eye on potential short-term selling opportunities.
I’ve placed an entry near the psychological resistance at 1.175, waiting for signs of a reversal. If strong selling pressure emerges at this zone, EURUSD could pull back with two clear targets: TP1 around 1.1650 and TP2 near the 1.1590 support, an area of previous high-volume accumulation.
Confirmation would come from a bearish reversal candlestick at resistance, ideally with increasing volume. This could be a great opportunity for those waiting for a healthy correction before the uptrend resumes.
What’s your outlook on this pair?

EURUSD BEARISH REVERSAL At the top 1.1745, we see strong rejection wicks and bearish engulfing candles, hinting at exhaustion of buyers, Market entered sideways consolidation between 1.1680 and 1.1740, Price failed to break out of this range multiple times — forming a range-bound or distribution phase.
The current bullish candle indicates a temporary relief rally after recent bearish pressure, Rejection from 1.1720–1.1740 may send price back to test 1.1690 or lower.

Mechanical rangesMany traders will talk about things like "Smart Money Concepts" (SMC) and think they have found something new.
The truth is, everything in trading stems back to Liquidity.
There is no "Algo" nobody is out to get you specifically. The market is always right, where you position yourself is your own choice.
I have written several posts on mechanical trading, recorded a number of streams. The more mechanical you can make the process, the less the emotions have a chance to kick your ass.
Let me give you a very simple method of being able to identify the ranges. Ignore the timeframes as this will work on any of them, on most instruments. (I say most, as some behave differently due to how it attracts liquidity). Lets assume high end crypto such as Bitcoin (BTC) and of course Forex in the general sense, stocks, commodities etc.
This is simple - only 2 rules.
You start by zooming out and giving yourself a general feel for the trend.
Let's say this looks to be an uptrend - we now need to understand the rules.
An opposing candle can simply be defined by a different colour. If the trend is up (Green) and we see a red candle - then it's an opposing candle.
The inverse is true, if we are down and the trend is Red. Then a Green candle would be opposing.
This is only half of the story. The second rule is a pullback candle or even a sequence of candles. This simply means either the very same opposing candle that doesn't make a new high or low (depending on the trend up not making fresh highs or down not taking new lows).
In this image, you can see we have in one candle both an opposing and pullback in one candle. This means we can now mark the high of the range. Working backwards to identify the swing range low.
This easy method means I can draw a range exactly the same and mechanically every single time.
Giving me a mechanical range.
We could then get a lot more technical by looking for liquidity, 50% of the range or places such as supply or demand areas.
But these are all for other posts.
For now, getting a range on the higher timeframes means you can work down and down into a timeframe you are likely to want to trade on.
These ranges will give clues to draws and runs of liquidity.
This will also help identify changes in the character and fresh breaks of structure.
Here's another post I posted on the mechanical structures and techniques.
More in the next post.
Have a great week!
Disclaimer
This idea does not constitute as financial advice. It is for educational purposes only, our principal trader has over 25 years' experience in stocks, ETF's, and Forex. Hence each trade setup might have different hold times, entry or exit conditions, and will vary from the post/idea shared here. You can use the information from this post to make your own trading plan for the instrument discussed. Trading carries a risk; a high percentage of retail traders lose money. Please keep this in mind when entering any trade. Stay safe.

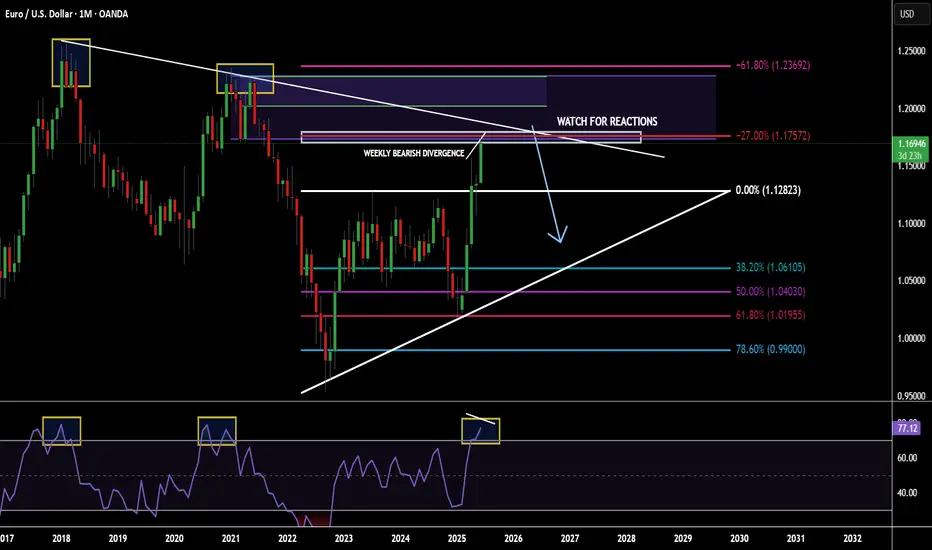
POTENTIAL EURUSD SHORT OPPORTUNITY...POSITION TRADEHello hello TradingView family! Hope you guys are doing amazingly well! Just wanted to come on here and make another post for a potential longer term opportunity I am seeing on the major currency pair EURUSD. So put your seat belts on and let's dive in!!
OK so I'm going to keep this very very simple. Not because I don't want to go in depth but because my trading is very simple and I'm just going to give it to you straight. So here are the points
1. Price is @ monthly supply
2. Price has made new highs & sitting at a monthly fib extension
3. Monthly RSI overbought conditions
4. Weekly has bearish divergence forming
5. Weekly/Daily buyer is slowing down
Make sense? If not..then I know you will figure it out. Watch for price to potentially poke a little higher but nice confluences for a fall in price. Appreciate you all!
EURUSD Sell, June 27HTF shows reaction from W/D Orderblocks with multiple Daily imbalances below as downside targets. While GBPUSD is also at a valid D OB, EU gives clearer confirmation on LTF.
On LTF, price opened London above Asia highs (ideal for short setups) and showed 15m BOS into a 15m POI.
We've tapped into a 5m Orderblock inside the 15m zone, followed by a clean 1m BOS.
📍Entry: 5m OB with SL above highs (tight 10 pip risk)
🎯 TP1: 1:3 (75% off)
🎯 Final TP: Below Asia low & Daily imbalance
📉 Risk: 0.25% (reduced it for more consistency)
Confident setup — but if price rallies to the upper 5m OB and leaves without us, that’s part of the plan. No chasing.

HelenP. I Euro will drop to trend line, after movement upHi folks today I'm prepared for you Euro analytics. If we look at the chart, we can see that EURUSD has been moving in a stable upward trend, supported by a clear ascending trend line. Each time the price approached this line, it rebounded and continued to grow, respecting the bullish structure. After the recent breakout from the support zone around 1.1500, the market made a strong impulse to the upside and reached a local high. Now, the momentum seems to be slowing down, which opens the possibility for a corrective movement. Given this setup, I expect that the price could first make a small upward push to trap late buyers, and then turn around to begin a decline. The trend line remains a critical technical level, and I anticipate the price will revisit it soon. For this reason, I’ve placed my goal at 1.1575 points — this area aligns with the trend line and can serve as the next support if a pullback occurs. As long as this level holds, the market remains in a bullish structure, but a correction seems likely before further growth. If you like my analytics you may support me with your like/comment.
Disclaimer: As part of ThinkMarkets’ Influencer Program, I am sponsored to share and publish their charts in my analysis.

Euro may start to decline to support line of upward channelHello traders, I want share with you my opinion about Euro. Earlier, the price was trading inside a downward wedge, gradually making lower highs and lower lows. After reaching the bottom of the wedge near the buyer zone (1.1210 - 1.1180), we saw a strong bullish impulse that broke through both the resistance line of the wedge and the support area near 1.1450 - 1.1485. This breakout signaled the beginning of a new phase - a transition into an Upward Channel. Since then, the price has been forming higher highs and higher lows, respecting both the upper and lower boundaries of this new structure. Along the way, it has rebounded from the support line multiple times and recently made a strong move up toward the resistance line of the channel. Currently, the price is approaching that resistance line, which may act as a potential reversal area. Given the previous price behavior and the clearly defined channel, I expect the price to reach the top boundary and then start to decline toward the lower support line. That’s why I’ve set my TP 1 at 1.1555 points, which aligns perfectly with the support line of the upward channel. Based on the recent breakout, the structure of the trend, and the reaction from key zones, I remain short-biased for the upcoming sessions. Please share this idea with your friends and click Boost 🚀
Disclaimer: As part of ThinkMarkets’ Influencer Program, I am sponsored to share and publish their charts in my analysis.

EURUSD Selling from Resistance at 1.17500 EURUSD Analysis –
4H Timeframe
The pair continues to respect its ascending channel, but current price action suggests a potential sell opportunity from the 1.17500 resistance zone.
🎯 Technical Targets:
🔻 1st Target – 1.16000 (Key demand zone)
🔻 2nd Target – 1.14500 (Deeper support area)
🔻 3rd Target – 1.12500 (Bullish Order Block)
💡 Watch for confirmation signals near resistance before entering shorts.
💬 Like, follow, comment, and join us for more real-time trade ideas and updates!
📲 Let’s grow and trade smart together 💼✨
— Livia 😜

EURUSD – Breakout Confirmed, Now Watching for Retest or 4hr ClosEURUSD has officially broken above the key 1.16020 resistance level on the 4hr chart, but price action has since gone stagnant. No strong bullish momentum has followed the break so far — a sign we may be due for a deeper pullback.
I remain bullish overall, but I'm watching for two potential scenarios:
✅ Safe Buy: Clean 4hr bullish close above 1.16020
🎯 HRHR Buy: Pullback to the former level of interest at 1.14149 if structure holds
Until one of those triggers, I’ll be patient. Let the setup come to you. Overall target remains the 1.18791 zone before reassessing.

EURUSD Bullish and Looking for SupportWe have seen more USD weakness since the ceasefire in the MIddle East as the threat of Global inflation caused by higher Oil prices lowers, raising hopes of future rate cutes by the FED
EURUSD has broken out cleanly from a previous resistance zone, and can act as support on any retests of the 1.1616-1.1632 zone
Stops would need to be below 1.1612
Targets to be around 1.1670-1.1685

EU on 4HEU on 4H - pretending to be bullish. showing signs to go up but on lower timeframe it shows it can be scalped the way through

EUR/USD Weekly – Two Long Setups Hello guys!
It is my perspective on eurusd!
Before we even reach the major resistance zone around 1.2050–1.2100, I’ve highlighted two long-term opportunities that may unfold as the price continues to climb.
✔ First Long Position:
It looks like a more conservative entry. The price is already above it. You can set a pending position!
It was likely aiming to catch the momentum as the price broke above the previous structure.
TP is near the descending trendline, around 1.2050–1.2100. a smart place to exit before major resistance hits.
✔ Second Long Position:
Positioned slightly lower. probably in case of a pullback or retest into the broken zone.
This one offers better risk-reward, but requires patience and a cleaner retracement.
Both longs are short-to mid-term swing ideas, aiming to ride the bullish leg into the bigger trendline rejection zone, where I’d personally be more cautious or even look for reversal setups.

EUR/USD Bullish Continuation Analysis EUR/USD Bullish Continuation Analysis 🚀💶
📊 Chart Summary:
The EUR/USD pair is demonstrating a strong bullish structure with consistent higher highs and higher lows. Recent price action shows a breakout above the 1.16386 resistance level, now acting as support 🛡️. The market is currently retracing and might retest this new support zone before continuing its upward move toward the target.
🔍 Key Observations:
🔸 Bullish Structure:
Multiple bullish impulses have formed a clean staircase pattern (🔼⬆️), indicating sustained buying momentum.
🔸 Support Zone 🟦 (1.13200 - 1.14000):
This zone has been tested multiple times, confirming its strength and the base of this bullish rally.
🔸 Breakout & Retest 🟠:
Price broke above the 1.16386 resistance level, pulled back slightly (highlighted by the orange circle), and now looks ready for a potential continuation to the upside.
🔸 Target 🎯: 1.18010
A clear target has been set based on measured move or resistance projection. If the price respects the current structure, we may see a continuation toward this level.
✅ Trade Outlook:
Bias: Bullish 📈
Entry Zone: Around 1.16386 (upon bullish confirmation)
Target 🎯: 1.18010
Invalidation ❌: Break below 1.1600 with bearish momentum
🧠 Technical Tip:
Always wait for confirmation on the retest before entering. Wick rejections or bullish engulfing candles at the support zone can provide additional entry confidence. 🔍✅

Bullish bounce off pullback support?EUR/USD is falling towards the support level which is a pullback support that aligns with the 38.2% and the 61.8% Fibonacci retracement and could bounce from this level to our take profit.
Entry: 1.1742
Why we like it:
There is a pullback support level that lines up with the 38.2% and the 61.8% Fibonacci retracement.
Stop loss: 1.1698
Why we like it:
There is a pullback support that is slightly below the 50% Fibonacci retracement.
Take profit: 1.1814
Why we like it:
There is a pullback resistance.
Enjoying your TradingView experience? Review us!
Please be advised that the information presented on TradingView is provided to Vantage (‘Vantage Global Limited’, ‘we’) by a third-party provider (‘Everest Fortune Group’). Please be reminded that you are solely responsible for the trading decisions on your account. There is a very high degree of risk involved in trading. Any information and/or content is intended entirely for research, educational and informational purposes only and does not constitute investment or consultation advice or investment strategy. The information is not tailored to the investment needs of any specific person and therefore does not involve a consideration of any of the investment objectives, financial situation or needs of any viewer that may receive it. Kindly also note that past performance is not a reliable indicator of future results. Actual results may differ materially from those anticipated in forward-looking or past performance statements. We assume no liability as to the accuracy or completeness of any of the information and/or content provided herein and the Company cannot be held responsible for any omission, mistake nor for any loss or damage including without limitation to any loss of profit which may arise from reliance on any information supplied by Everest Fortune Group.

EU Weekly28/06 Narrative:
BSL taken out @ 1.16921
Bearish QT SMT has formed
After long push up, price may retrace to 50% (1.14096)
And continue higher to 1.17527 targeting 1.2200 big figure.

EURUSD Sell Channel Strong Selling From Key Resistance 1.15200EURUSD Technical Update
Pair is respecting the descending channel and showing strong selling pressure from key resistance at 1.15200.
1H Time Frame Outlook
🔻 Target 1: 1.14700
🔻 Target 2: 1.14000
Momentum favors the bears as long as price remains below resistance.
💬 Drop your thoughts below,
📈 Like, follow, and join us for more real-time updates and insights!
— Livia 😜

Euro can drop from wedge, breaking support levelHello traders, I want share with you my opinion about Euro. The price previously started a confident upward movement, breaking out from the buyer zone around 1.1075 and forming an upward wedge pattern. As the trend continued, EUR pushed through the support area and traded inside the wedge, showing multiple bounces from the support line. Eventually, the pair reached the resistance line at the top of the wedge and then reversed. After a short correction, it tried to rebound again but failed to create a new high. The market then pulled back into the support area 1.1455 - 1.1410 and is now testing that level once more. Currently, the Euro is trading just above the support area, and we may see a short-term rebound from here. However, given the overall structure, I expect the price to break the support level and exit the wedge pattern to the downside. In my opinion, this breakout will initiate a strong bearish wave, targeting the 1.1250 points, which is where I’ve set my TP 1. Given the pattern structure, recent lower highs, and the weakening bullish momentum, I remain bearish and anticipate further decline once support is broken. Please share this idea with your friends and click Boost 🚀
Disclaimer: As part of ThinkMarkets’ Influencer Program, I am sponsored to share and publish their charts in my analysis.
