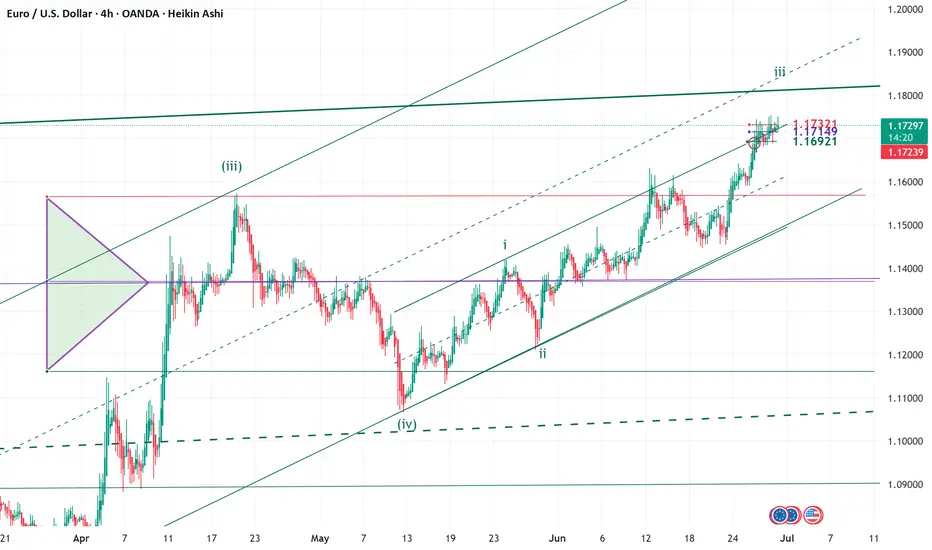
ELLIOTT WAVE EURUSD H4 update
EW Trade Set Up H4
minuette W4 ended, w5 running
with the decisive break of the 1.1570 level, wave 4 can be declared finished and wave 5 is underway in motive way. Not clear yet the type of motive wave impulsive or diagonal.
daily key levels (area)
1.1732
1.1715 POC
1.1690
EURUSD_TOM trade ideas
EURUSD – June 30th OutlookBias: Still bullish
Liquidity zone pullback: 1.16853 held as expected
Next move: Watching for break of Friday's high at 1.17342 → possible retest of 1.17311 → continuation upward
HRHR Setup: If price returns to 1.16853 today, it's a high risk play due to end-of-month volatility
Caution: If we break below the previous 4H candle, we could range between 1.17342 and 1.16853 for the remainder of the day.
🔹 Approach with caution — it’s the final trading day of the month.

eurusd 1hEURUSD – 1H Demand Zone (Outside the Range)
EURUSD is currently trading within a clear consolidation range. However, a 1H demand zone has formed outside the current range, indicating potential for a breakout-retest scenario. This demand lies below the consolidation structure, making it a set-and-forget style entry if price sweeps liquidity and returns to this zone.

here is the #forex #chart #EURUSD Cautiously bullish. EUR/USD is at $1.17155 as of June 29, 2025, up 0.20% daily and 3.76% monthly. Technicals show a bullish trend, with support at $1.1650 and resistance at $1.18-$1.19. Forecasts predict a rise to $1.174-$1.188 by month-end, driven by US dollar weakness amid Fed rate cut speculation and tariff concerns. However, mixed macroeconomic signals (core PCE at 2.7%, Eurozone Economic Sentiment at 94) and geopolitical risks (Middle East tensions, US fiscal issues) could cap gains or trigger volatility. A break above $1.1710 (127.2% Fibonacci) could target $1.20; a drop below $1.1650 risks $1.1573
EURUSD is in a Downside DirectionHello Traders
In This Chart EURUSD HOURLY Forex Forecast By FOREX PLANET
today EURUSD analysis 👆
🟢This Chart includes_ (EURUSD market update)
🟢What is The Next Opportunity on EURUSD Market
🟢how to Enter to the Valid Entry With Assurance Profit
This CHART is For Trader's that Want to Improve Their Technical Analysis Skills and Their Trading By Understanding How To Analyze The Market Using Multiple Timeframes and Understanding The Bigger Picture on the Charts

EUR/USD Weekly Outlook: +700 Pips Potential! Must-Watch Setup! 📊 EUR/USD Weekly Analysis
Here’s my weekly technical & fundamental outlook for EUR/USD, showing a strong upside potential of over 700 pips.
✅ Technical View:
The pair has broken out of a long consolidation range (blue box) with strong bullish momentum.
A rounded bottom pattern and potential retest around 1.1500 – 1.1600 support further upside.
Targets: 1.19845 as first resistance, then 1.23982 as a major resistance zone.
Watch for price action confirmation near support to catch the best buying opportunities.
✅ Fundamental Insight:
USD strength may ease amid monetary policy uncertainty.
Eurozone fundamentals are improving, supporting the bullish case.
🎯 Key Levels:
Major Support: 1.1500 – 1.1600
Key Resistances: 1.19845, 1.23982
📢 If you enjoy high-quality market ideas:
Don’t forget to Like 👍 – Comment 💬 – Share 📤 – Follow 🔔 me here on TradingView for the best setups every week!

Comprehensive Market Analysis: EUR/USD Comprehensive Market Analysis: EUR/USD
Here is my analysis, applying the principles of Candlestick patterns, Ichimoku, Heikin Ashi, and Fibonacci.
1. Monthly Timeframe (The Long-Term "Big Picture")
Observation: The market was in a long-term uptrend. However, the most recent candle is a very large, powerful bearish candle.
Candlestick Analysis: The last two candles form a textbook Bearish Engulfing pattern. The large red body has completely engulfed the real body of the prior green candle. According to the rules you taught me, this is a major bearish reversal signal, especially on such a high timeframe.
Ichimoku Analysis: The price is still technically above the Kumo (Cloud), which represents long-term support. However, it is showing strong momentum towards the cloud. The Chikou Span (Lagging Span) is still in open space, not yet confirming a breakdown.
Conclusion (Monthly): The primary long-term uptrend is now under serious threat. The Bearish Engulfing pattern is a significant warning sign that the momentum has shifted. The outlook for the coming months is Bearish / Corrective. The price is likely to test the top of the Kumo cloud as support.
2. Weekly Timeframe (The Dominant Trend)
Observation: The bearish momentum seen on the monthly chart is much clearer here. There is a sequence of strong, descending red candles.
Ichimoku Analysis: This chart is decisively bearish.
The price has clearly broken below the Kumo cloud.
The Tenkan-sen is below the Kijun-sen.
The Chikou Span is below the price action from 26 periods ago.
The Kumo ahead of the price has turned from green to red, signaling a future bearish outlook.
Candlestick Analysis: The last three candles are long, red, and making lower lows. This strongly resembles the Three Black Crows pattern, a powerful confirmation that the bears are in complete control of the trend.
Conclusion (Weekly): The weekly trend is Strongly Bearish. There are no conflicting signals here. Both the indicator system (Ichimoku) and the price action (Candlesticks) confirm a powerful downtrend.
3. Daily Timeframe (The Trading Trend)
Observation: A very clear, established downtrend is in progress.
Heikin Ashi Interpretation: If we were to view this with Heikin Ashi rules, this chart would show a sequence of long red candles with little to no upper wicks, which confirms a strong and healthy downtrend.
Fibonacci Analysis: The small rallies (green candles) that have occurred have been very shallow, failing to retrace significantly before the downtrend resumes. This indicates strong bearish momentum. Each small bounce is a corrective move within the larger bearish trend.
Conclusion (Daily): The daily trend is Established Bearish. The path of least resistance is clearly downwards. Traders would likely view any small rallies on this timeframe as selling opportunities.
4. 4-Hour and 1-Hour Timeframes (The Intraday Trend)
Observation: Both charts show a consistent pattern of lower highs and lower lows, which is the definition of a downtrend. The 1-Hour chart shows some periods of consolidation (like the "Spinning Top" candles you taught me, indicating indecision) before the next leg down.
Ichimoku Analysis: On both timeframes, the price is trading far below the Kumo cloud, which will now act as a major resistance zone. Any attempt to rally will face significant selling pressure from the cloud.
Conclusion (4H & 1H): The intraday trend is Bearish. The momentum is clearly to the downside.
5. Lower Timeframes (30M, 15M, 5M)
Observation: These charts show the most recent price action. There appears to be a very small, short-term bounce or consolidation happening on the 5-minute chart after a sharp sell-off.
Contextual Analysis: Based on the overwhelming bearish pressure from every single higher timeframe (Monthly, Weekly, Daily, 4H, 1H), this small bounce is very likely to be temporary "noise" or a minor profit-taking consolidation. It does not represent a genuine reversal.
Heikin Ashi Rule Application: A "sudden color change" after a strong trend can signal a reversal. However, rule #3 and #4 (smaller bodies, wicks on both sides) would likely appear first, signaling a weakening of the trend before any true reversal. We are not seeing a strong reversal signal here, only a pause.
Conclusion (Lower TFs): While prone to short-term bounces, the context is Overwhelmingly Bearish. These small rallies are fragile and likely to fail.
Overall Synthesis and Final Conclusion
By performing a top-down analysis as a real trader would, a very clear picture emerges:
Long-Term (Monthly): A major warning shot has been fired against the primary bull trend.
Medium-Term (Weekly/Daily): The trend has now confirmed a strong bearish reversal. The sellers are in firm control.
Short-Term (4H and below): The downtrend is active and established.
Final Outlook: The multi-timeframe analysis is in strong alignment. The overwhelming evidence suggests that the next significant move for EUR/USD will be to the downside. Any short-term bullish bounces should be viewed with extreme skepticism and are likely to be selling opportunities for trend-following traders. The overall market bias is Bearish.
For those interested in further developing their trading skills based on these types of analyses, consider exploring the mentoring program offered by Shunya Trade.
I welcome your feedback on this analysis, as it will inform and enhance my future work.
Regards,
Shunya Trade
⚠️ Disclaimer: This post is educational content and does not constitute investment advice, financial advice, or trading recommendations. The views expressed here are based on technical analysis and are shared solely for informational purposes. The stock market is subject to risks, including capital loss, and readers should exercise due diligence before investing. We do not take responsibility for decisions made based on this content. Consult a certified financial advisor for personalized guidance.

EURUSD -Long -1.1677EURUSD has shown the potential to move towards the levels of 1.1677.
The Pair can test the levels of 1.1175 or even 1.1050 to bounce back.

SMC Mechanical Entry Models Cheatsheet✅ Smart Money Concepts & Liquidity Checklist:
DOWNLOAD ENTRY MODELS GUIDE
1. Market Structure
🔹 Identify HTF Trend (H4 or H1): bullish, bearish, or range
🔹 Confirm Break of Structure (BOS) or Change of Character (CHoCH) on M15–M5
🔹 Look for lower highs/lows (downtrend) or higher highs/lows (uptrend)
2. Liquidity Zones
🔹 Look for equal highs/lows (liquidity pools)
🔹 Asian highs/lows — common targets during London/NY session
🔹 Recent internal range liquidity
🔹 Trendline liquidity — fakeouts often occur here
3. Premium & Discount Zones (PD Arrays)
🔹 Use Fibonacci from recent swing high to low
🔹 Look for entries at Discount (Longs) or Premium (Shorts) pricing
🔹 Ideal entries happen between 0.62–0.79 retracement
4. Supply & Demand Zones
🔹 Find fresh OBs (Order Blocks) that caused a break of structure
🔹 Use last bullish candle before strong drop (for short) or last bearish candle before strong rally (for long)
🔹 Confirm zone isn’t mitigated yet
5. Imbalance / Fair Value Gaps (FVG)
🔹 Identify large imbalanced candles (no wick overlap)
🔹 Ideal entries are inside the FVG aligned with direction
🔹 High probability if FVG is within OB or confluence with structure/liquidity
6. Confluences for Entry
🔹 Entry aligns with liquidity sweep or FVG/OB tap
🔹 Volume spike or rejection wick confirms interest
🔹 RSI divergence or exhaustion = bonus confirmation
🔹 Use M1/M5 for entry trigger after setup is formed on M15–H1
7. Entry Trigger
🔹 CHoCH or BOS on lower timeframe (M1-M5)
🔹 Confirmation with engulfing candle, FVG fill, or break/retest
🔹 SL below/above recent swing or OB boundary
8. TP/Exit Zones
🔹 TP1: After BOS/structure shift + partial
🔹 TP2: Next liquidity level (equal high/low or OB)
🔹 TP3: Opposite OB or major FVG
🔹 Adjust SL to breakeven after reaching TP1
9. Session Timing (Important)
🔹 Asian range → look for liquidity setup
🔹 London Open (3PM–6PM PH))→ manipulative move (liquidity grab)
🔹 NY Open (8PM–11PM PH) → continuation or reversal opportunity
🔹 Avoid high-impact news releases unless breakout
🔹 Use Forex Factory / MyFXBook for news calendar
10. Post-Trade Journaling:
🔹Screenshot HTF → LTF Setup (H4 > M15 > M1)
🔹Don’t skip journaling — it’s your #1 improvement tool.

EURUSD BUYSPrice swept liquidity and came into a 1H demand, price could still continue bullish next week to aim for 4H supply above before reversing as price is bearish on the monthly timeframe

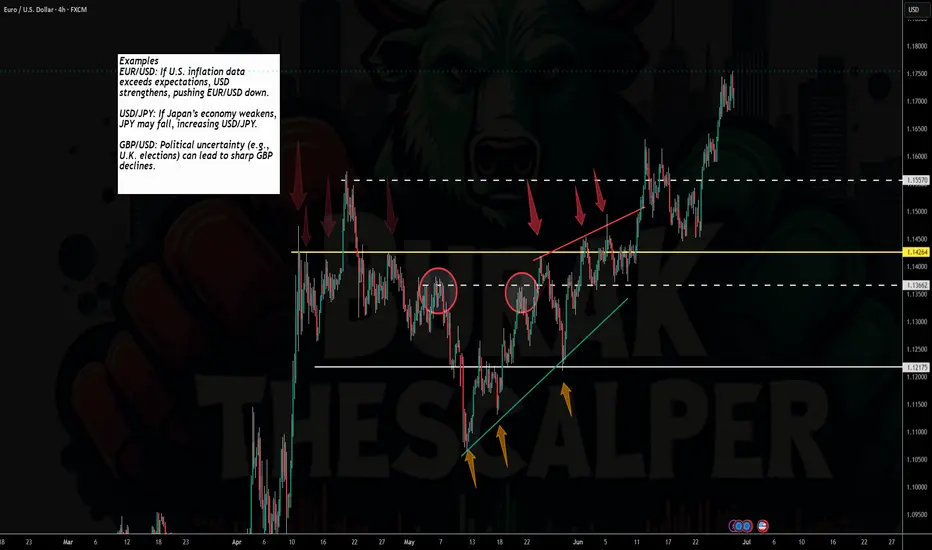
Market next target 🔍 Disruption Analysis of the EUR/USD Chart
1. "Support" Label Positioned at the Current Price Level
Disruption: The chart marks 1.1705 as “Support,” but price is sitting directly on or slightly above it.
Challenge: If price is already breaking through or hovering at support without bouncing, it’s a sign of weakness — this zone may no longer be valid as support.
✅ Correction: Re-label this area as “Potential Resistance” if a breakdown confirms.
---
2. Directional Bias Assumes Continuation Without Confirmation
Disruption: Three yellow arrows indicate a bearish continuation, yet no bearish candlestick pattern, volume spike, or break-close-below-support has been confirmed.
Challenge: This is a premature projection that lacks price action validation.
✅ Correction: Wait for a confirmed candle close below 1.1700 with increased volume to validate the move.
---
3. Volume Ignored Despite Clear Clues
Disruption: There is rising volume during the move down near support — this could indicate either strong selling or smart money accumulation.
Challenge: Volume analysis is completely overlooked, missing a critical layer of confirmation.
✅ Correction: Analyze the volume spike on the red candles; if followed by weak follow-through, a bullish reversal may be setting up instead

#EURUSD Buy 1.17016#EURUSD Buy 1.17016
SL 1.16416
TP 1.17216
TP 1.18016
TP 1.19416
Trade at your own risk
Protect your capital
The Wizard 🧙♂️ SWFX

Expecting a pullback to test the channel’s floorA strong candle without follow-through is a sign of trend weakness, and from where the channel has formed, a pullback to the channel’s floor is logical
OANDA:EURUSD

EURUSD Upbrake of the trend will confirm buy target.i have made several analysis of this in recent weeks and it moves excatly i predicted so far. soon with the upbrake of the trend will confirm our 1.1890 target

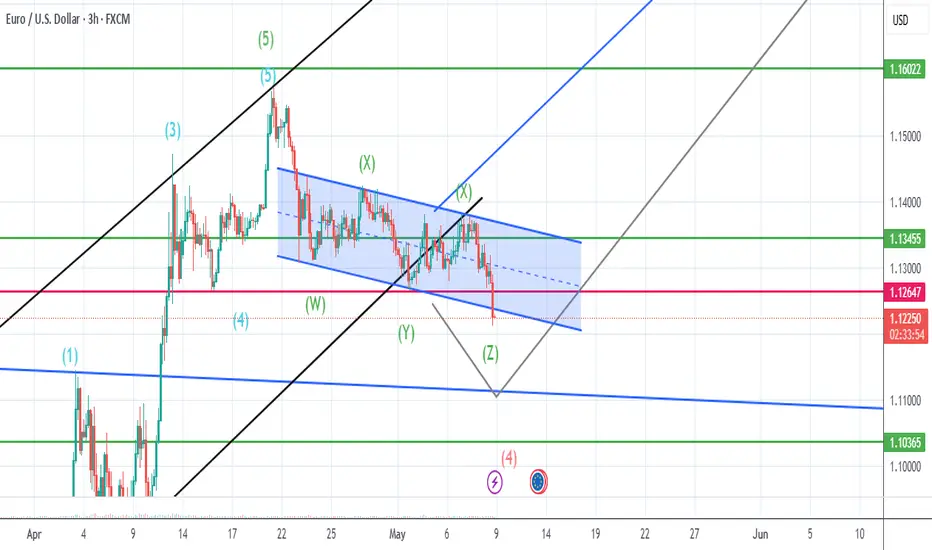
should be going up after correction ends.cant be certain when it comes down to correction waves, it might be here 1.1211 it might go little bit more down around 1.1152 or 1.10 but when it ends it will go for higher than 1.17 also correction wave lenght will give us a better idea where the tp should be so i will keep my first buy position and will add when i am certain when next impulse wave started.
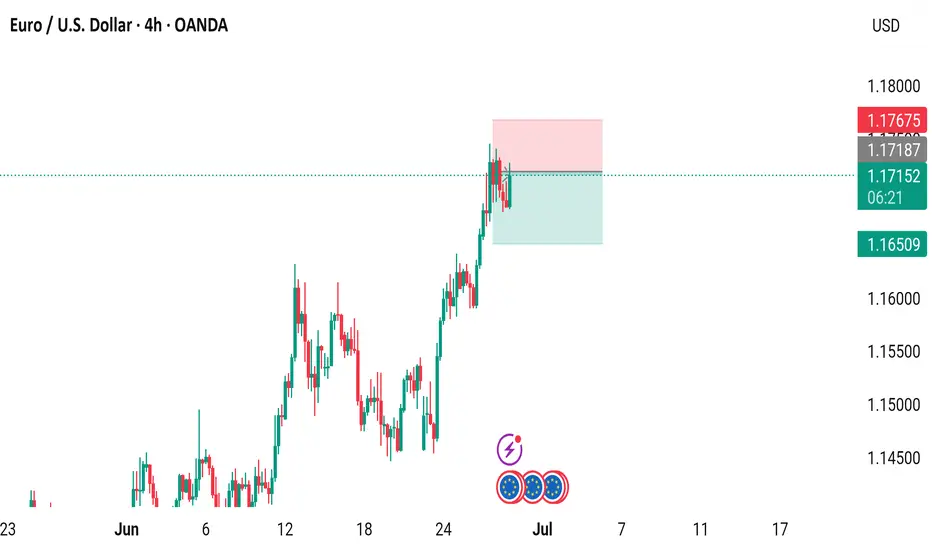
EUR/USD 4-Hour Chart (OANDA)4-hour performance of the Euro/US Dollar (EUR/USD) currency pair, sourced from OANDA. The current exchange rate is 1.17152, reflecting a 0.12% increase (+0.00136). The graph shows a recent upward trend, with a highlighted resistance zone around 1.17187, where the price has approached but not consistently broken through. The timeframe spans from late June to early July 2025, with key price levels marked on the right side ranging from 1.14500 to 1.18000 USD.
EUR/USD - Potential TargetsDear Friends in Trading,
How I see it,
Key Confluence SUPPORT & DEMAND @ 1.16000 area
Potential correction before bullish continuation
"LONG" Targets:
1] 1.17445
2] 1.18700 - MAJOR LIQ. LEVEL
Keynote:
I will not sell the correction; I will wait for bullish confirmation within key support
area on at least 1HR + 4HR timeframes.
Only after a strong breach of support & demand area (1D candle body),
will I consider looking for any short setups.
I sincerely hope my point of view offers a valued insight.
Thank you for taking the time to study my analysis.

EUR/USD RALLY CREATES NEW BUY ZONE!Hey traders so continuing to watch the Euro.
Don't you just love it when a trade plan comes together and everything goes as you expect?
Don't get too excited normally we only get our forecasts right around 50% of the time!
However this one is working out well so far so now where to from here?
The Trend is your Friend until it bends or breaks.
Same plan wait for the pullback or profit taking from this rally when it drops buy again at the trendline. Im not going to say it's always this easy but you don't need indicators to draw a straight line and connect 3 bars.
Trading can be simple or complicated the easier we keep it the better imo.😁
Place stop below trendline or support as US Dollar Continues to weaken this trend should continue to move in our favor.
If Bearish I normally don't recommend counter trend trading because it can be difficult. So unless I see the US Dollar Index Bottom I don't think the trend will have any major changes.
Another thing if you are still long you can enter more positions on this next pullback. That way you can build a larger position in a trending market.
It's like playing the waiting game be patient and eventually she will come to you!
Always use Risk Management!
(Just in we are wrong in our analysis most experts recommend never to risk more than 2% of your account equity on any given trade.)
Good Luck & Hope This Helps Your Trading 😃
Clifford

Cycle Low Confirmed – Strong Upside Move Starting!Here's what I notice:
- Price has **bounced very strongly** from the cycle low.
- You timed it very nicely — the upswing started just as the cycle predicted a bottom.
- If the cycle timing continues, this move could extend for several candles into the next cycle top.
**Summary of the New Setup:**
✔ Cycle low confirmed with bullish breakout
✔ Strong impulsive move off the bottom
✔ Favourable timing for long setups
✔ Potential for multiple days of upside if cycle rhythm holds
This new chart you uploaded looks like it's using cycle analysis — those green semi-circles suggest you're mapping time-based cycles!
Awesome! 😎 Here's the TradingView post draft for your **Cycle Timing** idea:
---
# ⏳ Cycle Low Confirmed – Strong Upside Move Starting!
**Summary:**
Perfect timing off the projected cycle low! Price action has confirmed the cycle theory with a strong bullish breakout. Based on the rhythm of previous cycles, we could see sustained upside momentum into the next cycle peak.
**Setup Details:**
- **Entry:** Current levels (~1.13647) after confirmation of cycle low.
- **Stop-loss:** Below the recent low (~1.09000) to give the trade room to breathe.
- **Target:** Look for strength toward 1.20+ depending on price behavior near mid-cycle.
- **Risk/Reward:** Excellent — trend in favor, supported by cycle timing.
**Technical Factors:**
✅ Cycle Low perfectly aligned with time-based projection
✅ Strong bullish candle closing above recent consolidation
✅ Momentum shift supports continuation higher
✅ Cycle suggests multiple sessions of upside potential
---
**Please LIKE 👍, FOLLOW ✅, SHARE 🙌 and COMMENT ✍ if you enjoy this idea! Also share your ideas and charts in the comments section below! This is the best way to keep it relevant, support us, keep the content here free, and allow the idea to reach as many people as possible.**
---
**⚠️ Disclaimer:** This is *NOT financial advice*. Always do your own research and manage risk properly!

Elliot basic insight Base on the up trend movement, EU actually displaying a basic clear Elliot wave just like the textbook word. With the DAILY Candle closed yesterday, give a reason to enter meanwhile that next movement will be the 5th anticipate, since Elliot is a 12345 waves.
YOU CAN LOOK INTO IT.

EURUSD Soars Beyond 1.17, Eyeing 2021 Highs on DXY DrawdownAs EUR/USD breaks further above the upper boundary of a 17-year descending channel, U.S. dollar dominance over the pair appears to be fading, leaving room for long-term upside potential.
The pair has now reached levels last seen in September 2021 near 1.1750. A decisive close above this level could extend gains toward the 1.20 mark, aligned with the 2021 peaks.
On the downside, a close back below the 1.1570 support may trigger a pullback toward 1.14 and 1.13 before a potential bullish continuation. If that fails, the upper boundary of the former channel could be retested at 1.11 and 1.10.
- Razan Hilal, CMT


Clear enough?we see a long push with displacement on the H1 that leaves behind a confluence between an Order Block and an Imbalance, up above there is an imbalance that also has a cconfluence with the senitive zone represented from the buyside liquidity of the previous range.
I currently want to see price head down there to start searching for an entry.
If anyone has questions feel free to ask.
