EURUSD BuyAsia session had the inducement. As we are entering London session, price should continue upward toward next liquidity point.
EURUSD_TOM trade ideas
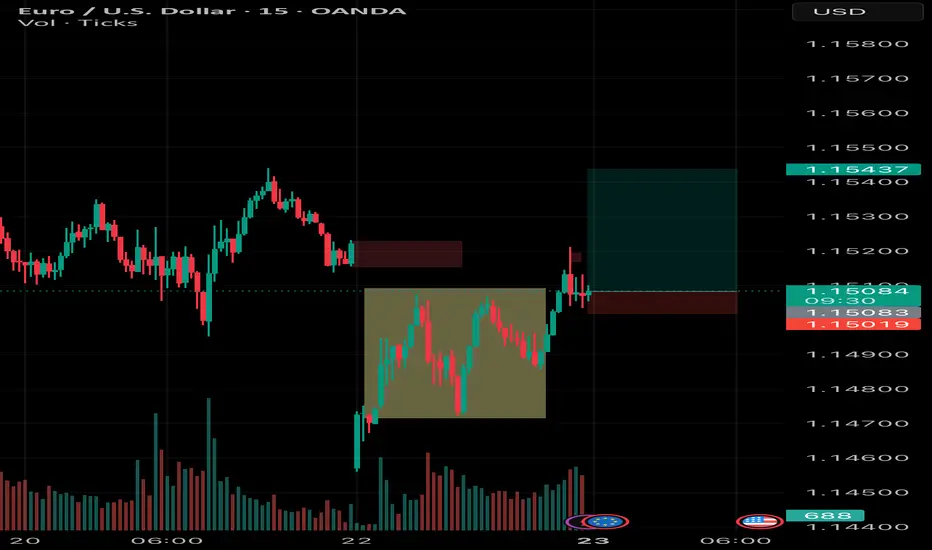
Bearish Continuation I am expecting price to continue lower from this newly formed internal supply zone with the market open gap. When the price first mitigated the daily demand zone it failed to remain bullish. Now sellers are in control of the market so I will be looking to buy only when we have MSS after the sweep of the Low.

Supply Trap Revisit Before Final Drop? | Smart Money Outlook
📉 Price has recently reacted from a strong FVG + Demand + Liquidity Start Zone (4hr) around 1.1450, confirming bullish intent temporarily.
📈 However, a corrective move is now heading into a 4hr Fair Value Gap (FVG) zone near 1.1520–1.1550, which aligns with a potential lower high setup.
Key Zones:
Supply Zone @ 1.1550 (Caution): Watch for rejection signs here—high confluence with previous imbalance.
Bearish Expectation: After liquidity grab or mitigation in FVG, expect a strong sell-off targeting the 1.1410 level (measured move and 1.618 fib extension).
⚠️ Be cautious of price pushing slightly above 1.1550 to sweep liquidity before reversing.

EURUSD Advanced Price Action PatternEURUSD is forming a price action pattern on the 5 minute timeframe, this pattern usually results in a breakout. I am thinking this breakout will be bullish and result in creating a top wick for the daily candle.

EURUSD looking for rejection for continue BearishAs what I see, the price already touch resistance and make minor rejection.
We can stand by for swing sell, if confirmation occur at Daily timeframe.
For now, I will wait for the price at weekly zone.

EURUSD H4 AnalysisEURUSD Showing a bullish Flag. If it breaks this zone above, Most probably can fly up to 1.15818 and higher to 1.16322. If no, Can rally between 1.14320, 1.13067 or even lower. Trading Analysis from 23-06-25 to 27-06-25. Take your risk under control and wait for market to break support or resistance on smaller time frame. Best of luck everyone and happy trading.🤗

EURUSD – Technical Analysis and Long Position OpportunityIn this pair, there is a possibility to open a long position.
When analyzing the pair on higher timeframes, using a 45-period exponential moving average and two simple moving averages of 70 and 95 periods, supported by a Parabolic SAR, an opportunity for a buy position can be identified.
Although the pair is currently consolidating on lower timeframes, it is showing a strong upward movement on the higher timeframes.
This outlook is based on the fact that, in June, a significant bullish candle was formed, followed this month by a doji candle pattern, which could indicate a continuation of the upward trend.
On the higher timeframes, the technical indicators are also aligning in the correct order and direction, suggesting that this may be the right moment to enter a long position.
However, it is important to emphasize that, despite the technical analysis presented, attention should be given to news, economic data, and other factors that could impact this pair, as this analysis relies solely on technical criteria.
The long position tool shown on the chart serves only as additional support for entering the trade.

EURUSD 06/18/25 APre-Analysis
1) Session Break (NY took out L)
2) Expecting? (Trend)
3) High Volume located at (Breach)
4) Leg being traded? (1)
5) Market digestion? (1hr)
6) Edge? (S1) higher TF is (1hr)
7) Edge Specifics? (S1H)
8) Continuation
9) Micro Timeframe 15min)
10) Class (A)

EURUSD POSSIBLE TRADE SETUP💶 Potential Trade Setup on EURUSD
Overview:
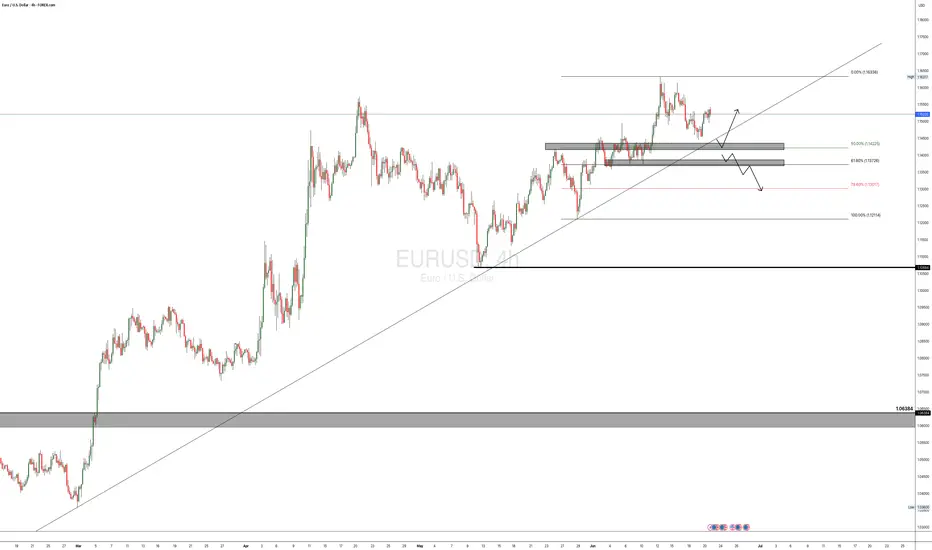
Since March, EURUSD has shown consistent bullish momentum, especially after breaking through the key 1.0600 supply zone.
The pair has maintained higher highs and higher lows, suggesting continued strength in the medium term.
That said, I am still quite anticipating for a possible continuation of the bullish momentum that started a long time ago, and moving forward, I will anticipate for a clear retest of the 50% fib at the 1.1425 region, then I go in for the kill.
Alternatively, there is a clear short opportunity, provided that, the bullish trendline is broken and the 1.1370 region is broken to the downside, this is a bit far a stretch, but it is in play. "IF" the DXY keeps the bullish momentum going.
🧭 Trading Plan:
✅ BUY Bias (Primary Plan):
Look for a retest of the 50% Fibonacci retracement zone around 1.1425. This aligns with the ongoing momentum on the 4H timeframe.
🔻 SELL Bias (Alternative Scenario):
If price breaks the bullish trendline and the 1.1370 support zone, a short opportunity opens up.
This is only valid if DXY continues to strengthen, shifting sentiment.
🎯 Targets & Risk Management: Targeting 1:2 R:R on both setups.
Ensure entries are backed by price action signals and confluences.
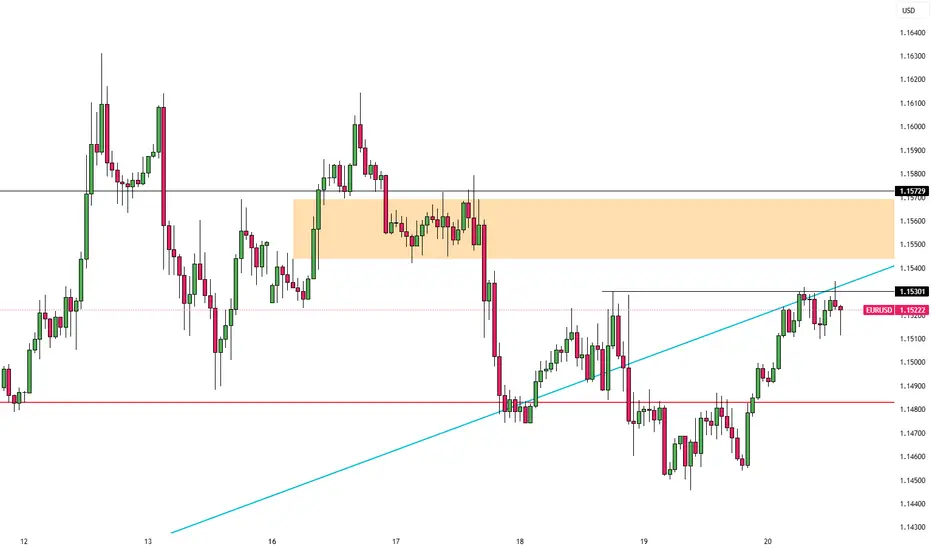
EURUSD to Retest 1.16 regionWatching the 1.1490–1.1450 zone for a potential bullish reaction. This area includes a 4H Fair Value Gap and Order Block. If price gives a 15M CoCH within this range, I’ll look to enter long.
Targets: 1.1540, 1.1570, and 1.1610
Invalidation below 1.1440
Patience until price delivers a clear setup.

EurusdThe market is currently at the minor zone and we should wait for proper break above before we can consider the buying opportunity

Price action Eurusd mad a new lower low signaling a continuation to down side broke structure below after rejection on fair value gap it's currently looking bullish for now

EURUSD is consolidating in upchannel.EURUSD is consolidating in upchannel. It is facing resistance at its previous high and likely to loose its momentum.

NEXT WEEK CHECK EURUSD SIGNAL READ CAPTAINEntry: around 1.15220)1.15125 ✅
Take Profit 1.14950 ✅
Take Profit 2:1.14725 ✅
Last Target:1.14325✅
Stop Loss: 1.15530❌

EURUSD - BreakdownApologies video is a bit rushed.
Wanted to get it done before the weekend arrived.
There's so much more to this video and entry reason that I have left out unintentionally like the fact we swept the Asia lows before creating a BoS. There are also a few other things like I have left out but without looking at the chart right now I cannot remember off the top of my head.
I will post the idea of this trade below so you can see that I was taking it before it played out.
Hope you all have a great weekend and a better trading week than you had this week.
Enjoy
P.S if you have any questions please do message

CHECK EURUSD SIGNAL READ CAPTAIONEntry: around1.15400 1.15350)✅
Take Profit1.15150 ✅
Take Profit 2: 1.14800✅
Last Target:1.14500 ✅
Stop Loss: 1.15700❌

a new pullback before going upa new pullback before going up.
1.14 could be a good spot to place longs

EUR/USD 4H Analysis – Bearish Outlook with Key Levels📉 EUR/USD 4H Analysis – Bearish Outlook with Key Levels 📊
🔍 Overview:
The EUR/USD pair on the 4-hour chart is showing signs of a potential bearish reversal after testing a strong resistance zone near 1.16000. Price action has rejected this area twice (🔴), confirming it as a significant supply zone. The chart now suggests a descending move toward the strong support zone around 1.12000.
🔑 Key Levels:
🟡 Resistance Zone: 1.15700 – 1.16000
Multiple rejections indicate strong selling pressure.
🟦 Mini Support: Around 1.14550
A minor level where price could react short-term, but not a major barrier.
🔻 Mid-Level Target: 1.13653
Potential bounce zone before continuation downward.
🟥 Strong Support Zone: 1.11500 – 1.12200
Previously held as a launch point for a major rally in May; likely to be tested again.
📈 Scenario Outlook:
Bearish Path Expected:
Price is forming a series of lower highs and appears to be losing bullish momentum.
Target Path (Blue Arrows):
A potential drop toward the 1.13653 level is expected, followed by a deeper drop toward the strong support.
Rebound Possibility:
If the strong support holds, we could see a strong bullish bounce 🔄, potentially creating a longer-term buying opportunity.
💡 Conclusion:
EUR/USD is currently in a correction phase. Traders should watch for a confirmed break below 1.14550 for bearish continuation 📉. A drop to the 1.12000 zone may offer a high-probability reversal setup 📊📍.
🔔 Trading Tip:
Use caution around mini support; aggressive sellers may enter on any weak bounce. Wait for confirmation before entering positions. 🧠📉

EURUSD Under Pressure! SELL!
My dear friends,
Please, find my technical outlook for EURUSD below:
The price is coiling around a solid key level - 1.1508
Bias - Bearish
Technical Indicators: Pivot Points Low anticipates a potential price reversal.
Super trend shows a clear sell, giving a perfect indicators' convergence.
Goal - 1.1488
About Used Indicators:
The pivot point itself is simply the average of the high, low and closing prices from the previous trading day.
Disclosure: I am part of Trade Nation's Influencer program and receive a monthly fee for using their TradingView charts in my analysis.
———————————
WISH YOU ALL LUCK

EUR/USD Approaching Key Resistance – Will Bulls Break Through?EUR/USD continues to trade within a strong uptrend, respecting the 50-day SMA while pressing against a key horizontal resistance level around 1.1576. The pair has recently pulled back modestly after testing this level but remains above the short-term moving average, suggesting buyers are still in control.
Technicals provide a mixed, but slightly bullish picture:
Trend Structure: Price action shows a series of higher highs and higher lows since mid-February, confirming a bullish trend.
Moving Averages: The 50-day SMA is above the 200-day SMA (golden cross), and price continues to close above both, reinforcing the bullish bias.
MACD: While flattening, it remains in positive territory – momentum is cooling but not reversing.
RSI: Currently near 59, suggesting bullish momentum without overbought conditions – a healthy zone for a potential continuation higher.
A breakout above the 1.1576 resistance could open the path toward the 78.6% Fibonacci retracement level near 1.1745. However, failure to clear this barrier may invite consolidation or a minor pullback toward the 50-day SMA.
Traders should watch for a daily close above 1.1576 or a bounce from the 50-day SMA to confirm the next directional move.
-MW

EURUSD is moving within the 1.14000 - 1.16330 range👀 Possible scenario:
The euro inched up near 1.1500 on June 19, supported by safe-haven flows as Israel-Iran tensions deepened and fears of U.S. involvement grew. Despite slight euro strength, demand for the U.S. dollar remained firm following the Fed’s decision to hold rates and warn of near-term inflation risks driven by Trump’s tariffs. The Fed also forecast slower growth and reaffirmed expectations for two rate cuts in 2025.
Markets now await U.S. data for further rate clues, while attention stays on the Middle East as Trump reportedly issued Iran a final ultimatum to avoid conflict.
✅ Support and Resistance Levels
Now, the support level is located at 1.14000
Resistance level is located at 1.16330

EUR/USD Slips as Fed Stays HawkishEUR/USD hovered near 1.1520 during Friday’s Asian session, extending gains for a third day as the US dollar weakened, likely due to a technical pullback. However, the greenback may rebound as safe-haven demand grows amid rising tensions between the US and Iran.
Citing senior US intelligence, The New York Times reported that Iran hasn’t yet decided to pursue nuclear weapons, despite having enriched uranium reserves. Meanwhile, the Senate Intelligence Committee Chair said President Trump is set to offer Iran one final window to negotiate before considering military action, potentially delaying any decisions for up to two weeks.
Markets are also awaiting Friday’s Monetary Policy Report from the Federal Reserve, which will provide fresh insights into the Fed’s stance. On the Euro side, the ECB’s hawkish outlook offered additional support, with President Christine Lagarde suggesting rate cuts may soon end as the central bank remains “well positioned” to handle persistent risks.
Resistance is located at 1.1530, while support is seen at 1.1450
Long trade
📍 Pair: EURUSD
📅 Date: Tuesday, June 17, 2025
🕒 Time: 3:00 PM (NY Session PM)
⏱ Time Frame: 1 Hour
📈 Direction: Buyside
📊 Trade Breakdown:
Entry Price 1.14816
Profit Level 1.15696 (+0.77%)
Stop Loss 1.14640 (−0.15%)
Risk-Reward
Ratio 5:1
🧠 Context / Trade Notes:
1H Structure Entry:
Trade initiated at a key bullish order block on the 1hr timeframe, following higher-timeframe trend alignment.
