EUR/USD Short Idea Analysis EUR/USD exhibits bearish potential on the daily timeframe, with the 1.17160–1.18070 zone acting as a key resistance area for a short setup.
Technical Analysis:
Price Action: Price is testing the 1.17160–1.18070 resistance zone, which aligns with prior highs and a rejection area. A bearish reversal pattern (e.g., shooting star or engulfing) could confirm the short.
Support/Target: Initial support at 1.1600, with a deeper target at 1.1500 if selling pressure accelerates.
Indicators: RSI is nearing overbought levels (above 65), suggesting a potential reversal. MACD shows weakening bullish momentum, supporting a bearish bias.
Fibonacci: The 1.17160–1.18070 zone aligns with the 78.6% Fibonacci retracement of the prior downmove, reinforcing resistance.
Risks: A break above 1.1820 could invalidate the setup. Watch for ECB policy updates or unexpected US data shifts.
Conclusion: The 1.17160–1.18070 resistance zone offers a compelling short opportunity for EUR/USD, backed by technical and fundamental factors. Use tight risk management due to potential volatility.
EURUSD_TOM trade ideas

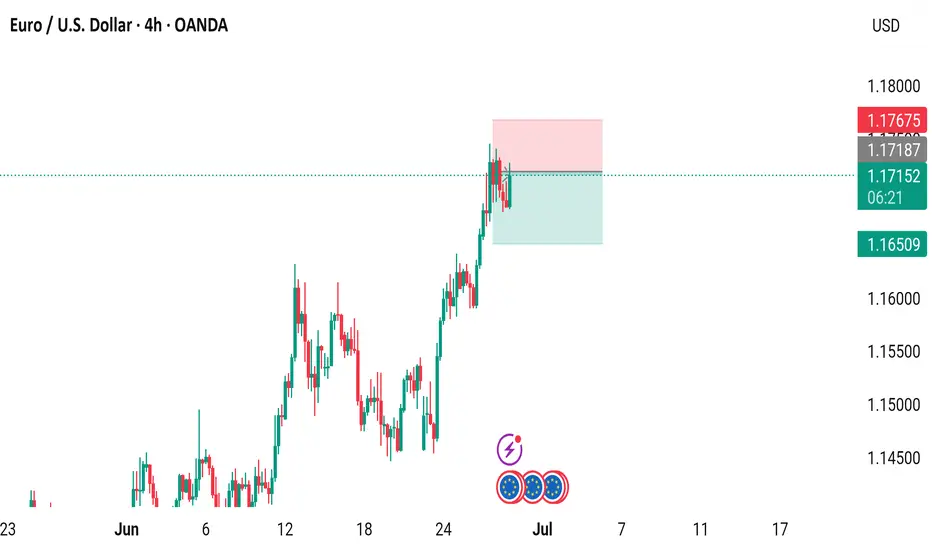
EUR/USD 4-Hour Chart (OANDA)4-hour performance of the Euro/US Dollar (EUR/USD) currency pair, sourced from OANDA. The current exchange rate is 1.17152, reflecting a 0.12% increase (+0.00136). The graph shows a recent upward trend, with a highlighted resistance zone around 1.17187, where the price has approached but not consistently broken through. The timeframe spans from late June to early July 2025, with key price levels marked on the right side ranging from 1.14500 to 1.18000 USD.

CHECK EURUSD SIGNAL READ CAPTAINsell Setup)
Entry Zone: Around 1.17200 \1.17150
Stop Loss: 1.17400
Take Profits:
TP1: ~1.17000
TP2: ~1.16750
Final Target: 1.16550

Eurusd Reaching physiological level of 1.17200 clear break and retest on the 2hr and 1hr , entering a counter trade to 1.16190

The Day Ahead Friday, June 27 – Market Focus
A packed session lies ahead with key inflation, growth, and sentiment data releases from major global economies, alongside speeches from central bank officials that could shape rate expectations.
United States:
Markets will closely watch the May PCE inflation report—the Fed’s preferred gauge of inflation—alongside personal income and spending figures. A cooler-than-expected core PCE could fuel speculation of rate cuts later this year. Also on tap: Kansas City Fed's June services activity, providing a regional pulse on service-sector momentum.
China:
May industrial profits will offer further clarity on the pace of China's manufacturing rebound, with implications for commodity-linked assets and Asian market sentiment.
Japan:
A comprehensive data dump includes June Tokyo CPI—a key inflation proxy—alongside the May jobless rate, job-to-applicant ratio, and retail sales. These will be crucial for BOJ watchers amid ongoing policy normalization debates.
Europe:
France releases a triple dose of data—June CPI, May PPI, and consumer spending—while Italy publishes June consumer and business sentiment figures, plus May PPI and April industrial sales. At the Eurozone level, June economic confidence will help assess regional momentum amid ECB’s dovish pivot.
Canada:
The spotlight is on April GDP, with the economy's performance key to shaping BOC rate expectations. A weak print could cement the case for further easing.
Central Banks:
Speeches by Fed’s Williams, Hammack, and Cook, along with ECB’s Rehn, may provide clues on future policy paths, especially if they comment on recent inflation data or labor market dynamics.
This communication is for informational purposes only and should not be viewed as any form of recommendation as to a particular course of action or as investment advice. It is not intended as an offer or solicitation for the purchase or sale of any financial instrument or as an official confirmation of any transaction. Opinions, estimates and assumptions expressed herein are made as of the date of this communication and are subject to change without notice. This communication has been prepared based upon information, including market prices, data and other information, believed to be reliable; however, Trade Nation does not warrant its completeness or accuracy. All market prices and market data contained in or attached to this communication are indicative and subject to change without notice.

EUR/USD - Potential TargetsDear Friends in Trading,
How I see it,
Key Confluence SUPPORT & DEMAND @ 1.16000 area
Potential correction before bullish continuation
"LONG" Targets:
1] 1.17445
2] 1.18700 - MAJOR LIQ. LEVEL
Keynote:
I will not sell the correction; I will wait for bullish confirmation within key support
area on at least 1HR + 4HR timeframes.
Only after a strong breach of support & demand area (1D candle body),
will I consider looking for any short setups.
I sincerely hope my point of view offers a valued insight.
Thank you for taking the time to study my analysis.

EURUSD BuyExternal structure is bullish and the continuation structure failed to make the high. Price came lower and during Asia session it took out the low(inducement) and mitigated an Order Block. Price taking out the internal low that failed to create the higher high is the fuel to push upward. we need to wait and see how Frankfurt and London open play out. It is Friday so I'm not going to be surprised if it does some weird moves.

Profit TakingYesterday, EURUSD continued its bullish move and reached 1,1747.
Currently, we focus more on reducing risk and taking profits rather than entering new positions.
We’re approaching the final days of the quarter, and next week brings key economic events.
New entries will be considered only if a favorable risk-reward setup presents itself.
The next resistance remains at 1,1778!

EURUSD Elliott Wave Update: Upward Momentum ResumesThe EURUSD Elliott Wave sequence initiated from the September 2022 low reveals an incomplete bullish structure, signaling potential for further upside. A short-term rally from the May 29, 2025 low is currently unfolding as a five-wave impulse. As depicted in the 1-hour chart below, wave ((i)) peaked at 1.16319. A corrective wave ((ii)) followed which concluded at 1.14435. The internal structure of wave ((ii)) formed a zigzag pattern, with wave (a) declining to 1.1486 and wave (b) rebounding to 1.1614. Wave (c) completed the correction at 1.144, finalizing wave ((ii)) in the higher degree.
The pair has resumed its ascent in wave ((iii)), exhibiting an impulsive internal subdivision. From the wave ((ii)) low, wave i advanced to 1.1544, followed by a minor dip in wave ii to 1.1451. Wave iii surged to 1.1641, with a subsequent wave iv pullback ending at 1.1587. The final leg, wave v, culminated at 1.1745, completing wave (i) in the higher degree. A corrective wave (ii) pullback, likely a three-wave zigzag, appears to have concluded at 1.1678. However, a break above the wave (i) high at 1.1745 is required to negate the possibility of a double correction lower. Given the shallow nature of the wave (ii) pullback, the risk of a deeper correction remains. However, as long as the pivotal low at 1.144 holds, dips should attract buyers in 3, 7, or 11 swings, supporting further upside momentum.


EUR/USD Rally Continues – 1.18000 in SightHi Everyone,
As outlined in our analysis last week, we anticipated a continued move higher toward the 1.16564 and 1.18325 levels, provided price held above 1.14483.
Price respected this level, and EUR/USD extended its rally, reaching our first key target at 1.16564 and pushing above 1.17400 — marking the highest level since February 2022.
A successful bounce from above 1.16680 or slightly lower at 1.15998 would offer near-term support for a potential retest of the 1.17400 zone. A confirmed break above this resistance could pave the way for a move toward 1.18000, where we anticipate encountering dynamic resistance.
We will provide further updates on the projected path for EUR/USD should price reach this level.
The longer-term outlook remains bullish, with expectations for the rally to extend toward the 1.2000 level, provided the price holds above the key support at 1.10649.
We will continue to update you throughout the week with how we’re managing our active ideas and positions. Thanks again for all the likes/boosts, comments and follows — we appreciate the support!
All the best for a good end to the week. Trade safe.
BluetonaFX


POTENTIAL EURUSD SHORT OPPORTUNITY...POSITION TRADEHello hello TradingView family! Hope you guys are doing amazingly well! Just wanted to come on here and make another post for a potential longer term opportunity I am seeing on the major currency pair EURUSD. So put your seat belts on and let's dive in!!
OK so I'm going to keep this very very simple. Not because I don't want to go in depth but because my trading is very simple and I'm just going to give it to you straight. So here are the points
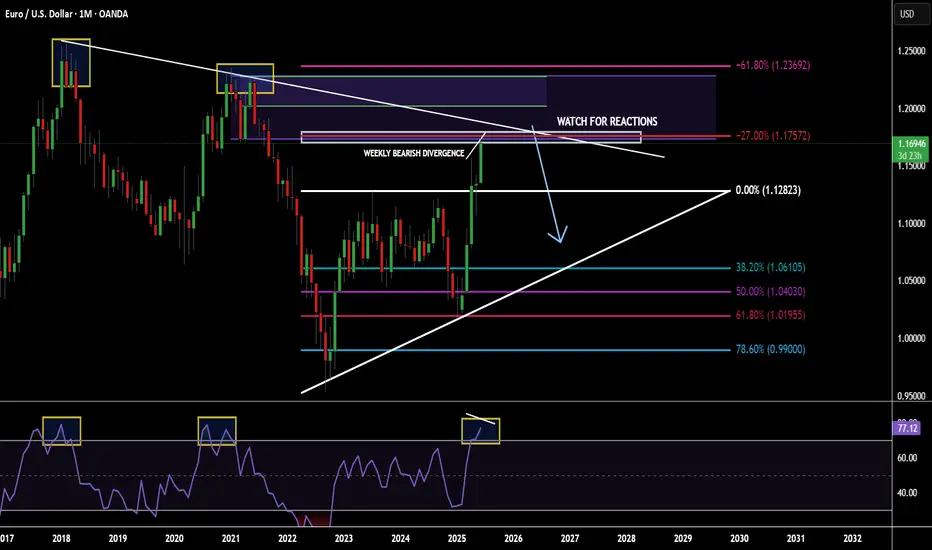
1. Price is @ monthly supply
2. Price has made new highs & sitting at a monthly fib extension
3. Monthly RSI overbought conditions
4. Weekly has bearish divergence forming
5. Weekly/Daily buyer is slowing down
Make sense? If not..then I know you will figure it out. Watch for price to potentially poke a little higher but nice confluences for a fall in price. Appreciate you all!
EURUSD - perfect Gartley Pattern?Technical Analysis - no fundamentals taken into account.
EURUSD proce has just completed a perfect Gartley Pattern. If respected, proce will come down to 1.23748 at least. Potentially lower.

EURUSD - Potential buying opportunityLooking at EURUSD
We are still very bullish with no sign of it slowing.
I am aware of a potential weekly liquidity point to the left, however, until EURUSD shows its hand it's important that we still remain bullish.
We have set up a lovely liquidity point before a lovely demand area.
So I will be setting a pending order at the demand area after the New York close and the Asian session begins.

EUR/USD Biases (Long, Short, and Today’s View)EUR/USD Trading Biases: Navigating Bullish Momentum and Key Resistance Zones
This will be a concise market analysis essay (around 600–700 words) suitable for a financial audience, such as forex traders or analysts. Let me begin:
EUR/USD Trading Biases: Navigating Bullish Momentum and Key Resistance Zones
The EUR/USD pair, one of the most actively traded currency pairs in the forex market, has exhibited strong bullish momentum in recent sessions. As of June 26, 2025, the euro’s ascent against the dollar has brought it to a critical juncture, testing significant technical and psychological resistance levels. Traders are now weighing the potential for continued upside against growing signals of exhaustion and looming fundamental catalysts.
Bullish Outlook: A Technically Supported Advance
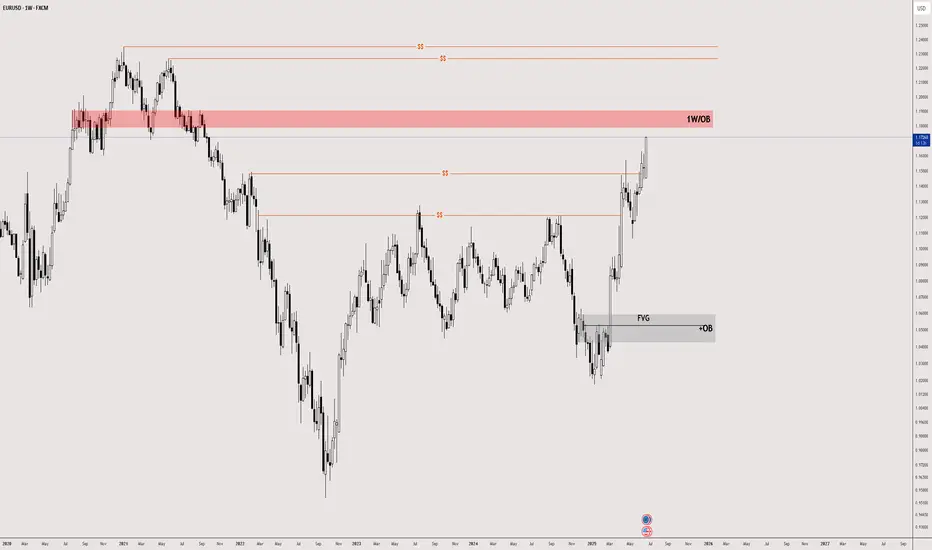
From a technical perspective, the bullish case for EUR/USD remains compelling. The pair is entrenched in a sustained uptrend, marked by successive breakouts above prior resistance levels and validated by daily and weekly closes above 1.1600. The current price action is converging on a crucial supply zone located between 1.1700 and 1.1900—an area historically known for triggering reversals but also pivotal in confirming trend continuation if broken convincingly.
Technical indicators further bolster the bullish narrative. The Relative Strength Index (RSI), while approaching overbought territory, is still supportive of higher prices. The Moving Average Convergence Divergence (MACD) displays a widening bullish histogram, and the Average Directional Index (ADX) confirms trend strength. Near-term resistance lies between 1.1680 and 1.1730, with potential for an extension to 1.1800 should the pair breach this upper band.
On the fundamental front, improved German Ifo business sentiment data has injected optimism into the eurozone outlook. Additionally, easing geopolitical tensions and a broader risk-on sentiment in global markets have undercut the dollar's safe-haven appeal. Speculation over potential Federal Reserve rate cuts further dampens dollar strength, creating tailwinds for EUR/USD.
Bearish Considerations: Resistance and Reversal Risks
Despite the encouraging trend, caution is warranted. The area between 1.1700 and 1.1900 represents a major weekly order block (OB) resistance—territory where several past rallies have lost steam. Oscillators such as the Commodity Channel Index (CCI) and RSI are showing signs of overextension, and the market is now vigilant for reversal patterns or signs of exhaustion.
Fundamentally, while the recent Ifo data is encouraging, it remains below the key threshold of 100, reflecting lingering skepticism about the eurozone's full recovery. Moreover, upcoming U.S. economic releases, particularly GDP figures and jobless claims, could act as potential catalysts for a dollar rebound. Hawkish commentary from Federal Reserve officials could also tilt sentiment, especially if it dampens expectations of rate cuts.
If EUR/USD fails to hold above the 1.1700–1.1730 resistance zone, a corrective move toward 1.1530–1.1500 becomes plausible. Deeper pullbacks could extend toward 1.1470 and 1.1390, especially if risk sentiment reverses or economic data surprises in favor of the dollar.
Today’s View: Bullish with a Note of Caution
For today, June 26, the prevailing bias remains bullish, yet increasingly cautious. The pair is testing the lower end of the 1.1700 OB zone. A decisive break and hold above this level would likely unleash further upside toward 1.1730 and 1.1800. However, overbought conditions and proximity to a known resistance zone suggest that traders should remain alert to potential rejection.
Intraday strategies favor buying on dips above 1.1600–1.1635, with stops placed just below 1.1600 and targets set at 1.1700–1.1730. Conversely, short positions should only be considered if there is a clear rejection from the 1.1700–1.1730 area, with downside targets at 1.1530–1.1500 and stops above 1.1800.
Conclusion
The EUR/USD is currently at a pivotal inflection point. While the bullish trend is intact and supported by both technical and fundamental factors, the proximity to a major resistance zone introduces a layer of complexity. Traders must remain agile—ready to ride a breakout higher if confirmed, but equally prepared to pivot if the pair falters and signals a reversal. In markets like these, timing and confirmation are everything.
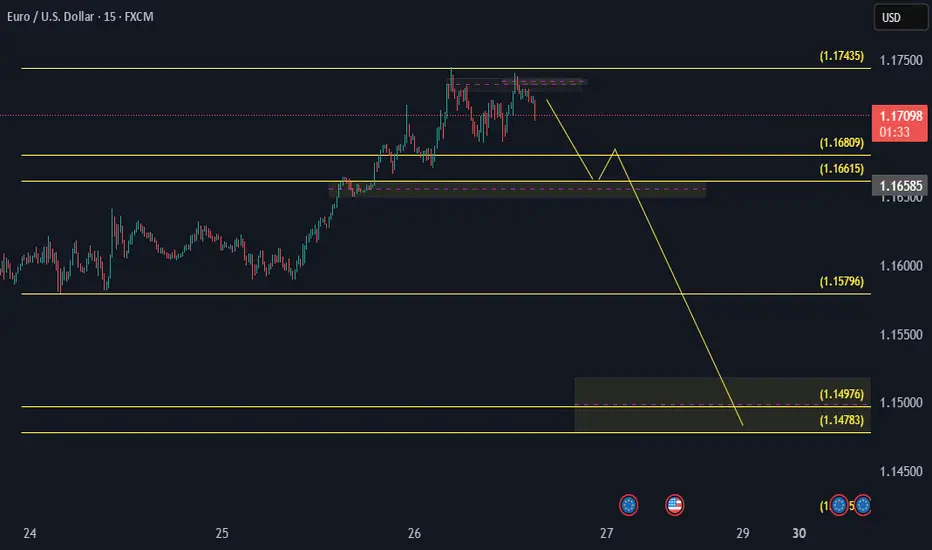
EURUSD @ MAJOR SUPPLY ZONE, IS IT TIME FOR SELLERS TO TAKE OVERIn this 15m chart we have MAJOR SUPPLY AREA around 1.1723
SMALL TIME FRAME we can see heavily been REJECTED @ this SUPPLY AREA & now we kinda form DOUBLE TOP FORMATION (keep in mind DOUBLE TOP not Valid till we BREAK NECK around 1.169)
My plan to take this in once we BREAK DOUBLE TOP NECK LINE AND RETESTED, OR EVEN BETTER GO IN AFTER UP WARD TREND BROKEN
Still i have my eye on 1.113 but as usual will close some along the way
I will update once im in
Thanks

EURUSD SHORT TIME O LOSS TIMEI opened a long position on the EURUSD pair at 1.17195 with 10 lots.
Target: 1.174 – If the target is reached, I will take profit and open a short position.
At the same time, expecting USD weakness, I also opened a short position at 1.17200 with 20 lots.
1.168 to 1.166 is a strong support zone.
If price reaches 1.174 and I have an active short, I will close the 1.17200 short and keep the other one.
Targets and support levels are marked on the chart – I plan to close the positions gradually.
I will close 75% of the position at the 1.149 support level.
This is a demo account – I’m practicing in order to qualify for a funded trading account.
Depending on my success rate, I plan to start trading live on Forex.
EURUSD POSSIBLE FINAL STAGE FOR BULL AND BEAR TAKING OVERIn this 15m chart we have MAJOR WEEKLY/DAILY RESISTANCE SUPPORT area around 1.1653
I wait to see if we close below that and get out of this UP-WARD CHANEL
If all this mate i will take sell below 1.1642 and Main target will be 1.113 but as usual will close some along the way
I will update once im in
Thanks

EURUSD Pull BAck - Long term Target 1.200Looking for the pull to prior day lows. Long term target for EURUSD 1.200.

EUR/USD | Bullish SMC SETUP EUR/USD | 15min | Bullish SMC Setup 🚀💶
Price swept Asian session lows into a higher timeframe demand zone, followed by a strong bullish BOS (Break of Structure). We’re now anticipating a pullback into the FVG (Fair Value Gap) + LQC (liquidated candle) and demand zone for potential continuation to the upside.
The entry idea is based on:
🔹 Liquidity Grab (sell-side sweep)
🔹 BOS confirmation
🔹 FVG + Demand confluence
🔹 Expecting bullish continuation toward previous high and premium zone.
Waiting for price to tap the zone before riding the wave up! 📈
You can wait for confirmation on 5min TF after tap into POI
Let’s see if it delivers.
#SMC #EURUSD #Liquidity #SmartMoney #FXTradingClub #OrderFlow #Sam_trades_smc

Market next move
🔁 Disruption of the Current Analysis
1. False Breakout Scenario
The chart assumes a bullish move breaking resistance before a bearish reversal.
Disruption: This could be a false breakout, where the price appears to break above resistance but lacks strong volume and momentum. Traders get trapped long, and the price quickly reverses below resistance, invalidating the bullish leg entirely.
2. Stronger Uptrend Continuation
Despite calling for a bearish target, the overall trend appears strong with higher highs and higher lows.
Disruption: Instead of a retracement, EUR/USD could break through the resistance zone convincingly, possibly reaching 1.1750–1.1800, supported by:
Increasing volume
Bullish candles closing above resistance
No signs of bearish divergence on RSI/MACD (if added)
3. Fundamental Factors
The chart ignores macro data.
Disruption: If upcoming EU economic data is stronger than expected, or if US data disappoints, the euro could strengthen further.
Upcoming events with the euro and US flags suggest possible volatility.
4. Volume Contradiction
Recent bullish candles are supported by strong volume, suggesting accumulation.
Disruption: If smart money is accumulating positions, this would support further bullish continuation, not reversal.
