EURUSD Last push before correction.The EURUSD pair made a new High by breaking above the 1.15725 Resistance and is extending the rally since the January 13 2025 Low. That Low was the Higher Low of the multi-year Channel Up, so the current uptrend is technically its latest Bullish Leg.
The first Bullish Leg of that pattern peaked after a +15.75% rise. We expect a similar peak for the current rally, thus targeting 1.17750, before a new pull-back below the 1D MA50 (blue trend-line).
-------------------------------------------------------------------------------
** Please LIKE 👍, FOLLOW ✅, SHARE 🙌 and COMMENT ✍ if you enjoy this idea! Also share your ideas and charts in the comments section below! This is best way to keep it relevant, support us, keep the content here free and allow the idea to reach as many people as possible. **
-------------------------------------------------------------------------------
Disclosure: I am part of Trade Nation's Influencer program and receive a monthly fee for using their TradingView charts in my analysis.
💸💸💸💸💸💸
👇 👇 👇 👇 👇 👇
EURUSD_TOM trade ideas

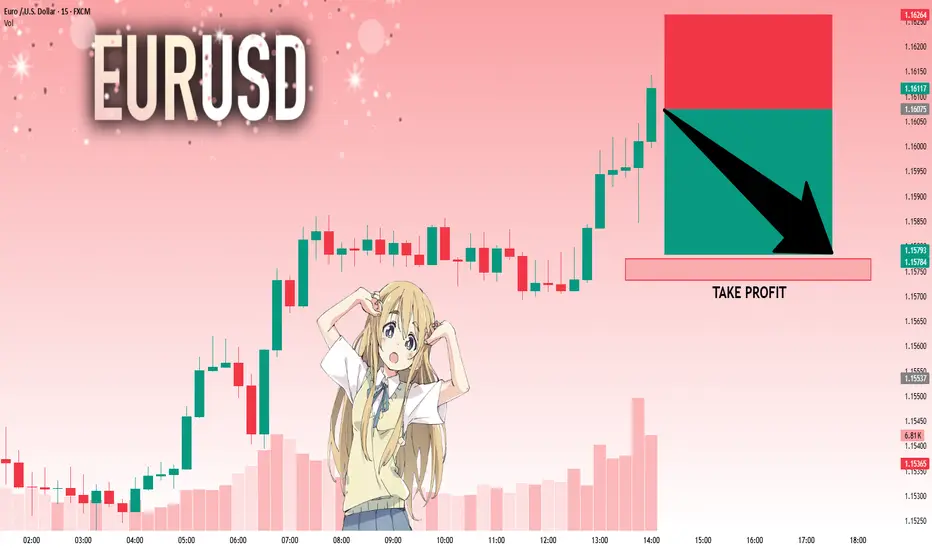
EURUSD IdeaHere we are waiting for the price to come to our supply zone at 1.16117-1.16344 from where we may enter sell according to the required market structure form .
i will provide the confirmation in thegroup before i place my order .
Please follow to support me !

EUR/USD 2-Hour Chart Analysis2-hour candlestick analysis of the Euro/US Dollar (EUR/USD) pair, with a recent uptrend from a low of 1.15244 to 1.15816 (+0.26%). A breakout above the resistance level is highlighted, suggesting potential bullish momentum.

10 ARX Lessons for Precision in Trading📘 10 ARX Lessons for Precision in Trading
A reminder that trading isn’t about prediction it’s about execution.
Structure, timing, and mindset create consistency.
Which one of these lessons do you need to hear today?

EURUSD at Key Resistance – Bull Trap or Breakout Incoming?The Euro has rallied into a major supply zone at 1.15800+, a level that hasn’t been broken since mid-2023. As price trades within this supply range, traders are eyeing either a strong breakout or a potential rejection back toward demand.
🟦 Key Supply Zone: 1.14994 – 1.16100
🟧 Major Demand Zones:
• 1.09023 (mid-range)
• 1.02903 (long-term support & prior consolidation base)
⚖️ Current Outlook:
• EURUSD is showing strength, but bullish momentum is slowing at resistance.
• A rejection candle from here could signal downside toward 1.0900 and even 1.0290.
• Break and close above 1.16100 on the daily would confirm bullish continuation toward untested zones.
🗓️ Marked Date: January 29, 2025 – Previous structure shift & start of bullish wave
💡 Watch Closely:
Price behavior around the current supply zone will determine direction for weeks ahead. Risk/reward now favors patient traders — wait for confirmation!
🧠 Chart Tools:
LuxAlgo Supply & Demand Visible Range
Timeframe: Daily (1D)
🚨 Potential Scenarios:
🔺 Breakout = Target 1.1800+
🔻 Rejection = Drop toward 1.0900 – 1.0300
👇 What’s your bias here? Are the bulls done or just getting started?
#EURUSD #ForexSignals #LuxAlgo #SupplyAndDemand #PriceAction #ForexStrategy #BreakoutOrRejection #FrankFx #TradingViewAnalysis #SmartMoneyTraders

Opportunity for selling EURUSDI see that EURUSD has confirmed strong resistance, so I took a sell trade with it.

What I expect on EURUSDI expect a bounce around this level then back down to this support line at the minimum

Long trade
🟢 EURUSD – Buyside Trade
Date: Monday, 16th June 2025
Session: London Session AM
Time: 5:00 AM
Entry Timeframe: 1Hr TF
Trade Parameters
Entry: 1.15748
Take Profit: 1.16144 (+0.34%)
Stop Loss: 1.15581 (−0.15%)
Risk-Reward Ratio (RR): 2.29
🧠 Trade Reasoning
This buyside trade was executed after price swept the sell-side high from Monday, 21st April 2025, triggering liquidity above the previous swing, and then sharply rejecting back into structure. The reaction occurred above a 1Hr Fair Value Gap (FVG), indicative of a directional bias.

EUR/USD Forms Inside Day at Key ResistanceWith the greenback under pressure, we take a look at EUR/USD, which has just formed an inside day pattern at key resistance. As both macro headwinds and high-impact data loom, the next breakout or fakeout could set the tone for the week ahead.
Dollar under pressure ahead of high-stakes week
The dollar is reeling after Donald Trump reignited global trade tensions, pushing the currency to its weakest level in three years. His comments about reintroducing reciprocal tariffs within weeks have triggered a sharp decline in the greenback, which fell over 0.8% against a basket of major peers. Alongside this, geopolitical jitters over Iran and reports that the US may reassess its Aukus defence pact have further dampened sentiment, with traders increasingly questioning the strength of America’s international alliances.
The weakening in the dollar has been exacerbated by weaker-than-expected inflation, which has encouraged market participants to bet more heavily on interest rate cuts from the Fed later this year. Futures now price in two quarter-point cuts, undermining the dollar’s yield advantage. Meanwhile, the euro has found support from signs that the ECB may be nearing the end of its cutting cycle, adding relative strength to the single currency. All eyes now turn to Tuesday’s US industrial production figures, followed by EU inflation data and the Fed’s interest rate decision on Wednesday, as traders look for fresh direction.
Compression at resistance: All eyes on Thursday’s range
Last week’s rally saw EUR/USD push into a key level, with price retesting resistance created by the April highs. Although the pair briefly broke through on Thursday with a close above the level, Friday’s session was far more cautious. Price action stayed entirely within Thursday’s range, forming an inside day pattern that now acts as a pressure point for the next directional move.
This setup reflects a temporary standoff between bullish momentum and longer-term resistance. Inside days often precede breakouts, but they can also lure in traders only to reverse violently. The key now lies in how price reacts to the boundaries of Thursday’s range. A close above it, particularly on strong volume, would be a clear signal of continuation and likely invite further buying. A close below it on strong volume would mark a failed breakout and open the door to a short setup.
For those trading this setup, Thursday’s high and low now form essential levels. Not only do they serve as breakout triggers, but they also offer logical zones for stop placement. In short, the market is coiled, the fundamentals are volatile, and price is poised.
EUR/USD Daily Candle Chart
Past performance is not a reliable indicator of future results
EUR/USD Hourly Candle Chart
Past performance is not a reliable indicator of future results
Disclaimer: This is for information and learning purposes only. The information provided does not constitute investment advice nor take into account the individual financial circumstances or objectives of any investor. Any information that may be provided relating to past performance is not a reliable indicator of future results or performance. Social media channels are not relevant for UK residents.
Spread bets and CFDs are complex instruments and come with a high risk of losing money rapidly due to leverage. 85.24% of retail investor accounts lose money when trading spread bets and CFDs with this provider. You should consider whether you understand how spread bets and CFDs work and whether you can afford to take the high risk of losing your money.

Breaking: Euro's Momentum Could Trigger $1.19 Surge
Current Price: $1.1546
Direction: LONG
Targets:
- T1 = $1.1700
- T2 = $1.1900
Stop Levels:
- S1 = $1.1400
- S2 = $1.1300
**Wisdom of Professional Traders:**
This analysis synthesizes insights from thousands of professional traders and market experts, leveraging collective intelligence to identify high-probability trade setups. The wisdom of crowds principle suggests that aggregated market perspectives from experienced professionals often outperform individual forecasts, reducing cognitive biases and highlighting consensus opportunities in Euro trading.
**Key Insights:**
The Euro has shown strong resilience despite a challenging macroeconomic environment. The European Central Bank (ECB)'s signaling of a more neutral stance regarding rate hikes has bolstered confidence in the currency. Furthermore, economic challenges within the Eurozone—such as weaker industrial output and shrinking trade surpluses—present medium-term hurdles but align with structural optimism for strategic positions in EUR/USD. Traders are closely watching key support levels as bullish momentum begins to gain traction.
The weakening U.S. dollar, alongside dovish Federal Reserve messaging, plays into Euro strength on the back of favorable interest rate differentials. Additionally, geopolitical factors such as stability concerns surrounding emerging market economies have directed investor interest toward safer currencies like the Euro.
**Recent Performance:**
Over the past week, EUR/USD has hovered around $1.1546 with limited volatility, reflecting strong support levels amidst subdued trading activity. Despite facing negative economic data on industrial production (-2.6% m/m) and trade surplus contraction (€30B to €10B), the pair continues to indicate upside potential fueled by positive speculative sentiment and ECB policy interpretation. Seasonal trends suggest historical Euro strength in mid-year trading windows.
**Expert Analysis:**
Forex analysts widely express bullish sentiment on EUR/USD, supported by ECB communication and diminishing macroeconomic risks. Several technical setups are aligning with long-term resistance breaks near $1.17, with momentum indicators signaling high buying interest. Many see pullback opportunities to nearby support levels ($1.1400 - $1.1300) as high-value entry points for future gains.
On the technical front, the MACD shows a bullish crossover while the RSI remains in moderate territory, suggesting room for potential upside moves without overbuy signals. The Euro's price action momentum also suggests increased trading volume near critical levels, indicating strengthening trend formation.
**News Impact:**
Upcoming ECB speeches, coupled with Eurozone CPI releases, could solidify expectations on inflation and monetary positioning—factors likely to increase Euro demand. Additionally, tariff announcements targeting electric vehicle imports and other related trade dynamics are projected to strengthen Euro-backed industry sentiment. Recent repatriation of global investment capital into Euro-dominated equities adds to structural Forex tailwinds.
**Trading Recommendation:**
Traders should consider taking a bullish stance on the Euro, supported by strong technical indicators and positive macro factors. Entry near current price levels offers favorable risk-reward metrics, with stop-loss placements below $1.1400 providing downside protection. Elevated resistance levels at $1.1700 and $1.1900 manifest as achievable targets in the short- to medium-term horizon, with sustained caution on event-driven volatility.

Testing Upper Channel Line || Eyes on 1.16 and Previous High📌 EURUSD 4H – Testing Upper Channel | Eyes on 1.1600-1.1666
🕓 June 12, 2025
👤 By: MJTrading
🔍 Technical Overview:
EURUSD continues its upward trajectory within a clean ascending channel, respecting both dynamic structure and EMA support zones. We're now retesting a key confluence area:
==============================================================
🔻 Bearish Setup Idea:
Entry Zone: 1.1570–1.1600
Stop Loss: Above 1.16666 (round number & psychological resistance)
Target: Channel midline (~1.1450) or lower band (~1.1380)
🧠 Why This Zone Matters:
🔺 Previous Swing Highs: Price is revisiting the April peak zone (~1.1570)
🧱 Round Number Confluence: 1.1600 & 1.1666
📉 Rising Channel Resistance: Upper boundary hit after extended leg
🔄 Potential Mean Reversion: EMAs are lagging behind price
⚠️ Invalidation:
A clean break and close above 1.1700 with follow-through may invalidate short bias and signal continuation toward 1.1800+
💬 Patience is power. Let the levels do the talking.
📎 #EURUSD #ForexAnalysis #TechnicalTrading #SmartMoney #PriceAction #RoundNumberLevels #MJTRADING

EURUSD(20250616) Today's AnalysisMarket news:
Trump: The United States may still intervene in the Iran-Israel conflict. If Iran launches an attack on the United States, the United States will "fight back with all its strength on an unprecedented scale." Iran and Israel should reach an agreement.
Technical analysis:
Today's buying and selling boundaries:
1.1550
Support and resistance levels:
1.1674
1.1628
1.1598
1.1502
1.1472
1.1426
Trading strategy:
If the price breaks through 1.1550, consider buying, and the first target price is 1.1598
If the price breaks through 1.1502, consider selling, and the first target price is 1.1472

EURUSd a big move down
📉 EUR/USD Analysis | 2H Timeframe
Wave 5 in play! 🚨
Structure shift confirmed with BOS at key supply zone. Expecting liquidity sweep and a bearish reversal 📉
🧠 Smart Money + Elliott Wave Combo:
🔹 BOS at Wave 3 ✅
🔹 Wave 4 retracement held
🔹 Anticipating Wave 5 top-out and reversal
🔹 Targeting major demand zones (blue lines)
🔻 Potential Sell Setup Loading…
📆 Monday, 16 June | 2H Chart
🔍 PEPPERSTONE: EUR/USD
💬 Drop your thoughts below or DM “WAVE” to learn this strategy!
—
🔖 #eurusd #forexanalysis #elliottwave #smartmoneyconcepts #forextrader #fxsignals #technicalanalysis

EURUSD: The Market Is Looking Down! Short!
My dear friends,
Today we will analyse EURUSD together☺️
The market is at an inflection zone and price has now reached an area around 1.16075 where previous reversals or breakouts have occurred.And a price reaction that we are seeing on multiple timeframes here could signal the next move down so we can enter on confirmation, and target the next key level of 1.15775..Stop-loss is recommended beyond the inflection zone.
❤️Sending you lots of Love and Hugs❤️
EUR/USD 1-Hour Chart Analysis1-hour candlestick chart for the Euro/US Dollar (EUR/USD) currency pair, sourced from OANDA. The chart highlights a recent price movement with a current value of 1.15510, reflecting a 0.29% decrease (-0.00340). Key price levels are marked, including resistance at 1.16142 and support at 1.14418, with shaded areas indicating potential trading zones. The chart includes a bullish logo and branding from "ALEEGOLDTRADER," suggesting a trading analysis perspective.

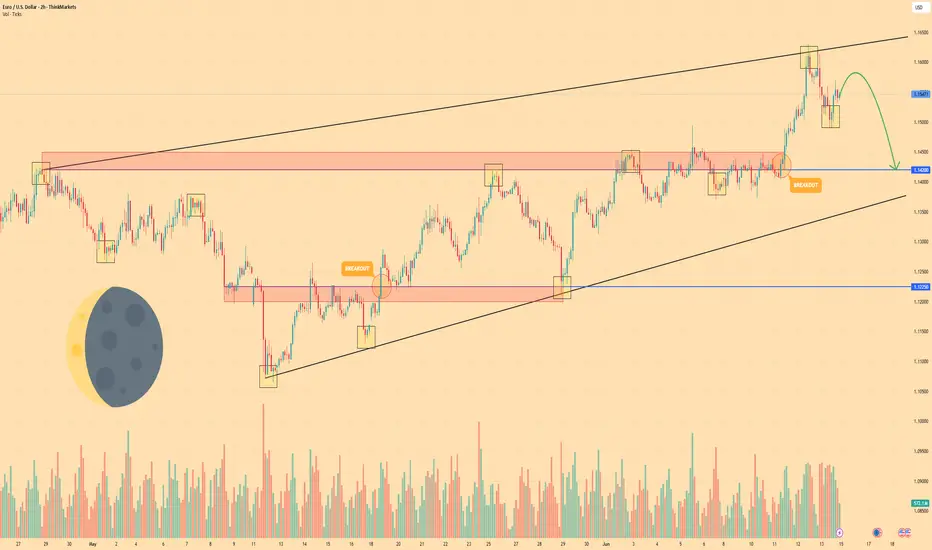
EURO - Pirce can make movement up and then drop to $1.1420Hi guys, this is my overview for EURUSD, feel free to check it and write your feedback in comments👊
After entering the wedge, Euro began to slow down, creating a tightening structure between support and resistance.
Price corrected toward the support line of the wedge, where it briefly paused and bounced with weak momentum.
The bounce triggered a breakout above local resistance, but buyers failed to hold the price at higher levels.
Soon after, the market reversed from the wedge’s upper boundary and began forming a bearish rejection pattern.
Now price trades just below the recent highs, showing fading demand and early signs of short-term reversal.
I expect Euro to move lower and reach the $1.1420 support level — my current target in this scenario.
If this post is useful to you, you can support me with like/boost and advice in comments❤️
Disclaimer: As part of ThinkMarkets’ Influencer Program, I am sponsored to share and publish their charts in my analysis.
EURUSD 1H. for 50 pips! :)Hello dear traders, this is EURUSD with Nika.
I want to share you this idea, with buy on limit perspective.
We may see this previous and current pattern are strong in connection.
So that's my opinion, about how we may receive some price movement.
It's good trading idea only in low budget. :)
Thank you!

EURUSD Is Bullish! Long!
Here is our detailed technical review for EURUSD.
Time Frame: 3h
Current Trend: Bullish
Sentiment: Oversold (based on 7-period RSI)
Forecast: Bullish
The market is trading around a solid horizontal structure 1.157.
The above observations make me that the market will inevitably achieve 1.165 level.
P.S
Please, note that an oversold/overbought condition can last for a long time, and therefore being oversold/overbought doesn't mean a price rally will come soon, or at all.
Disclosure: I am part of Trade Nation's Influencer program and receive a monthly fee for using their TradingView charts in my analysis.
Like and subscribe and comment my ideas if you enjoy them!

EURUSD is moving within the 1.14865 - 1.16330 range👀 Possible scenario:
The euro fell 0.28% on June 13, snapping a four-day winning streak against the U.S. dollar as investors turned to safe-haven assets amid rising Middle East tensions. Despite the pullback, the euro remains on track for a second straight weekly gain, supported by eurozone resilience and shifting U.S. rate expectations. Uncertainty over U.S. trade policy also pressured the dollar. President Trump’s tariff threats rattled markets, though Treasury Secretary Bessent hinted at a possible extension of the current moratorium.
Softer-than-expected U.S. inflation data added to dollar weakness, reinforcing bets on Fed rate cuts. With no key data on June 16, the EUR/USD is likely to stay range-bound. Watch support at 1.14865 and resistance at 1.16330.
✅Support and Resistance Levels
Now, the support level is located at 1.14865
Resistance level is located at 1.16330

Eurusd The eurusd has reached a premium level so now it’s selling. After purging minor liquidity in LTF.

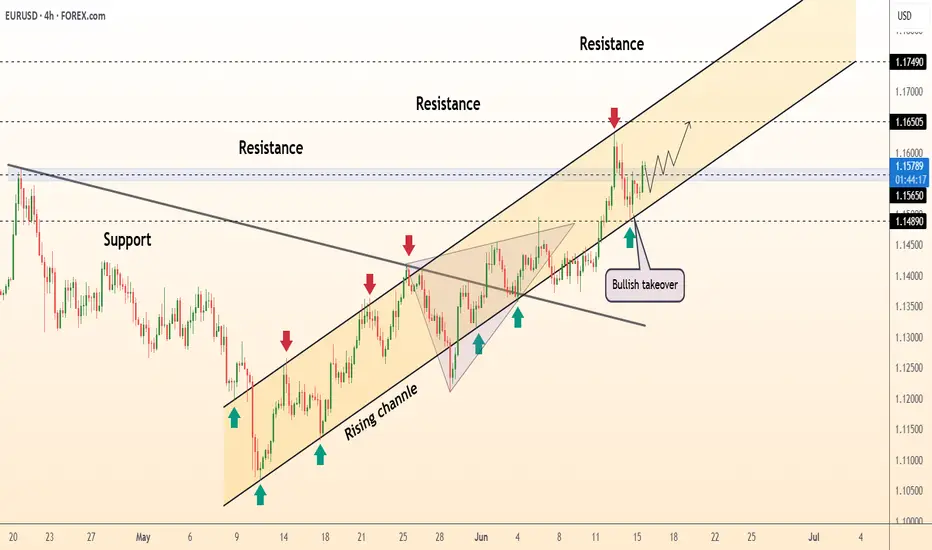
DeGRAM | EURUSD fixed above the lower boundary of the channel📊 Technical Analysis
● Euro keeps stair-stepping along the inner trend-line of the 2-month rising channel; each dip to the line (green arrows) is met with higher lows, confirming firm demand around 1.1485-1.1500.
● Friday’s break back above the former wedge cap turned 1.1550 into support; clearing the last swing high at 1.1605 would expose the channel median / fib cluster at 1.1650, with the upper rail near 1.1745 as an extension.
💡 Fundamental Analysis
● Softer US retail-sales and a slump in NY Fed manufacturing pulled Treasury 2-yr yields under 4.70 %, while ECB speakers warned that further cuts “are not a given,” narrowing the rate gap and reviving euro bids.
✨ Summary
Long 1.1520-1.1560; hold above 1.1550 targets 1.1650 ➜ 1.1745. Bias void on an H4 close below 1.1480.
-------------------
Share your opinion in the comments and support the idea with like. Thanks for your support!
$EURUSD Analysis | Bearish Confluences in PlayPEPPERSTONE:EURUSD
The Fiber is currently testing multiple technical barriers, including the golden Fibonacci zone, channel resistance , and bearish harmonic patterns. A lower-degree double top has led to a potential bearish 2618 setup, suggesting short-term downside risk.
📉 Fractal Structure Zones
🔸 Daily fractal resistance (short-term): 1.1631
🔸 Weekly fractal resistance (mid-term): 1.1573
🔸 Intraday resistance (4H): 1.1569
🔸 Intraday support (4H): 1.1523
🔸 Daily fractal support: 1.1371
🔸 Monthly fractal resistance (long-term): 1.1213
🔸 Weekly fractal support: 1.1065
🔸 Monthly fractal support: 1.0177
A rejection below intraday support may validate the bearish setup, while a sustained break above daily resistance would question the harmonic scenario.
Happy Trading,
André Cardoso

I'm selling EURUSD!If you're given an opportunity to sell with small stop loss for a huge gain, will you taken it?
That is what I'm offering now, even if you have different bias, even if you think I'm wrong, just bet on me, just never this trade and I'm sure you wont regret it.
Enjoy
