Trading Recommendations and Analysis for EUR/USDOn the weekly chart, the price is approaching the upper boundary of the price channel, around the 1.1822 mark, from which a reversal of the entire trend may occur.
A divergence with the Marlin oscillator is ready for immediate formation. If the price breaks above the channel line, it will most likely be a false false breakout, invalidating the channel. Only a weekly candle close above the specified level, accompanied by the oscillator rising above the previous peak, would significantly complicate the technical picture for a trend reversal.
On the daily chart, a possible target in the event of a breakout above 1.1822 is the 1.1905 level - the resistance from 1.1822 is the 1.1905 level - the resistance from July - August 2021. On the four - hour chart, the Marlin oscillator does not support the price's bullish momentum.
For now, the trend remains upward, but we are preparing for a possible shift. The Nonfarm Payrolls, Independence Day, and "Liberation Day" (new tariffs) are just around the corner. Donald Trump may have a surprise in store.
EURUSD_TOM trade ideas

Market Re-Cap and Outlook for NEXT WEEKHere I am giving you a little insight as to what trades I am currently in, taken & looking to take for the week just gone and the week coming.
1 Winning trade on EU
1 Current open position on EU
EURGPB - Breakdown
AUDUSD - Breakdown
NZDUSD - Breakdown
Gold - Breakdown
If there are any pairs you would like me to share my feedback on give me a message and I will be happy to try and do so.
Thanks
Happy Hunting

RSI Flashes Warning on EURUSD: Critical Level Under Watch!Good morning traders,
If the EURUSD pair breaks below the 1.16729 level due to an RSI divergence, the next potential target could be around 1.16093.
Keep in mind that a break below 1.16729 may also signal a potential trend reversal.
I've marked the pivot points for you on the chart for better clarity.
Additionally, it's crucial to keep an eye on current economic data and news releases as part of your fundamental analysis.
I meticulously prepare these analyses for you, and I sincerely appreciate your support through likes. Every like from you is my biggest motivation to continue sharing my analyses.
I’m truly grateful for each of you—love to all my followers💙💙💙

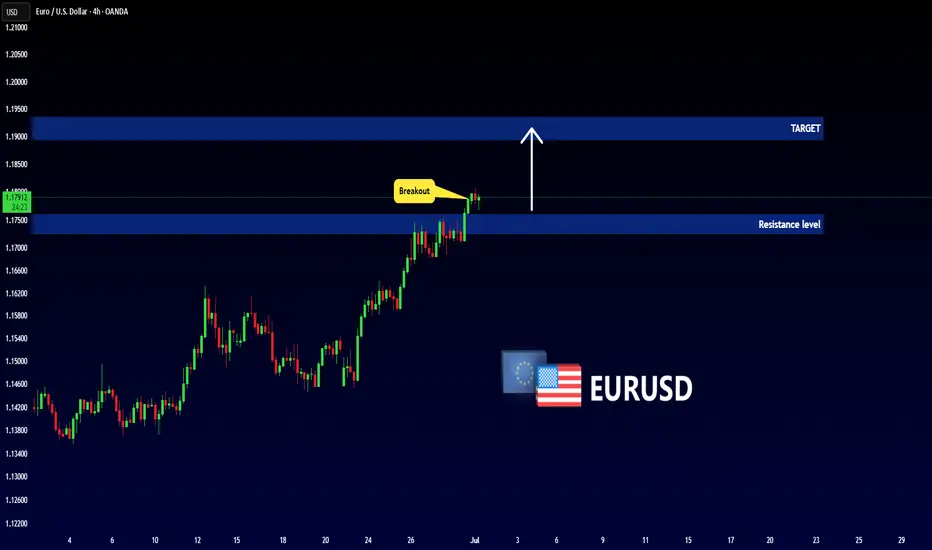
EURUSD - Important Breakout !Hello Traders !
The EURUSD price broke the resistance level (1.17255 - 1.17602).
This key level becomes new support!
So, I expect a bullish move🚀
________________
TARGET: 1.18950🎯
EURUSD: Pullback From Resistance Confirmed📉 The EURUSD could retreat from the highlighted resistance today.
I've identified a cup and handle pattern following a test of significant intraday resistance and a breach of its neckline, accompanied by strong bearish momentum.
Target - 1.1575.

Eurusd Reaching physiological level of 1.17200 clear break and retest on the 2hr and 1hr , entering a counter trade to 1.16190

EUR/USD Short Idea Analysis EUR/USD exhibits bearish potential on the daily timeframe, with the 1.17160–1.18070 zone acting as a key resistance area for a short setup.
Technical Analysis:
Price Action: Price is testing the 1.17160–1.18070 resistance zone, which aligns with prior highs and a rejection area. A bearish reversal pattern (e.g., shooting star or engulfing) could confirm the short.
Support/Target: Initial support at 1.1600, with a deeper target at 1.1500 if selling pressure accelerates.
Indicators: RSI is nearing overbought levels (above 65), suggesting a potential reversal. MACD shows weakening bullish momentum, supporting a bearish bias.
Fibonacci: The 1.17160–1.18070 zone aligns with the 78.6% Fibonacci retracement of the prior downmove, reinforcing resistance.
Risks: A break above 1.1820 could invalidate the setup. Watch for ECB policy updates or unexpected US data shifts.
Conclusion: The 1.17160–1.18070 resistance zone offers a compelling short opportunity for EUR/USD, backed by technical and fundamental factors. Use tight risk management due to potential volatility.

EURO - Price can continue to decline inside wedge patternHi guys, this is my overview for EURUSD, feel free to check it and write your feedback in comments👊
Some days ago, price tried to grow, but failed and dropped below $1.1220 support level, after which started to grow in channel.
In rising channel, price broke $1.1220 level one more time and then rose to resistance line and then corrected.
Next, Euro rose to $1.1455 level and some time traded inside this level, until it broke it and continued to move up.
Price exited from rising channel and later started to decline inside wedge pattern, where it declined to $1.1455 level.
Recently, price bounced from this level and in a short time rose to resistance line of wedge pattern.
In my mind, Euro can continue to decline to $1.1400 support line of wedge, breaking support level.
If this post is useful to you, you can support me with like/boost and advice in comments❤️
Disclaimer: As part of ThinkMarkets’ Influencer Program, I am sponsored to share and publish their charts in my analysis.

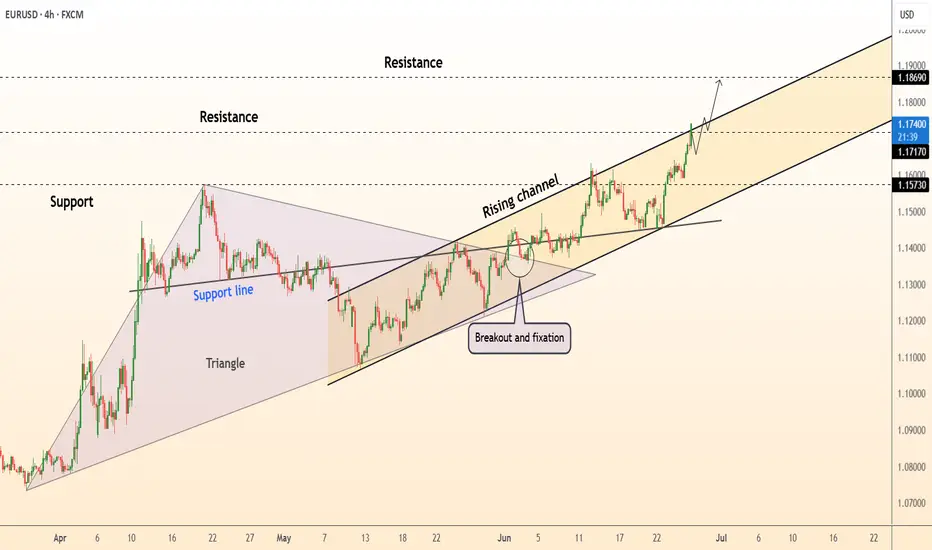
EUR/USD Holds Above Support – Watching 1.17400 and BeyondHi Everyone,
As highlighted, a successful bounce from the near-term support at 1.16680 provided a retest of the 1.17400 zone. Looking ahead, we expect price action to revisit this level in the coming week.
A confirmed break above this resistance could open the path toward 1.18000, where we anticipate encountering dynamic resistance.
As outlined in our analysis last week, we anticipated a continued move higher toward the 1.16564 and 1.18325 levels, provided price held above 1.14483.
Price respected this level, and EUR/USD extended its rally, reaching our first key target at 1.16564 and pushing above 1.17400 — marking the highest level since February 2022.
We will provide further updates on the projected path for EUR/USD should price reach this level.
The longer-term outlook remains bullish, with expectations for the rally to extend toward the 1.2000 level, provided the price holds above the key support at 1.10649.
We will continue to update you throughout the week with how we’re managing our active ideas and positions. Thanks again for all the likes/boosts, comments and follows — we appreciate the support!
All the best for a good end to the week. Trade safe.
BluetonaFX

Elliott Wave Analysis for EUR/USD - Bullish OutlookPEPPERSTONE:EURUSD
This analysis is based on the application of Elliott Wave principles for the EUR/USD market on a weekly timeframe.
💡 Wave Identification:
Corrective Cycle (ABC): After a peak marked by wave B, the market completed a 5-wave downward structure (waves 1 to 5), forming wave C, signaling a possible end of the correction.
Potential Reversal Zone (2/B): The current point is a strategic level where a bullish rebound is anticipated.
📊 Projection:
A bullish impulse is expected from point C. The initial target lies in the 1.1140 - 1.1217 zone, corresponding to key resistance levels and Fibonacci projections.
🧠 Conclusion:
A breakout above 1.0440 could confirm a significant bullish impulse, suggesting buyers are regaining control.
⚠️ Disclaimer : This analysis is not financial advice. Always conduct your own research before investing.

EURUSD..BUYAnalysis complete — scenarios outlined. The zone could be a decision point for . Price reaction here may define the next move.
If price breaks and pulls back to retest, a reversal setup might emerge.

EurUsd Scenario.This how i see eurusd for now .. Indeed Dxy is going Uppp !! While E/U is heading down .
I will see how it goes .
Hapii Trade'ing

EURUSD: Next Move Is Down! Short!
My dear friends,
Today we will analyse EURUSD together☺️
The in-trend continuation seems likely as the current long-term trend appears to be strong, and price is holding below a key level of 1.17021 So a bearish continuation seems plausible, targeting the next low. We should enter on confirmation, and place a stop-loss beyond the recent swing level.
❤️Sending you lots of Love and Hugs❤️

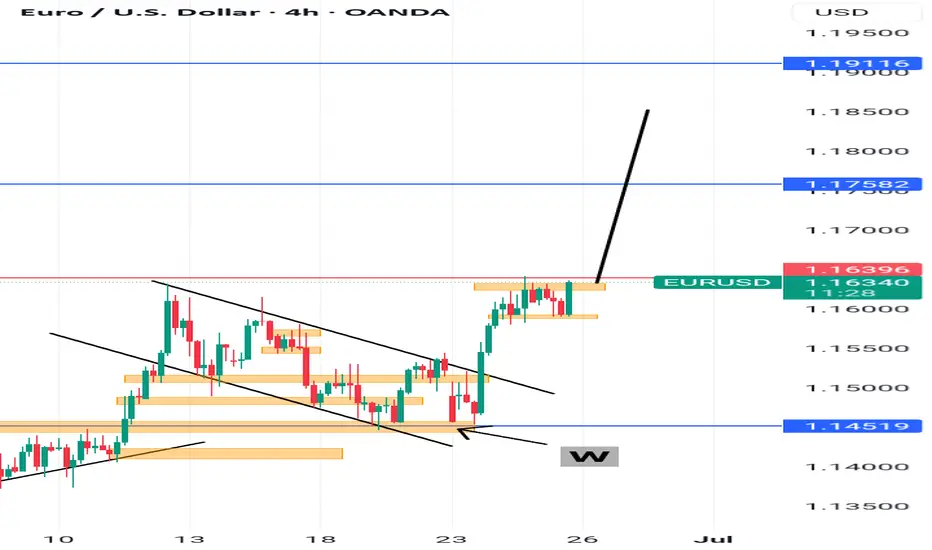
DeGRAM | EURUSD will continue to grow rapidly📊 Technical Analysis
● Euro keeps hugging the upper rail of the 3-month rising channel after re-testing the broken April triangle top as support, confirming fresh trend acceleration.
● Momentum is unbroken – every 4 h pullback since 17 Jun has held above the inner trend-line (now 1.1717); measured channel height points to the next fib / horizontal cluster at 1.1869.
💡 Fundamental Analysis
● Softer US durable-goods orders and slowing housing data cooled 2-yr yields, while ECB speakers signalled no rush to ease again; the short-rate gap narrowed for a third session, underpinning EUR strength.
✨ Summary
Buy dips ≥1.1717; upside targets 1.1800 then 1.1869. Bull view void on a 4 h close below 1.1600.
-------------------
Share your opinion in the comments and support the idea with a like. Thanks for your support
EURUSD SHORT TERM SELLOn the M15 price has given a CHOCH
Waiting patiently for a BOS to occur to ride price down to demand.
Proper risk management is advised
Keep an eye on TVC:DXY
Happy trading week.

EUR_USD BULLISH BREAKOUT|LONG|
✅EUR_USD is going up
Now and the pair made a bullish
Breakout of the key horizontal
Level of 1.1630 and the breakout
Is confirmed so we are bullish
Biased and we will be expecting
A further bullish move up
LONG🚀
✅Like and subscribe to never miss a new idea!✅
Disclosure: I am part of Trade Nation's Influencer program and receive a monthly fee for using their TradingView charts in my analysis.

EURUSDShorting EUR/USD means you expect the euro to weaken against the U.S. dollar. In other words, you believe the dollar will gain strength or the euro will lose value — or both.
Reasons traders might short EUR/USD:
• The U.S. economy is performing better than the eurozone.
• Interest rates are rising faster in the U.S. than in Europe.
• Political or economic instability in the eurozone.
• Investors seeking safety in the dollar during global uncertainty.
How it works:
You sell the pair (EUR/USD) first, aiming to buy it back later at a lower price — profiting from the drop in the euro’s value versus the dollar.


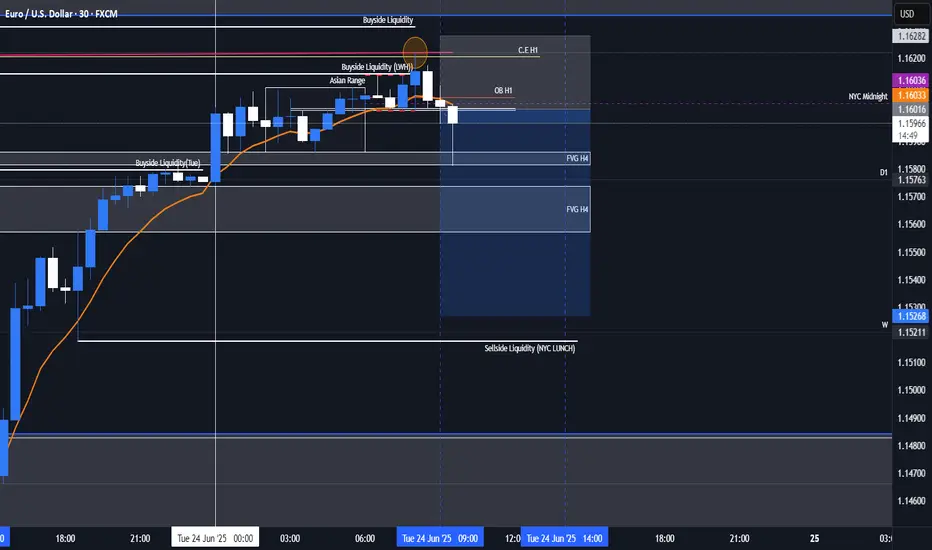
EURUSD Intra-day ShortEURUSD is in a long-term pivot to go short but the market is still in a accumulation phase of collecting orders and so we are still not in the position yet to commit to longer targets. We are looking at short term draw on liquidity like yesterday's NYC session and are accounting for a possible accumulation there after to the upside potentially.
Can it Reach New Highs as USD Weakens?EUR/USD: Euro's Resilience Holds Strong – Can it Reach New Highs as USD Weakens?
🌍 Macro Landscape: EUR/USD Rides Risk-On Sentiment and Fed Cut Hopes
The Euro (EUR) is showing significant strength, maintaining its position near a three-year high against the US Dollar (USD). This resilience is largely fueled by a moderately positive risk appetite in the market.
Simultaneously, the US Dollar is facing considerable downward pressure. This weakness stems from recent weaker-than-expected economic data from the United States and increasing market expectations for the Federal Reserve (Fed) to implement interest rate cuts. If US economic indicators continue to soften, it could solidify the case for earlier Fed rate cuts, further undermining the USD and potentially boosting EUR/USD.
🏦 Central Bank Policy: Diverging Paths for ECB and Fed
Federal Reserve (Fed): The market is increasingly pricing in the likelihood of Fed interest rate cuts. Weaker US data strengthens this narrative, as the Fed might be compelled to ease monetary policy to support economic growth. This dovish outlook for the Fed is a key driver of USD weakness.
European Central Bank (ECB): While the provided information focuses on the EUR's strength due to broader market sentiment and USD weakness, the ECB's more measured approach to monetary policy compared to the Fed's potential easing can create a favorable interest rate differential for the Euro, attracting capital flows.
This divergence in central bank policy expectations—with the Fed leaning towards cuts and the ECB maintaining a more cautious stance—creates a tailwind for the EUR/USD pair.
🌐 Capital Flows: Money Favors Euro Amidst USD Softness
Global capital flow models suggest that funds are increasingly moving towards assets perceived as offering better relative value or stability. As US yields become less attractive due to anticipated Fed rate cuts, capital may flow out of USD-denominated assets.
This outflow from the USD naturally benefits currencies like the Euro, especially given its current positive momentum driven by a moderate risk-on environment. The re-pricing of Fed policy risk directly influences these capital movements, contributing to the upward trajectory of EUR/USD.
📊 Technical Structure (H4 Chart Analysis): EUR/USD Eyes Key Resistance Levels
Based on the provided EUR/USD H4 chart:
Uptrend intact: The pair continues to exhibit a positive trend, characterized by higher lows and higher highs within an ascending channel.
Key Resistance Levels:
Initial Resistance: 1.16330. This level aligns with recent highs and the top of the minor channel. A break above this suggests further bullish momentum.
Major Resistance Zone: 1.17031. This is indicated as a significant resistance area, potentially a long-term target or a reversal point. A break here would confirm strong bullish conviction.
Key Support Levels:
Immediate Support: 1.15470. This level has acted as a support point, aligning with the EMA 200 and a Fibonacci retracement level, indicating a potential bounce area.
Strong Support Zone: 1.15249. This zone represents a robust demand area, aligning with previous price action and serving as a crucial level for bulls to defend.
Moving Averages (EMA 13-34-89-200): The price is trading above the short-term and long-term EMAs, suggesting strong bullish momentum. The EMAs are fanning out and showing a bullish alignment, reinforcing the uptrend.
Projected Price Action: The chart suggests that the price might retrace towards the 1.15470 or 1.15249 support zones before resuming its upward trajectory towards the 1.16330 and potentially 1.17031 resistance levels.
🎯 Trade Strategy Recommendations:
Scenario 1 – BUY the Dip:
Entry: Look for bullish confirmation around 1.15470 - 1.15249.
Stop-Loss: Below 1.15100 (or a level below the 1.15249 support for risk management).
Take-Profit:
TP1: 1.15600
TP2: 1.15800
TP3: 1.16000
TP4: 1.16200
TP5: 1.16330 (Targeting the immediate resistance)
TP6: 1.16500
TP7: 1.16800
TP8: 1.17031 (Targeting the major resistance)
Scenario 2 – SELL the Rally (Counter-trend/Reversal):
Entry: Look for bearish confirmation around 1.16330 - 1.16400 or higher near 1.17031.
Stop-Loss: Above 1.16500 (or above 1.17100 if selling at higher resistance).
Take-Profit:
TP1: 1.16200
TP2: 1.16000
TP3: 1.15800
TP4: 1.15600
TP5: 1.15470 (Targeting the immediate support)
TP6: 1.15249 (Targeting the strong support zone)
⚠️ Key Events to Watch:
Upcoming US Economic Data: Any further weak data could solidify Fed rate cut expectations and weigh on the USD.
ECB Official Statements: Comments from ECB members on inflation or monetary policy could impact EUR's strength.
Global Risk Sentiment: A continued moderate risk-on environment will generally support the EUR against the USD.
Trade smart and stay informed! Wishing everyone a successful trading day!
EURUSD Jun 26 The information and publications are not meant to be, and do not constitute, financial, investment, trading, or other types of advice or recommendations.
Have a nice day ahead.


Bullish moveEurusd had a consolidation phase or a bullish flag and there is already a breakout to the upside.
You can be aggressive and enter or wait for a retest and then enter