EUR/USD retracement line and go longHigh volumes before the start of a fair value gap at 1.1438 area. When price approaches I shall short and reverse into a long as the level is hit.
EURUSD_TOM trade ideas

EURUSD | Bearish Below 1.1530, Break Above 1.1559 Turns BullishEURUSD | Overview
The pair is trading under bearish pressure due to rising geopolitical tensions.
As long as the price remains below 1.1530, the bearish trend is expected to continue toward 1.1450 and 1.1372.
For a bullish reversal, the price must break above 1.1559 to open the path toward 1.1625.
Pivot Line: 1.1530
Support Levels: 1.1450, 1.1372, 1.1270
Resistance Levels: 1.1559, 1.1625, 1.1750

EURUSD long 30m*The content on this analysis is subject to change at any time without notice, and is provided for the sole purpose of assisting traders to make independent investment decisions.

EURUSD !!! (Big move is loading)
📈 EUR/USD – Wave 4 Buy Opportunity (2H TF)
Published by Greenfireforex | June 13, 2025
The EUR/USD pair is completing a corrective Wave 4, retracing into a premium FVG (Fair Value Gap) demand zone between 1.1500–1.1475. Price tapped into a high-probability reversal block just below the psychological level of 1.1500, offering a potential long entry.
🔹 Technical Confluences:
Wave 4 corrective structure
Fair Value Gap (Buyers) zone
Liquidity grab near 1.1478
Bullish projection towards 1.1637 (Wave 5 target)
🔸 Entry Idea:
Long from the FVG demand zone with confirmation (price action / bullish engulfing / lower timeframe structure break).
📍 Targets:
TP1: 1.1500
TP2: 1.1570
TP3 (wave projection): 1.16375
🛑 Invalidation:
Clean break below 1.1470 zone with momentum could invalidate the bullish setup.
---
📊 Strategy: Elliott Wave + FVG + Price Action
💡 Watch for reaction around CPI & USD news (14th–18th June)
Hashtags (for IG/TradingView):
#EURUSD #WaveAnalysis #Forex #ForexSetup #PriceAction #ElliottWave #SmartMoney #FXTrade #ForexBreakout
---

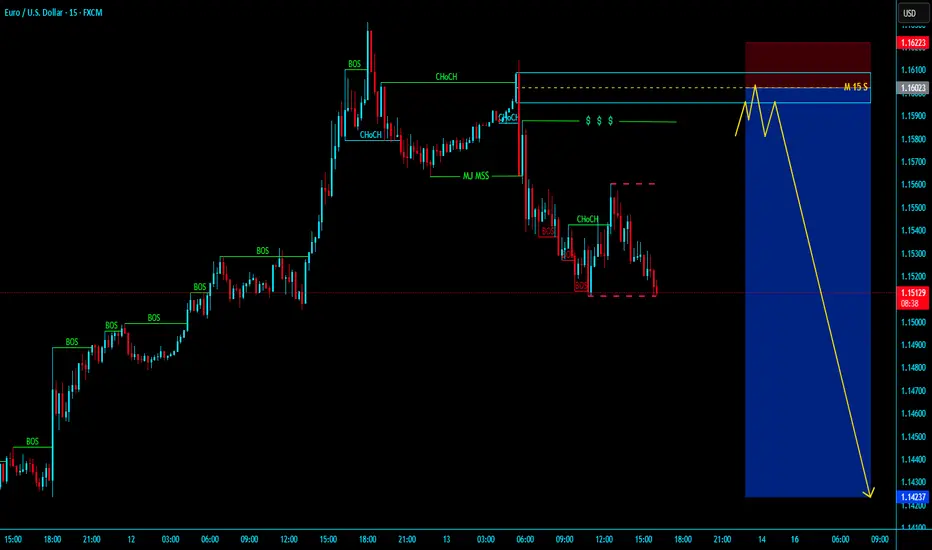
# EURUSD H1 MJ MSS WITH LIQUIDITY # EURUSD H1 MJ MSS WITH LIQUIDITY
~ EU MSS in H1 , in LTF with valid MSS Conformation then short entry with little pips of SL and long TP.....
~ 1st TP - @ 1.11760
~ 2ns TP - @ 1.10000
~ 3rd TP - @ 1.07780
Be Patient's on Your Trade
~~* KGB Priyabrta Behera *~~
* ICT & Advance Mapping SMC Trader *
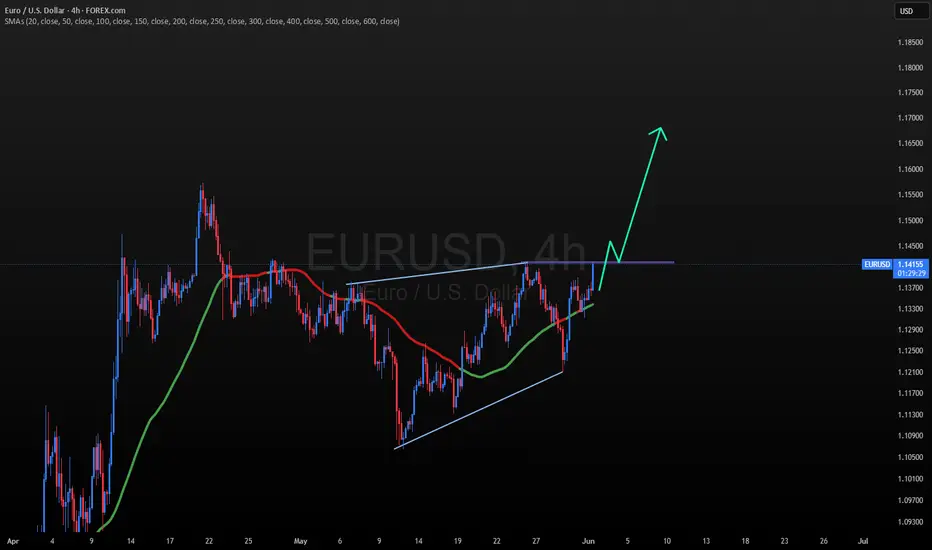
EURUSAD 4hr Chart Analaysis If EUR/USD breaks above the 1.14218 level, the next bullish target would be 1.16710.
This level marks a potential continuation of the uptrend, suggesting strong bullish momentum. A clean breakout above 1.14218 would likely confirm buyer dominance, possibly driven by improving eurozone fundamentals or broad USD weakness. The 1.16710 zone could act as a medium-term resistance level, aligning with historical price action and potential Fibonacci extensions.
Traders should monitor price behavior closely near 1.14218 for confirmation of a breakout, such as high volume and sustained closes above the level.
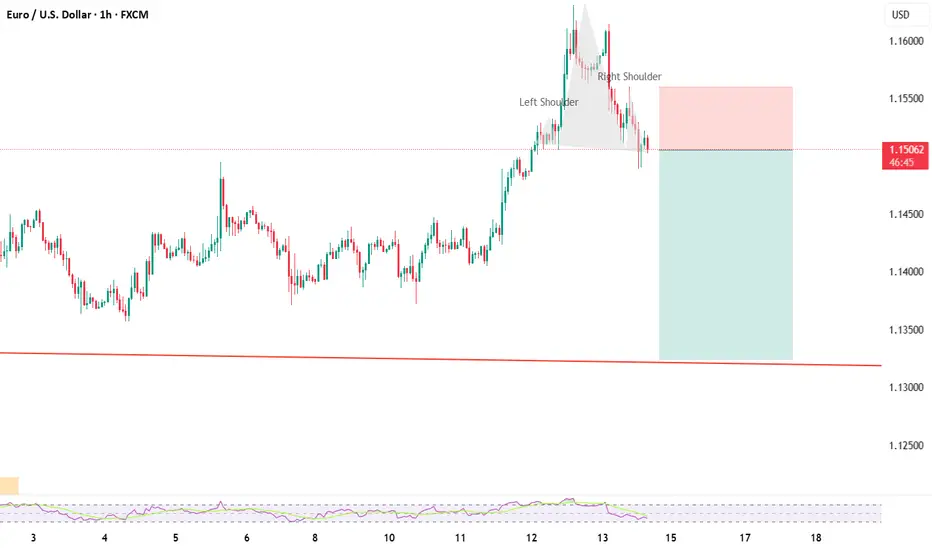
EUR/USD 1H Analysis – Bullish Reversal Setup
After a strong bearish push from the 1.16000 supply zone, price tapped into a high-probability demand zone (highlighted in grey) near the 1.15000 psychological level. The price action shows multiple bullish rejections from this zone, suggesting the presence of institutional buying interest.
Key observations:
Bullish Order Block: Price respected a bullish order block within the demand zone.
Liquidity Sweep: Sell-side liquidity was taken just below the recent lows, indicating a potential manipulation before a move higher.
Market Structure: Although the immediate structure is bearish, the reaction from demand shows early signs of a possible bullish reversal.
Entry Concept: A long setup is anticipated from the current zone with potential continuation toward the previous high at 1.16000 (marked target).
Risk Management: Stops can be placed just below the demand zone, targeting the imbalance and previous supply zone above.
The dotted red arrow reflects the projected bullish move based on the smart money concept—buying from demand after liquidity sweep and targeting inefficiencies.
This setup aligns with a smart money concept (SMC) approach: demand zone respect, liquidity grab, and a potential BOS (break of structure) forming.
Would you like me to generate hashtags and a short caption for posting as well?
📈 EUR/USD 1H – Smart Money Precision Entry
Liquidity swept ✅
Tapped into demand ✅
Institutional footprints spotted ✅
Now waiting for that bullish reversal to send us flying to 1.16000 🚀
#SmartMoneyConcepts #SMC #EURUSD #ForexTrading #OrderBlock #LiquidityGrab #PriceAction #FXTradingClub #MarketStructure #ReversalSetup #ForexSniper #TradingView #ForexAnalysis

EUR/USD Slips on Geopolitical TensionsEUR/USD dropped to around 1.1530 on Friday, ending a four-day rally, as safe-haven demand lifted the US Dollar amid rising Middle East tensions.
Israel struck Iranian targets to weaken its nuclear program, prompting emergency measures. The US denied involvement but warned Iran not to target its assets.
Trump’s plan to expand steel tariffs from June 23 added trade uncertainty, while soft US inflation data kept Fed rate cut hopes alive.
Markets now await the US Michigan Sentiment report for further signals.
Resistance is located at 1.1580, while support is seen at 1.1460.
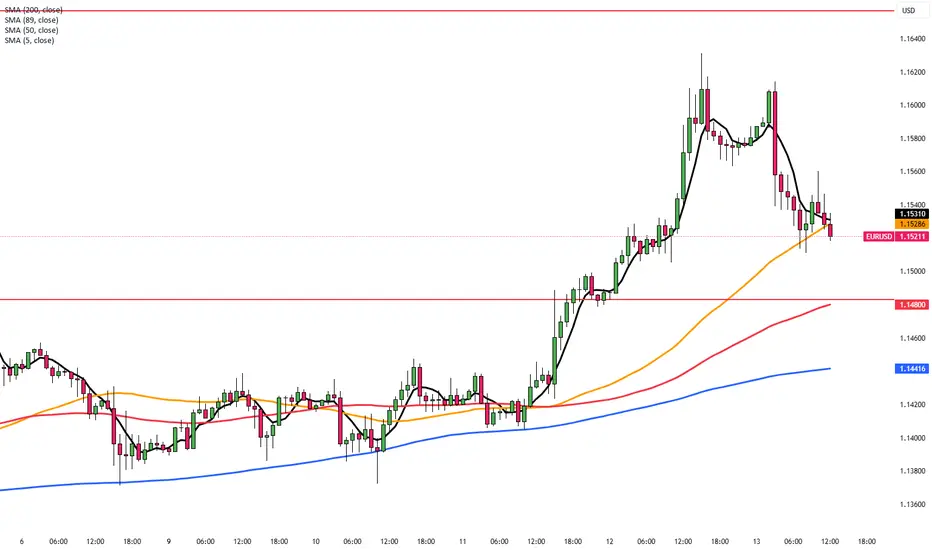
EURUSD Is Bullish! Buy!
Here is our detailed technical review for EURUSD.
Time Frame: 5h
Current Trend: Bullish
Sentiment: Oversold (based on 7-period RSI)
Forecast: Bullish
The market is approaching a significant support area 1.152.
The underlined horizontal cluster clearly indicates a highly probable bullish movement with target 1.163 level.
P.S
The term oversold refers to a condition where an asset has traded lower in price and has the potential for a price bounce.
Overbought refers to market scenarios where the instrument is traded considerably higher than its fair value. Overvaluation is caused by market sentiments when there is positive news.
Disclosure: I am part of Trade Nation's Influencer program and receive a monthly fee for using their TradingView charts in my analysis.
Like and subscribe and comment my ideas if you enjoy them!

EURUSD Weekly Key Level + Liquidity SweepPrice swept weekly high, watching for possible rejection around 1.16921
EURUSD - Long from hereDue to having internal Breaks of Structure to the upside here I have entered a long position as it is a reasonable area to potentially get long as it is a strong area of demand.
I'm aware that there isn't much liquidity built up in and around this area before hitting the demand but its a risk im willing to take as price may just be filling the FVG from all the buying pressure that was in the market yesterday
Any questions please message

EURUSD - Current long positionVideo analysis of EURUSD
Hopefully we will get some bullish momentum however its not looking great

Why Most Traders Fail Trading Psychology BreakdownA visual summary of common trading mistakes and how a structured mindset can change your execution. Shared for educational purposes only.

SELL EURUSD for bullish trend reversal STOP LOSS: 1.1804SELL EURUSD for bullish trend reversal
STOP LOSS: 1.1804
Regular Bearish Divergence
In case of Regular Bearish Divergence:
* The Indicator shows Lower Highs
* Actual Market Price shows Higher Highs
We can see a strong divergence on the MACD already and There is a strong trend reversal on the daily time frame chart.....
The daily time frame is showing strength of trend reversal from this level resistance so we
are looking for the trend reversal and correction push from here .....
TAKE PROFIT : take profit will be when the trend comes to an end, feel from to send me a direct DM if you have any question about take profit or anything
Remember to risk only what you are comfortable with….....trading with the trend, patient and good risk management is the key to success here

possibility of correctionConsidering the price behavior in the current support range, there is a possibility of an upward trend. Otherwise, the continuation, with the support range broken, of a continuation of the downward trend is likely.

CHECK EURUSD SIGNAL READ CAPTAIN Trade Setup Details:
Entry Price: 1.15350 (marked in grey)
Current Price (as per screenshot): 1.15319
Stop Loss: 1.15050 🔻
Take Profit Levels:
TP1: Around 1.15570
TP2: Around 1.15820
Last Target: 1.16000 🎯

Mitigation Block in Forex Trading: What It Is and How to Use It?What a Mitigation Block Is, and How You Can Use It When Trading Forex?
Understanding specific market mechanisms like mitigation blocks may enhance strategic decision-making. This article delves into the concept of mitigation blocks, detailing their definition, function, and practical application within forex.
Definition and Function of a Mitigation Block
A mitigation block in forex trading refers to a specific order block on a chart that indicates where previous movements have stalled and reversed, marking it as a potential area for future market turns. This concept within the Smart Money framework is crucial for traders looking to manage their positions by taking advantage of strategic entry and exit points.
The idea behind these areas is rooted in the dynamics of supply and demand within forex. When a currency pair reaches a level where buyers or sellers have previously entered the market in force, causing a reversal, it suggests a potential repeat of such actions when the price returns to the area.
Characteristics and How to Identify a Mitigation Block
Mitigation blocks can be bullish or bearish, each with distinct characteristics:
- Bearish Mitigation Block: This type forms during an uptrend and is identified by a significant peak followed by a decline and a failed attempt to reach or surpass the previous high, creating a lower high. When prices drop below the previous low, the order block above the low becomes mitigation. It may be characterised by an increase in selling volume as the price approaches the level, signalling resistance and a potential downward reversal.
- Bullish Mitigation Block: Conversely, a bullish type is established during a downtrend. It is characterised by a significant trough, followed by a rise to form a higher low, and a failure to drop below the previous low. As the pair moves up, the order block below the high marks mitigation one. This area often shows an increase in buying volume as the price approaches, indicating support and a potential upward reversal.
Mitigation Block vs Breaker Block
Mitigation and breaker blocks are both significant in identifying potential trend reversals in forex trading, but they have distinct characteristics that set them apart. A mitigation block forms after a failure swing, which occurs when the market attempts but fails to surpass a previous peak in an uptrend or a previous trough in a downtrend. The pattern indicates a loss of momentum and a potential reversal as the price fails to sustain its previous direction.
On the other hand, a breaker block is characterised by the formation of a new high or low before the market structure is broken, indicating that liquidity has been taken. This means that although the trend initially looked set to continue, it quickly reverses and breaks structure.
In effect, a breaker appears when the market takes liquidity beyond a swing point before reversing the trend. A mitigation appears when the price doesn’t move beyond the trend’s most recent high or low, instead plotting a lower high or higher low before reversing the trend.
How to Use Mitigation Blocks in Trading
Areas of mitigation in trading can be essential tools for identifying potential trend reversals and entry points. When they align with a trader's analysis that anticipates a reversal at a certain level, it can serve as a robust confirmation for entry.
Traders can effectively utilise these zones by simply placing a limit order within the area once it is considered valid. Validation occurs after a new peak or trough is established following the initial failure swing that forms the mitigation area.
If a liquidity void or fair-value gap is present, the trader may look for such a gap to be filled before their limit order is triggered, potentially offering a tighter entry. Stop losses might be placed beyond the failure swing or the most extreme point.
Furthermore, if a mitigation block is identified on a higher timeframe, traders can refine their entry by switching to a lower timeframe. This approach allows for a tighter entry point and potentially better risk management, as it offers more granular insight into the momentum around the area.
Common Mistakes and Limitations
While these blocks are valuable for forex trading, they come with potential pitfalls and limitations that traders should know.
- Overreliance: Relying solely on mitigation blocks without corroborating with other trading indicators can lead to misjudged entries and exits.
- Ignoring Context: Using these zones without considering the broader market conditions may result in trading against a prevailing strong trend.
- Misinterpretation: Incorrect identification can lead to erroneous trading decisions, especially for less experienced traders.
- False Signals: Mitigation blocks can sometimes appear to signal a reversal but instead lead to a continuation of the trend, trapping traders in unfavourable positions.
The Bottom Line
Understanding mitigation blocks offers traders a strategic edge in navigating the forex market. They can be vital for recognising potential price reversals and improving trading outcomes.
FAQs
What Is a Mitigation Block?
A mitigation block in forex trading is an order block that identifies potential reversal points. It signals where a currency pair has previously stalled, indicating strong buying or selling pressure, suggesting a potential for similar reactions in future encounters with these levels.
How Do You Identify a Mitigation Block?
Mitigation blocks are identified by analysing charts for areas where previous highs or lows were not surpassed, leading to a reversal. Traders look for a sequence of movements, including a swing high or low followed by a retracement that fails to exceed the previous swing.
What Is the Difference Between a Breaker Block and a Mitigation Block?
While both indicate potential reversals, a breaker block forms when the price makes a new high or low before reversing, suggesting a temporary continuation of the trend. In contrast, a mitigation block forms without creating a new extreme, indicating a direct loss of momentum and an immediate potential for reversal.
This article represents the opinion of the Companies operating under the FXOpen brand only. It is not to be construed as an offer, solicitation, or recommendation with respect to products and services provided by the Companies operating under the FXOpen brand, nor is it to be considered financial advice.


Dollar indexAfter a negative reading of the core ppi m/m and employment claims. The dollar tested and failed to break a resistance level. Market is expected to push down to test the support level

Hellena | EUR/USD (4H): LONG to the resistance area 1.15691.Colleagues, I believe that wave “5” of higher order has actively started an upward movement.
At the moment I see movement in wave “1” of medium order and it means that a correction in wave “2” to the area of 50% Fibonacci level (1.12434) is expected. But I would still advise to consider only upward movement and use pending limit orders.
I see the maximum of wave “3” - resistance area 1.15691 as the target.
Manage your capital correctly and competently! Only enter trades based on reliable patterns!

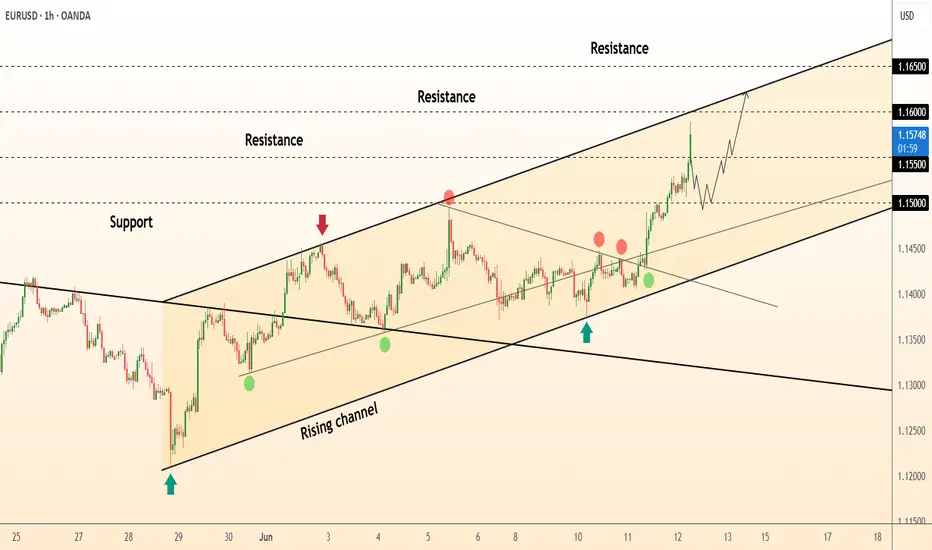
DeGRAM | EURUSD above the 1.15📊 Technical Analysis
● Hourly close above 1.1500 completed a small ascending triangle; price is now hugging the rising-channel’s upper rail after a chain of higher-lows, pointing toward the 1.1600 objective.
● Triangle top and channel mid-line overlap at 1.1500-1.1520; while candles stay above, risk : reward favours a push to the next fib / upper parallel near 1.1650.
💡 Fundamental Analysis
● US core-CPI eased to 0.1 % m/m, driving Treasury yields lower and lifting September Fed-cut odds >70 %, weakening the dollar, while ECB officials talked up a “data-dependent” pause, keeping euro bids firm.
✨ Summary
Long bias while price holds 1.1520; targets 1.1600 then 1.1650. Invalidate on an hourly close below 1.1470.
-------------------
Share your opinion in the comments and support the idea with like. Thanks for your support!
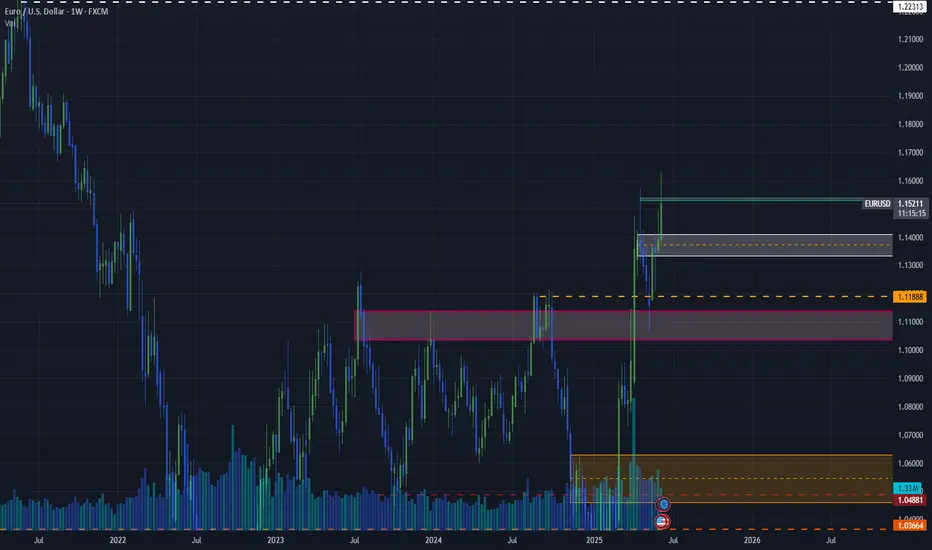
EUR/USD Breakout Retest StrategyEUR/USD Breakout Retest Strategy 🟢📈
📊 Technical Analysis Summary:
The chart illustrates a bullish breakout from a consolidation range with a well-defined support near 1.12500 and resistance between 1.16500–1.17000.
🔍 Key Observations:
🔸 Triple Rejection Zone:
Price faced rejection 3 times (highlighted with orange circles) near the same level before the breakout — classic liquidity sweep above resistance.
🔸 Strong Support Bounce:
Each time price reached the green support zone, it showed strong bullish reaction (green arrows) signaling solid buying interest.
🔸 Break and Retest Formation:
Price broke the previous highs and now seems to be retesting the breakout zone (around 1.15250–1.15300). A successful retest could confirm bullish continuation.
🔸 Projected Bullish Move:
If the retest holds, we may see price pushing up toward the 1.17000 resistance zone as marked.
📌 Trading Plan:
✅ Bullish Bias above 1.15250
✅ Look for bullish candlestick confirmation or breakout structure
🚫 Avoid trades if price drops below 1.15000 with momentum
📈 Target Zone: 1.16500 – 1.17000
🛑 Stop Loss suggestion: Below 1.14750
🧠 Keep patience during the retest — smart money often tests emotions before real moves! 💰📉📈
