EUR/USD: Weekly PAT + VPA 5/11/2025Trading Analysis EUR/USD - Price Action and Volume Price Analysis
Weekly Structure Analysis: At present, we find ourselves within a bullish weekly range. The lower boundary of this range is 1.07330, established during the week of March 24, 2025, while the upper boundary is at 1.15734, reached the week of April 21, 2025. The price movement from 1.073 to 1.157 has surpassed a swing high, which we will identify as our initial resistance point as we aim to return to 1.15734.
Weekly Price Action Analysis: Analyzing structure and price action reveals similarities. Our confidence in a bullish trend is the anchored weekly bar. The weekly candle from the week of April 7, 2025 serves as this anchor. Following the inside bar, we observed a bearish pin bar, which acts as a Bullish Reacher since its wick exceeded the high of the anchor bar's wick (Wick on Wick). The market shows signs of wanting to rise, but it must first hit a demand zone that weekly traders are keen to engage with.
Volume Price Analysis: The last four weekly candles have demonstrated limited strength in driving the market lower, with support holding at 1.11927 (1.12). As the price declines, trading volume is decreasing, following a sharp upward movement, likely due to profit-taking or repositioning. Volume analysis indicated we should retest 1.15734.
Good luck and happy trading!
OANDA:EURUSD TVC:DXY
EURUSD_TOM trade ideas

EURUSD SELL OPPORTUNITY!!Price just tapped in the H4 supply zone. I anticipate a sell off around that price point. Also considering the nature of aggressive sell off around that price range, a sell opportunity is envisaged

#AN006 Forex: Dollar, Yen and Emerging Currencies Collapse
Hello, I'm Forex trader Andrea Russo, creator of the SwipeUP Elite FX Method that analyzes the market like a Hedge Fund. Today I want to talk to you about the most important economic news of the last few hours and how these are influencing, in real time, the global currency market.
## 🔜 US inflation: is the Fed heading for a cut?
The CPI data released yesterday surprised the markets: annual core inflation stopped at +2.8% while the general figure stood at +2.4%, below expectations. This inflationary cooling immediately triggered speculation about a possible rate cut by the Federal Reserve as early as September. The Dollar Index (DXY) reacted negatively, losing ground and touching the lowest levels since April.
### Forex Impact:
* The dollar weakens across the board.
* EUR/USD tested the 1.15 area
* GBP, JPY and CHF strengthened in counter-balance.
## 🌐 US-China trade tensions: half-way deals
Over the past 24 hours, President Trump spoke of "partial progress" in talks with China on tariffs and rare metals. However, the lack of a definitive deal keeps global uncertainty high. Investors are weighing the risk of a new escalation, especially in strategic sectors such as technology and raw materials.
### Forex impact:
* AUD and NZD show high volatility.
* JPY benefits as a safe haven currency.
* Commodity currencies remain reactive to geopolitical developments.
## 📉 ECB: rate cut and expansionary forward guidance
The European Central Bank has cut interest rates to 2%, marking the eighth consecutive cut. The governor opened up to further expansionary measures in the third quarter, should inflation fail to rebound towards the 2% target.
### FX Impact:
* The euro remains under pressure, despite the dollar weakness.
* EUR/CHF in congestion.
* EUR/USD in a sideways phase after the initial rally.
## 🚗 Emerging Markets: New Cycle of Strength
According to the World Bank, growth in emerging markets will slow to 3.8% in 2025. However, currencies such as the Brazilian real (BRL) and the Mexican peso (MXN) have gained momentum thanks to the dollar weakness and speculative inflows on carry trades.
### FX Impact:
* BRL and MXN strengthen.
* Long-term opportunities on USD/EM crosses.
* Beware of political risks and local inflation.
## ⛽ Oil rally: domino effect on currencies
Oil prices rose this week: WTI hit +6%, while Brent marked +4%. The rally was triggered by improvements in US-China relations and geopolitical tensions in the Middle East.
### Forex Impact:
* Strengthening CAD and NOK.
* EUR and JPY penalized as net importers.
* Correlation opportunities on USD/CAD.
## 🔄 Forex Outlook: what to expect now
The market has entered a phase of **macro realignment**:
* The dollar is in structural correction.
* The euro is struggling between ECB stimulus and USD weakness.
* Safe haven currencies (JPY, CHF) remain strong.
* Emerging markets and commodity currencies show momentum.
In the short term, the key will be the evolution of US data (PPI, retail sales) and new statements from the Fed.
Keep following me for updates and operational analysis always based on real data and institutional methodology.

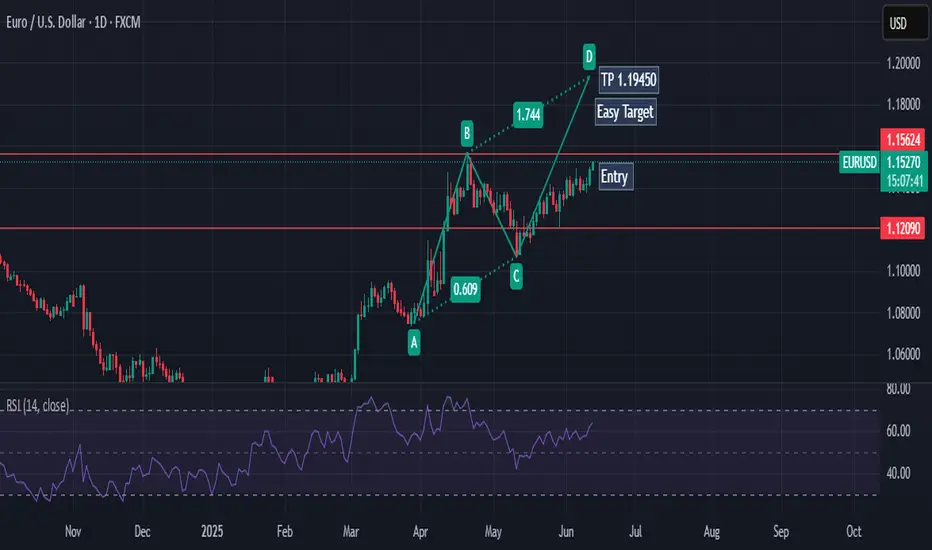
EURUSD BULLISH OR BARISH DETAILED ANALYSISEURUSD is showing strong bullish momentum after a clean bounce from the key support zone around 1.12. Price structure confirms higher lows and strong bullish candle formations on the daily chart, suggesting the bulls are in control. This recent move is backed by a textbook retest and rejection from the previous resistance-turned-support zone, giving confidence in a potential continuation toward the 1.19 level. With the current price trading near 1.15 and pushing higher, the market is positioned for a strong bullish wave in the coming sessions.
From a fundamental perspective, the Euro has gained fresh support after the ECB’s decision last week to proceed with a measured and data-dependent rate cut cycle. While the ECB delivered its first cut, the tone was cautious and far less dovish than anticipated, which kept EUR strength intact. On the USD side, traders are pricing in a more dovish outlook for the Federal Reserve, especially with recent CPI and PPI data pointing toward cooling inflation. This divergence in policy outlook continues to favor EURUSD upside in the medium term.
Technical indicators are also confirming the bullish bias. The pair is riding an ascending trendline, and momentum indicators like RSI remain in bullish territory without yet being overbought. A daily close above the 1.1550 area strengthens the case for a continuation move. The price is aiming for the next major resistance around 1.1770–1.19, where bulls are likely to take profit or scale out. Until then, dips are likely to be bought aggressively, as long as the 1.12 support remains intact.
This setup presents a high-probability opportunity in a trending market backed by both fundamentals and technical confluence. As long as the bullish structure holds, I remain long-biased on EURUSD with eyes on the 1.19 zone as the next key level. With increasing market interest, low volatility on the downside, and strong trend-following signals, this pair is set for a continued rally.


DeGRAM | EURUSD held the support📊 Technical Analysis
● Euro holds above 1.137 – 1.140, where the channel’s mid-line meets the old wedge roof, printing a fresh higher-low (green arrow).
● Price is compressing inside a pennant capped at 1.142; flag height projects to 1.156 – 1.160 at the rising-channel median once 1.142 gives way.
💡 Fundamental Analysis
● After the ECB’s “one-and-pause” cut, sticky EZ core CPI (2.9 % y/y) and softer US payrolls narrowed the 2-yr rate gap, keeping flows tilted toward the euro.
✨ Summary
Buy 1.137–1.141; pennant breakout >1.142 targets 1.156 → 1.160. Long bias void on an H4 close below 1.126.
-------------------
Share your opinion in the comments and support the idea with like. Thanks for your support!

EURUSD has follow the ascending channel bullish from support FX:EURUSD Analysis – 1H Time Frame
EUR/USD is currently respecting an ascending channel and showing strong bullish momentum from the key demand zone at 1.13900.
🎯 Technical Targets:
1st Target: 1.14600
2nd Target: 1.15000
The price action confirms buyer interest and continued upside potential, as long as the structure holds.
📊 Stay tuned for more updates and trade setups!
💬 Like, follow, and drop your thoughts in the comments!
— With love,
Livia 😜

EURUSD SHORTAccording to natural market structure theory, I observed a gradual increase in volume starting from May 29, which led to a rebound around June 5. However, the uptrend has since lost momentum.
The recent price action has approached the zero line of the descending Fibonacci retracement. This movement, combined with a possible liquidity grab, suggests that the market may shift downward. The target price area is near the 0.5 Fibonacci level, but further observation is needed to confirm this scenario. OANDA:EURUSD

CHECK EURUSD SIGNAL READ CAPTAIN Key Levels:
Entry Point: Around 1.15150
Stop Loss: 1.15300
Take Profit 1: 1.15000
Take Profit 2: 1.14900
Last Target: 1.14800

Elliott wave daily EURUSD update
Elliott wave daily EURUSD update
The price movement of the last few weeks requires a change
and update of the wave count
______________________________________
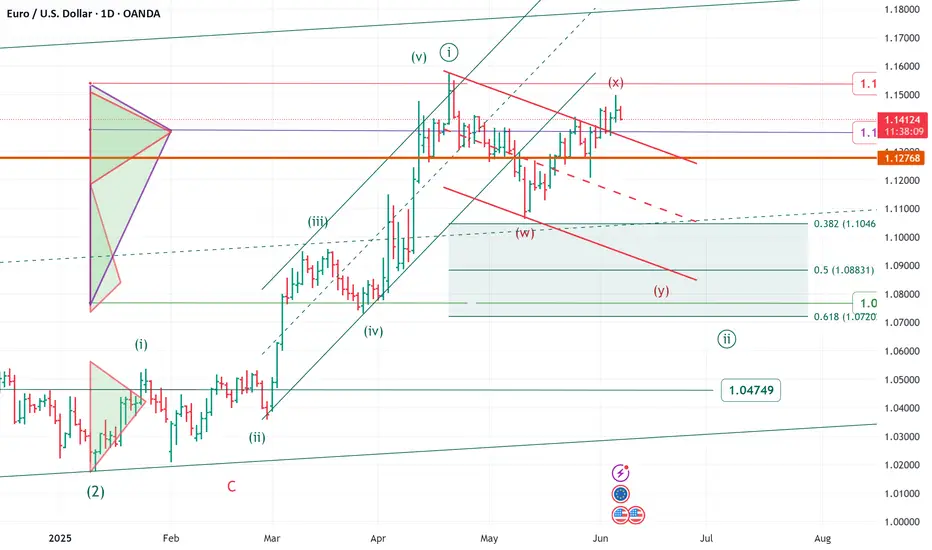
upward movement from area 1.018/genuary 2025 to area 1.1580/april 2025
looks impulsive - minute wave ((i)).
we are now in a corrective minute wave ((ii))
zigzag or flat or any double
target area 1.1040/1.0800 area
in the very short term level to monitor 1.1500 area
over 1.1500 area a flat correction more likely ( to area 1.1570)
note
FX option expiries for 6 June 10am New York cut
1.1500 (EUR 3.19bn)
1.1400 (EUR 2.38bn)
1.1300 (EUR 1.28bn)
FOREXLIVE
Let the market pull back toward the marked FVG.🚨 EUR/USD Traders – Eyes on This Setup! 💹
The market has been respecting a trendline over the past few days, bouncing off support and climbing steadily. 🧗♂️ While doing so, it’s also been tapping into Fair Value Gaps (FVGs)—a clear sign of smart money interest. 📊
🔥 And guess what? We’ve just seen a breakout above the trendline resistance! This could be the beginning of a strong bullish move. BUT… patience is key! 🕰️
📉 Let the market pull back toward the marked FVG zone. If it does, that could give us a golden buy opportunity with high potential upside! 🚀
🧠 Always remember: Do Your Own Research (DYOR)
📛 Not Financial Advice – Trade Smart!

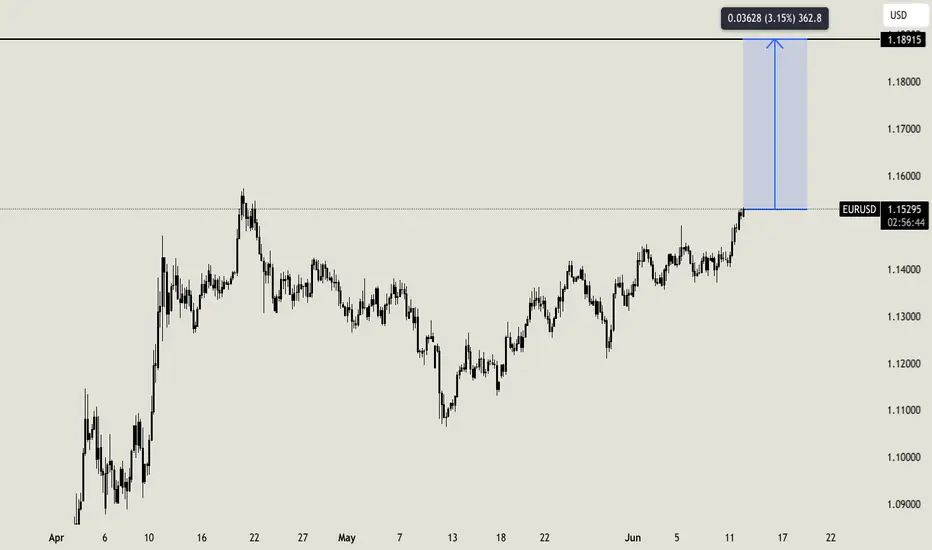
EURUSD Targeting 1.19?Euro is in a bullish trend from the past months, and doesn't look like it want to stop now. Euro is strong and dollar is always more weak. I expect a continuation of the rally here, targeting 1.19 in the coming months, probably till September/October. A good buy point for swing traders
EURUSD| Riding the Real FlowInitially waited for price to return to my first POI — didn’t happen. Instead, price BOS’d and unlocked fresh liquidity. No panic. I’m not here to force old zones — I follow structure.
Now we’ve got:
✅ 4H bullish momentum still active
✅ Fresh BOS creating new intent + liquidity
✅ 30M heavy bullish push showing strength
✅ Top-down alignment from 4H → 30M → 5M
✅ Mitigation + sweep + OB entry on deck
That clean demand zone is holding value — I’m just staying patient, letting price do its thing. As always: “We sit. We wait. We strike.”
When it aligns — I’m in. Until then, I’m chilling like the sniper I am.
#SMC #JuicemannnFlow #TopDownMastery #ForexSniper #StructureTalks #InducementKing #EURUSD #RideTheMomentum #4HTo5M #LiquidityReads #FundedTraderMoves
Bless Trading!

Price actionEurusd remains bullish now price broke structure above now needs to form a lower high b4 continuing to the upside

EURUSD SHORT FORECAST Q2 W24 D12 Y25EURUSD SHORT FORECAST Q2 W24 D12 Y25
Professional Risk Managers👋
Welcome back to another FRGNT chart update📈
Diving into some Forex setups using predominantly higher time frame order blocks alongside confirmation breaks of structure.
Let’s see what price action is telling us today!
💡Here are some trade confluences📝
✅Weekly order block
✅15' order block
✅4 hour order block
✅Tokyo ranges to be filled
🔑 Remember, to participate in trading comes always with a degree of risk, therefore as professional risk managers it remains vital that we stick to our risk management plan as well as our trading strategies.
📈The rest, we leave to the balance of probabilities.
💡Fail to plan. Plan to fail.
🏆It has always been that simple.
❤️Good luck with your trading journey, I shall see you at the very top.
🎯Trade consistent, FRGNT X

EURUSD After the NewsEURUSD continues its bullish trend, posting new gains following yesterday’s important news.
The next resistance levels are at 1,1562, 1,1608, and 1,1657.
Watch for a potential continuation of the trend and buying opportunities after a pullback.
The next key news events that could impact the market are scheduled for June 18th.

EURUSD(20250612) Today's AnalysisMarket news:
① The EU hopes that the trade negotiations will be extended beyond the suspension period set by Trump. ② Bessant: As long as "sincerity" is shown in the negotiations, the Trump administration is willing to extend the current 90-day tariff suspension period beyond July 9. ③ Trump will hold multiple bilateral talks during the G7 summit. ④ The total customs revenue of the United States in May reached a record high of US$23 billion, an increase of nearly four times year-on-year. ⑤ Lutnick: One deal after another will be reached.
Technical analysis:
Today's buying and selling boundaries:
1.1463
Support and resistance levels:
1.1556
1.1521
1.1499
1.1427
1.1404
1.1369
Trading strategy:
If the price breaks through 1.1499, consider buying in, and the first target price is 1.1521
If the price breaks through 1.1463, consider selling in, and the first target price is 1.1427

euro/usdtrade 5 entry point i belive a reversal is in order if its not it will break the stoplloss and use the resitance as surport and we will then jump on for the bullish but my eye is for it to be bearish right now

EURUSD LONG Dollar is looking weak for this week and possibly the rest of this month I’m seeing lots of longs on the dollar get closed and Asset managers are hedging against the dollar. We are seeing price not respect the previous highs and a lot of new sellers who got stopped out are re entering so I believe we could see a small drop then continuation to the upside this week .

EUR/USD tests three-year ceiling Aside from a brief spike in April, EUR/USD has remained below 1.1500 for over three years.
Sellers again have had to defend the zone following the weaker-than-expected US CPI release. The main resistance zone potentially spans all the way up to 1.1573 (the April high).
Some indicators suggest potential room for further upside. The Relative Strength Index (RSI) has not yet reached overbought territory, and the Daily Moving Average is positively sloped. A break below the 4-hour Moving Average could trigger more selling pressure and a potential correction.

EURUSD - TIME TO SHORT Team, last time we have successfully SHORT the EURUSD and now we are back on it again
This time we have better short position
NOTE: Last few days we have been killing the UK100/FTSE100 with such great opportunity.
Please follow the PRICE target accordingly to the CHART
Target 1 1.147200 to 1.4650
Target 2 at 1.1455-1.1450
Once it reach the 1st Target take 50% profit
Good luck and enjoy the profit

Eurusd Buyprice is bullish on the Daily and 4hr tf. on the 1hr it is exiting the Daily demand zone and recently bounced off the 1hr trendline. price is currently around 4hr poi which may help give us fuel to move to the 1hr poi and above targeting next Daily key level.
