Patience needed for this pair - EURUSDI like this pair for a simple reason - it is relatively slow moving and it suits traders who have a lower risk appetite and helps to sleep better at night. A 50 points SL is sufficient to let this pair runs for days/weeks without getting stopped out in my case.
Weekly and daily time frame, it is registering a bullish stance so down to 4H, we just need to be patient.
EURUSD_TOM trade ideas

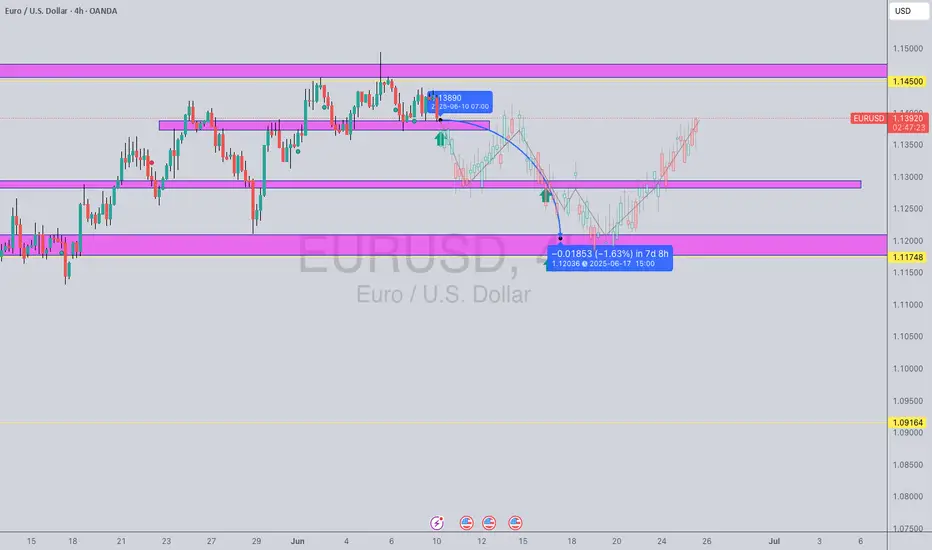
Based on the provided EURUSD 4-hour chart, here's a simple tradeCurrent Situation:
The price is currently at 1.13869, trading within a resistance zone (indicated by the pink shaded area around 1.13700 - 1.14000).
Previously, the price reacted strongly to this area, leading to a significant drop.
There's a clear upward trend leading into this resistance zone.
Potential Trade Scenarios:
1. Short Entry (Bearish Reversal):
Rationale : The price is at a significant resistance level that has caused a strong bearish reaction in the past. If this resistance holds, we could see a repeat of the previous downtrend.
Entry Signal: Look for clear bearish candlestick patterns (e.g., engulfing pattern, pin bar, or rejection candle) forming within or just below the resistance zone (around 1.13700 - 1.14000) . A break and retest of the lower boundary of this resistance could also be an entry.
Target: The next major support zone appears to be around 1.11748 - 1.12000.
Stop Loss: Place the stop loss just above the current resistance zone, perhaps around 1.14200 - 1.14500 , to account for potential false breakouts.
2. Long Entry (Bullish Breakout Continuation):
Rationale: If the current bullish momentum is strong enough to break through this resistance, it could signal a continuation of the upward trend.
Entry Signal: Wait for a confirmed breakout above the resistance zone (e.g., a 4-hour candle closing clearly above 1.14000 - 1.14200). A retest of the broken resistance as new support would offer a higher-probability entry.
Target: The next major resistance level is not immediately visible on this chart, but you would look for the next supply zone or previous swing highs.
Stop Loss: Place the stop loss below the broken resistance, which would now act as support, perhaps around 1.13500.
Key Considerations Before Entry:
Confirmation: Do not enter solely based on the price reaching the zone. Always wait for a clear candlestick confirmation or a break and retest.
Volume (if available): Higher volume on a breakout or rejection can add conviction to the move.
News Events: Be aware of any upcoming high-impact news events that could affect EURUSD.
Risk Management: Always define your stop loss and position size before entering any trade.
eur/usd TRADE 5 just a quick one to have a look at the market on where eur/usd will go i belive is going short to a level of support, to then reach a new high we see where it goes

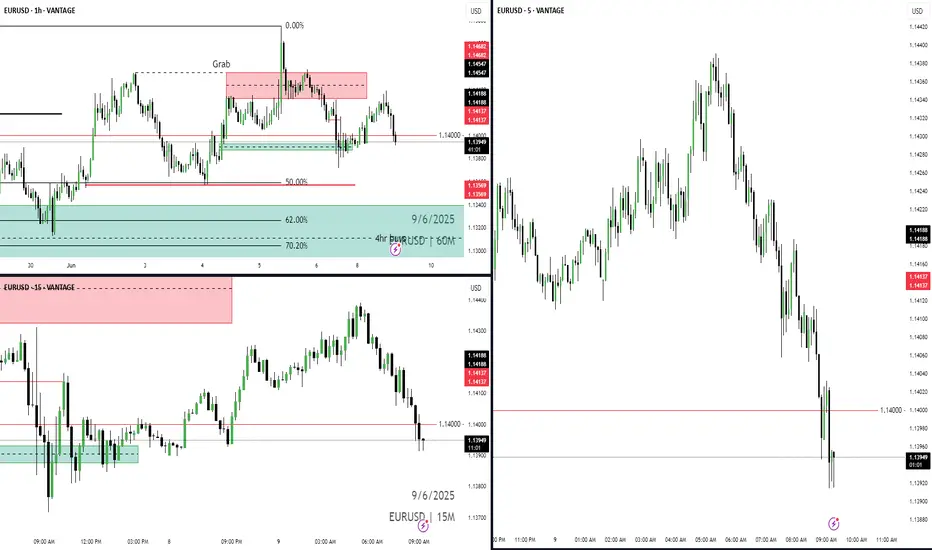
Will the U.S. Dollar Bear go out to lunch and take a break?In this video I go over the case for the U.S. Dollar bear taking a break and price action getting a pullback across the EUR/USD, GBP/USD and USD/JPY.
I took a 42% profit on EUR/USD longs and currently keeping an eye on a short opportunity if weakness starts to creep in on the price action.
Long term, I remain U.S. Dollar bearish across the board however pullbacks are always expected during a macro price move.
If we trade higher, so be it and I will evaluate what the next position will be.
As always, Good Luck & Trade Safe.

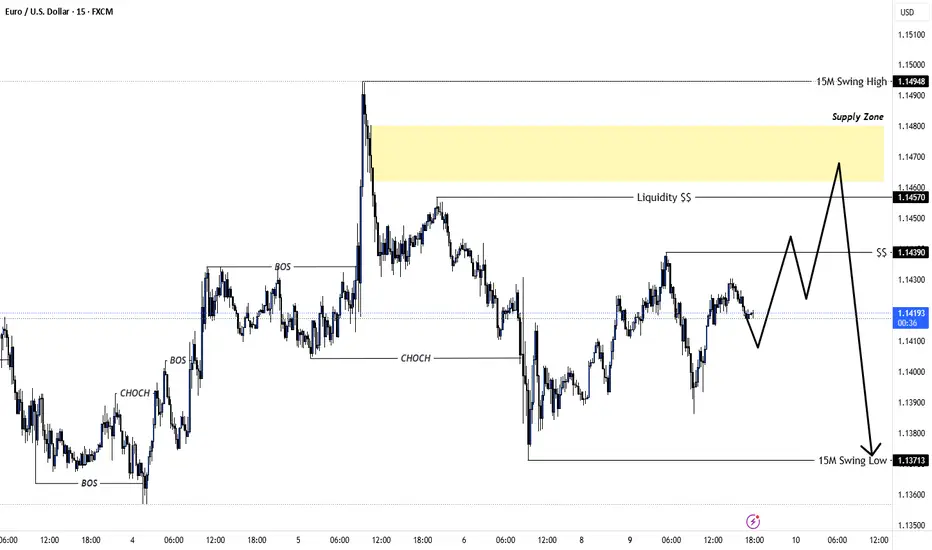
EUR/USD | 15M TF Analysis Here is what I will be looking for on the 15M timeframe. We broke structure to the downside. I will want to see price come up and take out the built up liquidity, tap into the supply zone I marked out, drop down to the lower time frame and see if it offers an entry to sell back down to the swing low.
If you like this analysis, please hit that like and follow button! Trade Safe! -Remzy

Euro's bullish momentum signals upside potential beyond $1.145
Current Price: $1.14247
Direction: LONG
Targets:
- T1 = $1.14500
- T2 = $1.15000
Stop Levels:
- S1 = $1.14000
- S2 = $1.13700
**Wisdom of Professional Traders:**
This analysis synthesizes insights from thousands of professional traders and market experts, leveraging collective intelligence to identify high-probability trade setups. The wisdom of crowds principle suggests that aggregated market perspectives from experienced professionals often outperform individual forecasts, reducing cognitive biases and highlighting consensus opportunities in Euro.
**Key Insights:**
Euro's price momentum has shown steady consolidation above the $1.14000 mark, signaling strong underlying demand. Technical indicators, such as the Relative Strength Index (RSI), suggest a gradual shift toward overbought territory, which could trigger bullish sentiment. Furthermore, the Euro's performance is reinforced by consistent volume levels, highlighting market participants' confidence in its upward movement. The recent shift in central bank monetary policy expectations toward stability is fostering optimism among traders.
Region-specific economic data points also support the currency. Improved manufacturing PMI data from core European economies, coupled with steady inflation trends, are providing a solid foundation for the Euro's bullish trajectory. Traders are closely watching these macroeconomic indicators to refine their strategies in line with prevailing market dynamics.
**Recent Performance:**
Over the past week, the Euro has climbed steadily from $1.13500, consistently testing and holding resistance levels, which now act as support points. This steady rise is indicative of strong technical fundamentals, supported by resilient demand across trading zones. The transition to the current price of $1.14247 reiterates market conviction in the Euro's potential for further gains.
**Expert Analysis:**
Technical analysts have emphasized moving averages, with the 50-day and 200-day SMAs signaling alignment for sustained bullish movement. With a current price above the 200-day SMA, momentum indicators and Fibonacci retracement levels pinpoint the next potential resistance zones around $1.14500. Additionally, pattern analysis reveals an ascending triangle formation, which is a common precursor to breakout scenarios.
Expert macroeconomic outlook is reinforcing this bullish sentiment, citing gradual easing of geopolitical tensions and improved trade relations among Eurozone economies. Bullish divergence in MACD charts further supports the likelihood of an extended rally as technical setups align with the broader economic narrative.
**News Impact:**
The recent European Central Bank announcement indicates a steady rate environment, which has historically led to increased currency valuation amidst reduced speculation. Meanwhile, sustained demand from corporate trade flows driven by robust economic indicators fortifies the market outlook. Strength in global equities and a weaker U.S. Dollar further provide tailwinds to the Euro.
**Trading Recommendation:**
Market alignment with technical and macroeconomic conditions creates an optimal scenario for long positions on the Euro. Traders should watch for a breakout past the $1.14500 level, which could quickly propel prices toward $1.15000. Coupled with conservative stop placement below prior support levels, this trade setup offers a compelling risk-reward opportunity. Initiating a bullish stance on Euro provides potential gains supported by technical convergence and positive sentiment within the Eurozone economic landscape.

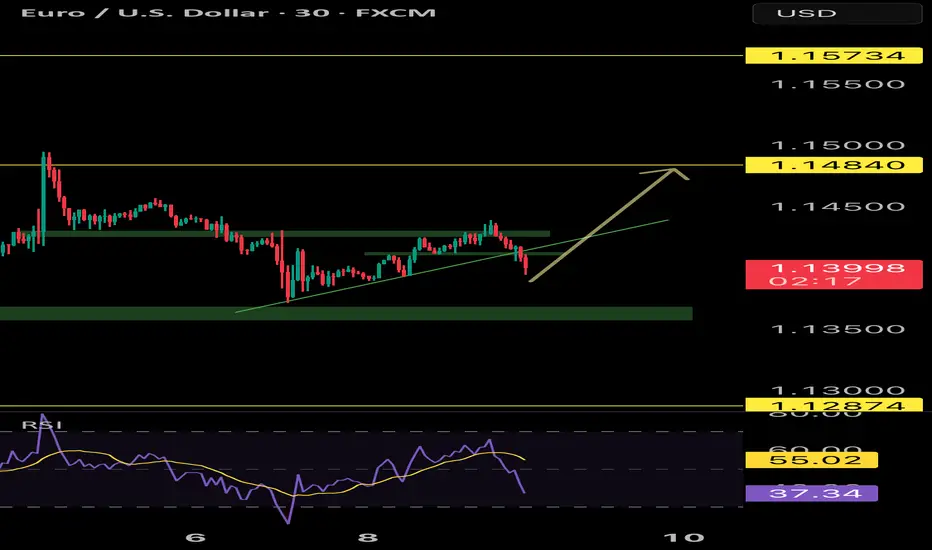
possibility of uptrendIt is expected that the upward trend will continue to the specified resistance levels.
If the price can break through the support range, the continuation of the downward trend will be likely.

EURUSD: Breakout and Potential RetraceHey Traders, in today's trading session we are monitoring EURUSD for a selling opportunity around 1.14200 zone, EURUSD was trading in an uptrend and successfully managed to break it out. Currently is in a correction phase in which it is approaching the retrace area at 1.14200 support and resistance zone.
Trade safe, Joe.

EUR/USD !!! ( 12RR Setup) Once in while opportunity : EUR/USD
Timeframe: 30M
Strategy: Elliott Wave + Wyckoff Structure
Risk-Reward: 1:12
Toolset: Supply Zone, Change of Character (ChoCh), Break of Structure (BoS), Entry Refinement
📈 Analysis Summary:
Price completed Wave 5 of the Elliott Wave structure.
Clear supply zone rejection near previous high – strong confluence.
Break of structure (BoS) confirms bearish bias.
A clean ChoCh (Change of Character) signals the shift from bullish to bearish.
Perfect Wyckoff schematic distribution playing out.
Entry taken from mitigation block with tight SL above zone.
Targeting higher-timeframe demand zone (highlighted in blue box).
💡 Key Zones:
Entry: Red mitigation zone
SL: Above local high
TP: Demand zone zone (RR 1:12)
📅 Watch this level around June 10–14 — expecting a strong impulsive move downward.
Comment ‘🔥’ if you caught this early.

The euro is in high - level oscillation.The euro has rebounded slightly against the US dollar, trading around 1.143 during the European session, recovering some of the losses from last week's decline from around 1.1500. Fundamentally, the US dollar weakened after taking profits from the strong non - farm payrolls data last Friday, while the hawkish remarks by European Central Bank Governing Council member Kazimir provided support for the euro. From the perspective of market structure, the short - term market sentiment is slightly bullish. The key resistance levels are concentrated in the 1.1494 - 1.1500 area. If this platform is broken through and held, it may form a new bullish breakout point.
Humans need to breathe, and perfect trading is like breathing—maintaining flexibility without needing to trade every market swing. The secret to profitable trading lies in implementing simple rules: repeating simple tasks consistently and enforcing them strictly over the long term.

EURUSD: Local Bullish Bias! Long!
My dear friends,
Today we will analyse EURUSD together☺️
The recent price action suggests a shift in mid-term momentum. A break above the current local range around 1.14158 will confirm the new direction upwards with the target being the next key level of 1.14327 and a reconvened placement of a stop-loss beyond the range.
❤️Sending you lots of Love and Hugs❤️

EUR/USD | Distribution in Play – Short Bias Active After completing a textbook Wave 5, price entered a premium supply zone and executed a clean liquidity sweep.
🔹 Confirmed Change of Character (ChoCh) signals the shift from bullish to bearish order flow.
🔹 Price is respecting the SMC structure:
📍 Liquidity grab
📍 Mitigation of bearish order block
📍 Distribution phase after impulsive rally
📉 Short-Term Bias: Bearish
🎯 Targeting the demand zone below near 1.1275–1.1292, where we may expect accumulation to begin again.
📌 Plan:
1. Short entries valid below 1.1439 supply.
2. Monitoring reaction at the blue zone for possible reversal next week.
⚙️ Strategy used:
SMC + Wyckoff Distribution + Elliott Wave (Top-down)

EUR/USD Bounce From Key Demand Zone | Short-Term Bullish SetupEUR/USD has just tapped into a well-defined Demand Zone between 1.12271 – 1.12600, showing aggressive buying pressure on the wick — a classic liquidity grab and bounce scenario.
📌 Bullish Confluences:
🟤 Deep tap into Demand Zone + aggressive wick rejection.
🟩 High probability reversal after stop-hunt.
🔵 Price forming higher low structure.
🔄 Clean imbalance/fair value gap above (room for recovery).
---
🎯 Bullish Targets:
1. 📍 1.13231 – Mid-range resistance and minor supply.
2. 📍 1.14018 – Major Supply Zone (swing TP).
🧠 Trade Idea: Long from 1.12600 area with tight SL under 1.12250, targeting 1.132xx or higher. R:R = 🔥 if managed properly.
---
📅 Fundamental Alerts:
🏛️ Upcoming US + EU news (marked on chart) = potential volatility spike.
🧭 Consider scaling out partials if key events flip sentiment.
---
🧠 Strategy Type:
Scalp/Intraday with momentum confirmation + demand zone logic.
---
📢 Are You Bullish or Still Bearish?
This could be a short-term push before bigger decisions from central banks. What’s your view?
💬 Drop your analysis below, and don't forget to like/follow if this helped your trading plan!
---
#EURUSD #ForexSignals #PriceAction #SupplyAndDemand #SmartMoney #OrderBlocks #Scalping #IntradayTrade #ForexStrategy #TradingView


EUR/USD | Smart Money is Watching This Level |Major Drop LoadingPrice entered a major institutional sell zone (blue shaded area) and got rejected hard. Classic sign of smart money distribution.
🔻 Short Bias activated while price trades below 1.14994.
---
🎯 Targets:
📉 TP1: 1.12325 – Previous structural support
📉 TP2: 1.09023 – Strong demand zone (orange area)
---
🧠 Why This Matters:
This move looks like a liquidity sweep above the highs, followed by a return to premium for smart money to short. Now price is compressing under resistance – possible redistribution in play.
---
🚨 High-Impact Events Coming:
3 major USD news releases are lined up around June 11.
This could be the catalyst to send EUR/USD plummeting toward demand.
---
✅ Trading Plan:
🔍 Watch for a bearish confirmation pattern (e.g. break of structure + lower high)
❌ No buys in the supply zone
🛑 Stop loss: Above 1.1500 (wick trap area)
✅ Sell setup is valid below that level
---
💬 Agree or Disagree?
Comment below 👇 with your view:
🔴 Bearish like me?
🟢 Or are you expecting a breakout?
📌 Don’t forget to LIKE ❤️ & FOLLOW for more institutional setups!
#EURUSD #SmartMoney #SupplyAndDemand #PriceAction #LuxAlgo #ForexAnalysis #SwingTrade #BearishBias #LiquiditySweep #ForexSignals

EURUSD: Short Trade Explained
EURUSD
- Classic bearish pattern
- Our team expects retracement
SUGGESTED TRADE:
Swing Trade
Sell EURUSD
Entry - 1.1398
Stop - 1.1449
Take - 1.1303
Our Risk - 1%
Start protection of your profits from lower levels
Disclosure: I am part of Trade Nation's Influencer program and receive a monthly fee for using their TradingView charts in my analysis.
❤️ Please, support our work with like & comment! ❤️

CHECK EURUSD SIGNALS READ CAPTAIN EURUSD Buy Limit Zone
TRADE
entry point 1.13722
Take profit Target 1.14783
Stop loss 1.13425
Follow money Menagment

EURUSD Expected Growth! BUY!
My dear followers,
I analysed this chart on EURUSD and concluded the following:
The market is trading on 1.1395 pivot level.
Bias - Bullish
Technical Indicators: Both Super Trend & Pivot HL indicate a highly probable Bullish continuation.
Target - 1.1419
About Used Indicators:
A super-trend indicator is plotted on either above or below the closing price to signal a buy or sell. The indicator changes color, based on whether or not you should be buying. If the super-trend indicator moves below the closing price, the indicator turns green, and it signals an entry point or points to buy.
Disclosure: I am part of Trade Nation's Influencer program and receive a monthly fee for using their TradingView charts in my analysis.
———————————
WISH YOU ALL LUCK

project
project to see what goes on with my pairs.project to see what goes on with my pairs.project to see what goes on with my pairs.project to see what goes on with my pairs.project to see what goes on with my pairs.project to see what goes on with my pairs.project to see what goes on with my pairs.project to see what goes on with my pairs.project to see what goes on with my pairs.project to see what goes on with my pairs.project to see what goes on with my pairs.project to see what goes on with my pairs.project to see what goes on with my pairs.project to see what goes on with my pairs.project to see what goes on with my pairs.project to see what goes on with my pairs.project to see what goes on with my pairs.project to see what goes on with my pairs.project to see what goes on with my pairs.project to see what goes on with my pairs.project to see what goes on with my pairs.project to see what goes on with my pairs.project to see what goes on with my pairs.project to see what goes on with my pairs.project to see what goes on with my pairs.project to see what goes on with my pairs.project to see what goes on with my pairs.project to see what goes on with my pairs.project to see what goes on with my pairs.project to see what goes on with my pairs.project to see what goes on with my pairs.project to see what goes on with my pairs.project to see what goes on with my pairs.project to see what goes on with my pairs.project to see what goes on with my pairs.project to see what goes on with my pairs.project to see what goes on with my pairs.project to see what goes on with my pairs.project to see what goes on with my pairs.project to see what goes on with my pairs.project to see what goes on with my pairs.project to see what goes on with my pairs.project to see what goes on with my pairs.project to see what goes on with my pairs.project to see what goes on with my pairs.project to see what goes on with my pairs.project to see what goes on with my pairs.project to see what goes on with my pairs.project to see what goes on with my pairs.
EURUSD Sell analysis/ideaThis trade/analysis is based on the Daily and 4-hour timeframes and executed using reversal trading and trend formation. Complete explanation in the video!

Long EURUSDThere is still bullish momentum in higher time frame although smaller TF show a retracement. Consider longing from the marked point.
EURUSD Buy the next dip and target 1.17700The EURUSD pair has been trading within a Channel Up pattern and is currently on its 2nd Bullish Leg that hasn't yet been completed.
It does print an identical price action to the 1st Bullish Leg of the pattern, having already made its first pull-back near the 0.382 Fibonacci retracement level and is now rising for the 2nd rejection.
Our plan is to buy the next dip and target 1.17700, which is the -0.136 Fibonacci extension, the level where the 1st Bullish Leg topped.
-------------------------------------------------------------------------------
** Please LIKE 👍, FOLLOW ✅, SHARE 🙌 and COMMENT ✍ if you enjoy this idea! Also share your ideas and charts in the comments section below! This is best way to keep it relevant, support us, keep the content here free and allow the idea to reach as many people as possible. **
-------------------------------------------------------------------------------
Disclosure: I am part of Trade Nation's Influencer program and receive a monthly fee for using their TradingView charts in my analysis.
💸💸💸💸💸💸
👇 👇 👇 👇 👇 👇
