I'm selling EURUSD, TOP is in!EURUSD is bearish now. Yes the trend is bullish, I know but I'm entering base on 15 mins BOS.
If you can gamble, this is a beautiful trade. When we see confirmation on a 4hrs timeframe, we enter more
EURUSD_TOM trade ideas

Fundamental Market Analysis for June 26, 2025 EURUSDThe EUR/USD pair continues to rise to 1.16800 during Thursday's Asian session. The US dollar (USD) is weakening against the euro (EUR) as investors worry about the future independence of the US Federal Reserve (Fed). Final data on US GDP growth for the first quarter will be in focus later on Thursday.
US President Donald Trump said on Wednesday that he is considering three or four potential candidates to replace Fed Chairman Jerome Powell. According to the Wall Street Journal, Trump may consider former Fed Governor Kevin Warsh, National Economic Council Director Kevin Hassett, and Treasury Secretary Scott Bessent. Other candidates include former World Bank President David Malpass and Fed Governor Christopher Waller.
This raises questions about a potential weakening of the Fed's independence and a possible decline in its authority, which undermines the dollar and creates favorable conditions for the major currency pair.
Across the Atlantic, European Central Bank (ECB) policymakers are concerned about the economic outlook due to Trump's tariff policy and geopolitical risks. Earlier this week, ECB policymaker François Villeroy de Galhau said that despite current conditions, further rate cuts are still possible. Statements by ECB policymakers may put pressure on the single currency in the near term.
Trading recommendation: BUY 1.16750, SL 1.16300, TP 1.17500
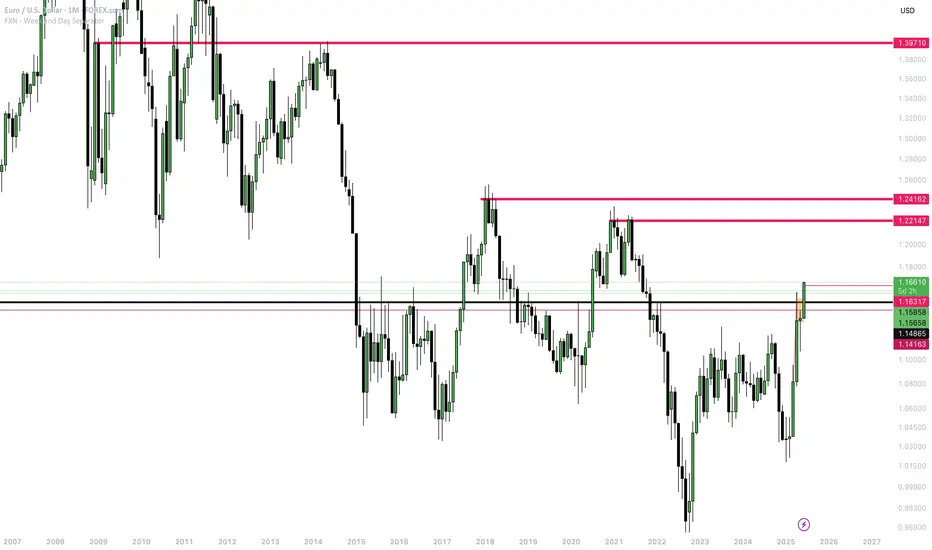
EURUSD For A Long BuyThe EURUSD broke out to the previous resistance level of 1.16317
The next resistance level is 1.22147. weaknesses and instability in the US Economy and its involvement in the Iran-Israeli war, which has resulted in uncertainty (geopolitical risk) among investors.
A Bullish flag pattern on the Daily Timeframe confirmed the break from the previous support, and fueled by the statement above, the Bullish flag pattern will continue to the resistance level 1.22147.
The 1.24162 level could serve as a resistance level if 1.22147 were to turn into support.
The highest level, 1.39710, is a level to watch out for, in the long term, if buying continues.
Conclusion: Current objective is a Buy to 1.22147.
EURUSD – Signs of Weakness, Risk of Trendline BreakEURUSD is showing signs of weakness after a strong rejection at the 1.16300 resistance zone — a level that previously acted as a distribution area. Despite a brief rebound driven by mixed PMI data, the Euro failed to maintain its momentum and is now turning lower.
If price breaks below the support zone around 1.15400 — which aligns with both the trendline and an old FVG — a deeper decline toward the 1.15000 level could be triggered. Continued failure to surpass the 1.16300 resistance would further strengthen the corrective pressure.
On the fundamental side, expectations for the ECB to hold rates steady and weaker-than-expected Eurozone data are dampening the Euro’s outlook. Meanwhile, the US Dollar remains firm on safe-haven demand, with upcoming US GDP and Core PCE data likely to drive short-term direction.

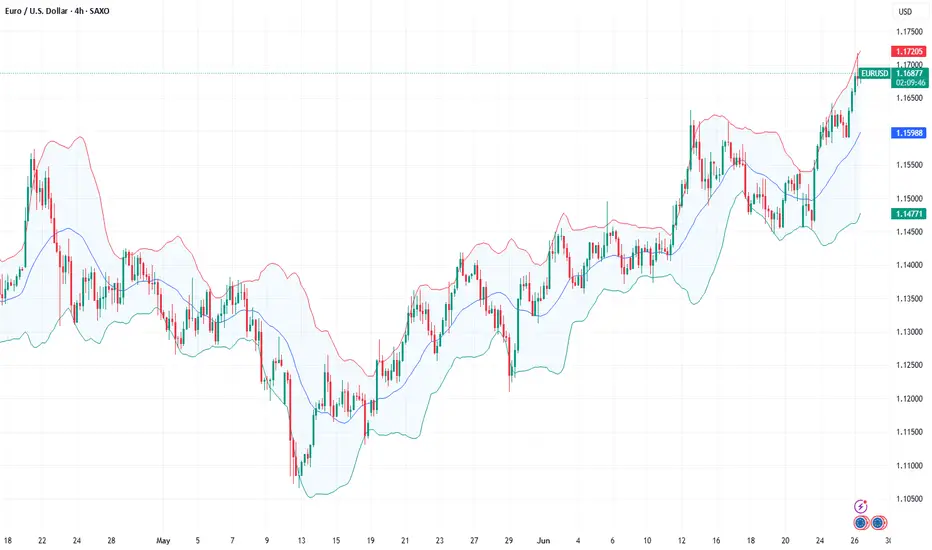
EURUSD Sell signal at the top of the Channel Up.Last time we analyzed the EURUSD pair (June 23, see chart below) we gave a strong buy signals at the bottom of the 1.5-month Channel Up:
The price is almost near our Target but since it's been consolidating for so many 4H candles on the pattern's top, it is better to take the good profit and turn bearish.
The 0.5 Fibonacci retracement level has been a solid target for the previous two Bearish Legs, but since the last one bottomed just above it on the 4H MA100 (green trend-line), we will place the Target a little higher this time also at 1.16100.
-------------------------------------------------------------------------------
** Please LIKE 👍, FOLLOW ✅, SHARE 🙌 and COMMENT ✍ if you enjoy this idea! Also share your ideas and charts in the comments section below! This is best way to keep it relevant, support us, keep the content here free and allow the idea to reach as many people as possible. **
-------------------------------------------------------------------------------
Disclosure: I am part of Trade Nation's Influencer program and receive a monthly fee for using their TradingView charts in my analysis.
💸💸💸💸💸💸
👇 👇 👇 👇 👇 👇

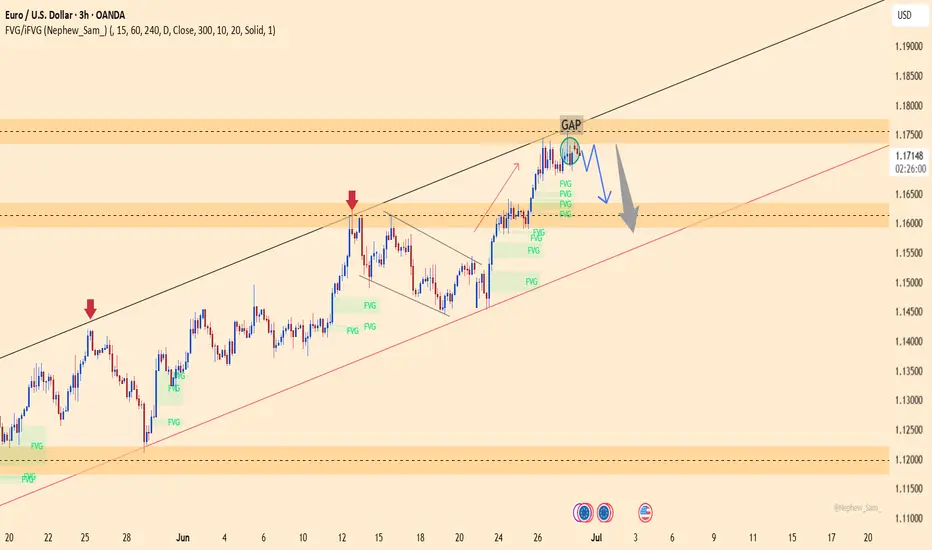
EURUSD – Bearish Pressure IntensifiesEURUSD is currently facing rejection at the GAP resistance area near 1.17350, combined with a lower high structure forming within the ascending channel. Price action shows clear signs of weakness after filling the GAP, and the aligned FVG zones below suggest a potential for deeper downside.
If the price remains capped below 1.17350, there is a high probability of a pullback toward the 1.16300 support area — which aligns with the long-term ascending trendline. A break below this level could extend the bearish move toward the deeper region near 1.14500.
Supporting Fundamentals:
Strong US Core PCE → reinforces expectations that the Fed will keep rates higher for longer.
Weak EU manufacturing PMI → puts pressure on the euro.
FOMC minutes and NFP — if hawkish — could strengthen the USD and weigh further on EURUSD.
EUR/USD Wave 5 Topped? Correction Incoming to 1.076FX_IDC:EURUSD PEPPERSTONE:EURUSD OANDA:EURUSD
📈 Chart Breakdown
🔢 Elliott Impulse Wave Completed:
Waves (1) to (5) appear to form a clean 5-wave impulse structure upward.
Final wave (5) is diverging on the oscillator (RSI), signaling potential bullish exhaustion.
🧾 ABC Correction Expected:
After the 5-wave impulse, you project an ABC corrective move:
Wave A: initial drop
Wave B: partial recovery
Wave C: deeper move likely toward the 1.07680 support (blue horizontal line)
⚠️ Bearish RSI Divergence:
The label "Div" confirms bearish divergence between price and RSI → typical at end of Wave (5).
🧠 Summary:
Structure: 5-wave impulse + projected 3-wave correction
Bias: Short-term bearish targeting 1.07680
Confirmation: Look for break below support or trendline + momentum shift

EURUSD I Monday CLS I Model 1Hey, Market Warriors, here is another outlook on this instrument
If you’ve been following me, you already know every setup you see is built around a CLS Footprint, a Key Level, Liquidity and a specific execution model.
If you haven't followed me yet, start now.
My trading system is completely mechanical — designed to remove emotions, opinions, and impulsive decisions. No messy diagonal lines. No random drawings. Just clarity, structure, and execution.
🧩 What is CLS?
CLS is real smart money — the combined power of major investment banks and central banks moving over 6.5 trillion dollars a day. Understanding their operations is key to markets.
✅ Understanding the behavior of CLS allows you to position yourself with the giants during the market manipulations — leading to buying lows and selling highs - cleaner entries, clearer exits, and consistent profits.
📍 Model 1
is right after the manipulation of the CLS candle when CIOD occurs, and we are targeting 50% of the CLS range. H4 CLS ranges supported by HTF go straight to the opposing range.
"Adapt what is useful, reject what is useless, and add what is specifically your own."
— David Perk aka Dave FX Hunter ⚔️
👍 Hit like if you find this analysis helpful, and don't hesitate to comment with your opinions, charts or any questions.

EURUSD @ MAJOR SUPPLY ZONE, IS IT TIME FOR SELLERS TO TAKE OVERIn this 15m chart we have MAJOR SUPPLY AREA around 1.1723
SMALL TIME FRAME we can see heavily been REJECTED @ this SUPPLY AREA & now we kinda form DOUBLE TOP FORMATION (keep in mind DOUBLE TOP not Valid till we BREAK NECK around 1.169)
My plan to take this in once we BREAK DOUBLE TOP NECK LINE AND RETESTED, OR EVEN BETTER GO IN AFTER UP WARD TREND BROKEN
Still i have my eye on 1.113 but as usual will close some along the way
I will update once im in
Thanks

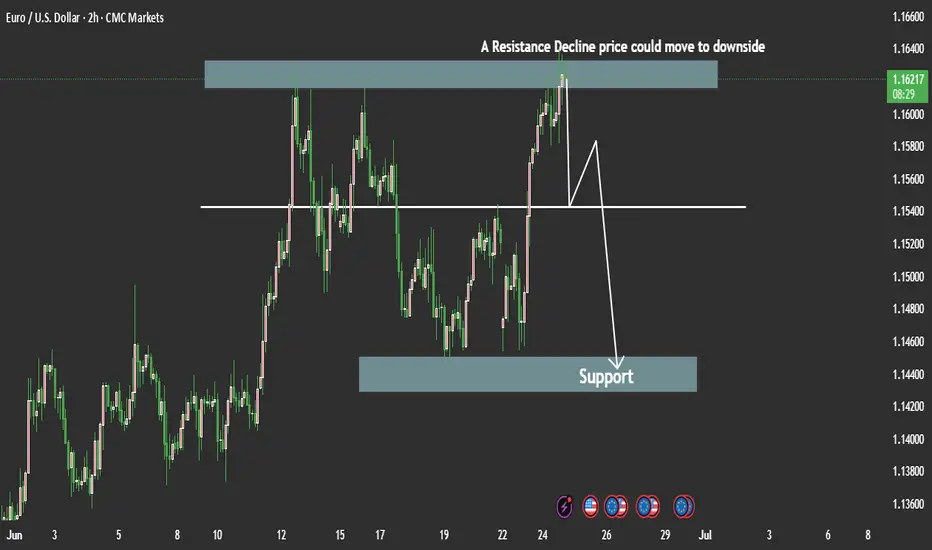
HelenP. I Euro will break resistance level and continue to fallHi folks today I'm prepared for you Euro analytics. On this chart, we can see how price initially moved inside a triangle formation, forming higher lows from the trend line and testing the resistance zone multiple times. Eventually, price broke out to the downside, falling sharply and breaking through the lower boundary of the triangle and also the trend line, signaling a shift in market sentiment. After touching the support zone and forming a temporary bottom, the pair started climbing back up, but this movement was more of a correction than a trend reversal. Price respected the trend line from below and followed it upward, but failed to break significantly higher. It managed to push above both support 2 and support 1 levels, which now act as resistance. Currently, EURUSD is trading inside the resistance zone, where previous reactions have led to strong bearish impulses. Given this behavior and the recent false breakout, I expect the price to rebound from this area and break back below support. My goal is set at 1.1350, anticipating further downside movement as the bearish structure remains valid. If you like my analytics you may support me with your like/comment ❤️
Disclaimer: As part of ThinkMarkets’ Influencer Program, I am sponsored to share and publish their charts in my analysis.

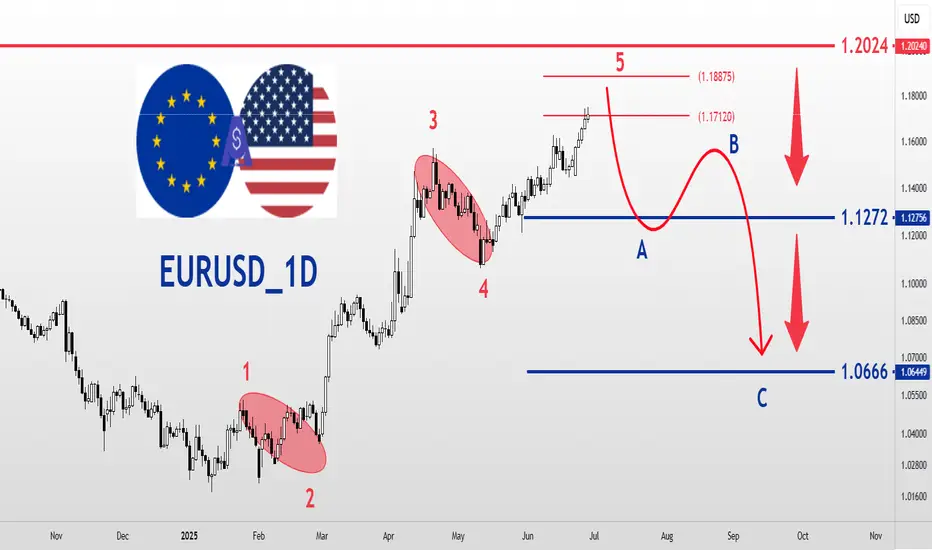
EURUSD_1D_SellEURUSD Analysis Daily Time Frame Medium and Long Term Elliott Wave Analysis Style EUR is at the end of Elliott Wave 5 and is a sell position. Last resistance 1.2024 Downward targets 1.1272 and 1.0666 respectively
Eurusd 4hr Chart Analaysis EUR/USD is entering a mild bearish correction or pullback phase, which may continue until it reaches the key support levels around 1.14272 – 1.13693. From this zone, there is a strong possibility that the pair could resume its bullish trend. Good luck!

EUR/USD short: The markets are finally ignoring the noise. Hello traders
I have taken a break from trying to trade this chaotic mess we have witnessed over the last few months.
Liberation Day, Big Beautiful Bill, the Middle East as volatile as ever, Iranian nukes destroyed, etc. etc.
On the domestic USA front we have also witnessed daily headlines of the Trump administration being sued, anti-immigration campaign promises being fulfilled, the Judicial system being undermined, for the Love of God, the President of the United States of America saying that he will have to check with his lawyers if he should observe the constitution. And...the independence of the FOMC being threatened on a daily basis. So much for law and order.
Smoke and mirrors, folks. Distractions and chaos.
But the technical indicators never lie. The indicators also reflect the true fundamentals.
In this case, USA inflation is heading higher again. keep an eye on tomorrow's CPE print. Labor market seems OK for now. Therefore, the two projected rate cuts by the FOMC for 2025 have already been priced into the DXY and US 10Y yield. No amount of bullying or public pondering who Chair Powell's replacement will be, can change the fundamentals. Inflation is rearing it's ugly head again. Gold and Bitcoin are both showing daily dojis.
The EUR/USD has already turned down from the 0.786% Fibonacci and there is clear divergence between price and RSI. The parallel up channel also seems to confirm an impending downturn in EUR/USD.
I did initiate a short EUR/USD position at 1.1688 and my entry order to add to the position at 1.1740 just shy of the 0.786% Fibonacci was also fulfilled.
Best of luck all.

Impulse completed?EUR/USD maintains its bullish trend intact after a sharp rally last week. The pair keeps consolidating gains as the 4-hour Relative Strength Index pulls back from overbought levels and price action is constrained within a 70-pip range, right below a nearly four-year high at 1.1750.
Today, price hit upside target at the 161.8% Fibonacci extension level of the June 10-12 rally at 1.1795. I Think we might see a correction for the eurusd as the impulse seems to be completed.

SHORT ON EUR/USDEUR/USD has a rising wedge within a consolidation zone.
The dollar looks like it will rise which will cause this pair to fall.
I will be selling EU looking to catch 150-300 pips this week.

SELL FIBERAfter yesterdays stop out we are at it again, we believe EURUSD bears will step in at current prices. Our sell entry is at 1.17100 our TIGHT stop loss is at 1.17500 and target is as low as 1.14500 . Use proper risk management and always risk what you can afford to loose. Cheers gang

Short for the next swing low.Is EURO bull run gonna end?
ECB vs Fed Policy Paths
Federal Reserve officials are divided but generally more cautious about cutting rates soon. In mid-June the Fed held rates steady at 4.25–4.50% and forecast only two 25bp cuts in 2025
Chair Powell warned of “meaningful” inflation coming from U.S. tariffs
implying cuts may be delayed. Indeed, Fed Governor Bowman recently said she would support a rate cut “as soon as” the July meeting if inflation remains contained
highlighting internal debate. In contrast, the ECB has already started lowering rates. After its June 5 decision to cut 25bp to 2.0%, Goldman Sachs analysts see two more ECB cuts (bringing deposit rates toward ~1.5% by year-end)
As one strategist noted, “market pricing now shows a big gap between ECB and Fed rate cut expectations…Fed remains hamstrung by inflation,” keeping U.S. yields relatively high
a stickier Fed (fewer cuts) versus a more dovish ECB (more cuts) would favor USD strength and EUR weakness.
Geopolitical and Eurozone Risks
Europe’s two largest economies face looming elections and weak coalitions. Fitch Solutions notes “Germany is set to hold early elections in February 2025” complicated by far-right gains, while France “is currently being governed by a weak coalition” with rising debt risks
Such instability can undermine confidence in the euro.
Slow growth: Eurozone growth is sluggish. After a 0.2% contraction in Germany, Fitch warns that “Germany and Italy weighing on aggregate growth forecasts” in 2025
Anemic output makes the euro vulnerable, especially if the U.S. economy outperforms.
Labor market tightening: Euro-area unemployment is low (~6.3%), but conditions are “unjustifiably tight” given the weak economy
Any economic slowdown could quickly raise Eurozone joblessness, pressuring the euro.
Trade/tariff risks: A return to U.S. protectionism (e.g. renewed tariffs) could hit European exporters. Trump presidency could strain EU–US relations and dent demand for Eurozone exports
Even talk of fresh tariffs tends to boost the safe-haven dollar over the euro.

EURUSD: at key resistance: Will price rebound to 11300?Quick recap on EURUSD, seriously déjà vu of my previous analysis on EURUSD - once again we see the price coming towards the same resistance level. This is a level where it has struggled to break through and reversed nicely to the downside as expected. For me it's definitely one to monitor, especially for anyone considering short trades.
If we start seeing signs that the price is getting rejected here: like long wicks, bearish candles, or buyers starting to lose momentum, I think we could see a move down toward the 1.11300 level. I am targeting a slight bounce like before, nothing major. But if price cleanly breaks out, that would rule out the bearish outlook and suggest even further upside will follow.
This area is pretty important and could give us a better idea of where price is headed next.
Just sharing my thoughts on support and resistance, this isn’t financial advice. Always confirm your setups and manage your risk properly.

EURUSD Technical Outlook Bearish TrendEURUSD Technical Outlook – 4H Timeframe
EURUSD has been pushing higher over the past few sessions, reaching a key liquidity zone. On the 4-hour chart, we’ve observed a clean sweep of previous highs, indicating a potential liquidity grab.
From this zone, there's a high probability of a downside move, especially if the price fails to sustain above this level. Any bounce from this zone that lacks momentum may signal bullish exhaustion, opening the door for sellers to step in.
Resistance zone 1.16500
Support zone 1.14500
You may find more details in the chart Ps Support with like and comments for more analysis Thanks.
Euro can fall to support area and then rebound upHello traders, I want share with you my opinion about Euro. Observing this chart, we can see how the price, after a period of sideways trading, the price started to grow gradually and formed a consistent bullish structure. The trend was supported by regular bounces from the support line, confirming the bullish sentiment. At some point, price made a temporary drop below the support area, but this move was short-lived; bulls quickly stepped in, and the pair recovered. After that, EURUSD returned back into the channel and began forming higher highs and higher lows again, confirming the continuation of the trend. Right now, the price is declining slightly and approaching the support area again, which is located between 1.1455 and 1.1430. This zone has shown itself as a strong support during previous moves and is now being retested from above. Given the current structure and the upward channel in play, I expect the Euro to rebound from this support area and continue growing toward the 1.1580 points - that’s my current TP 1. Please share this idea with your friends and click Boost 🚀
Disclaimer: As part of ThinkMarkets’ Influencer Program, I am sponsored to share and publish their charts in my analysis.

Market Insights with Gary Thomson: 30 June - 4 JulyMarket Insights with Gary Thomson: Eurozone Inflation, US Jobs, ISM PMIs, ECB Forum Updates
In this video, we’ll explore the key economic events, market trends, and corporate news shaping the financial landscape. Get ready for expert insights into forex, commodities, and stocks to help you navigate the week ahead. Let’s dive in!
In this episode, we discuss:
— Euro Area Inflation Rate YoY Flash
— US Nonfarm Payrolls and Unemployment Rate
— US ISM Manufacturing and Services PMI
— ECB Forum on Central Banking
Note: U.S. markets may see thin trading ahead of the 4 July holiday, raising volatility risks.
Don’t miss out—gain insights to stay ahead in your trading journey.
This video represents the opinion of the Companies operating under the FXOpen brand only. It is not to be construed as an offer, solicitation, or recommendation with respect to products and services provided by the Companies operating under the FXOpen brand, nor is it to be considered financial advice.


CHECK EURUSD SIGNAL READ CAPTAINeurusd ) sell zone
( trade satup)
entry point (1.17900) to (1.17800) 📊
first tp (1.17500)📊
2nd target (1.17100) 📊
last target (1.16800) 📊
stop loss (1.18200)❌
