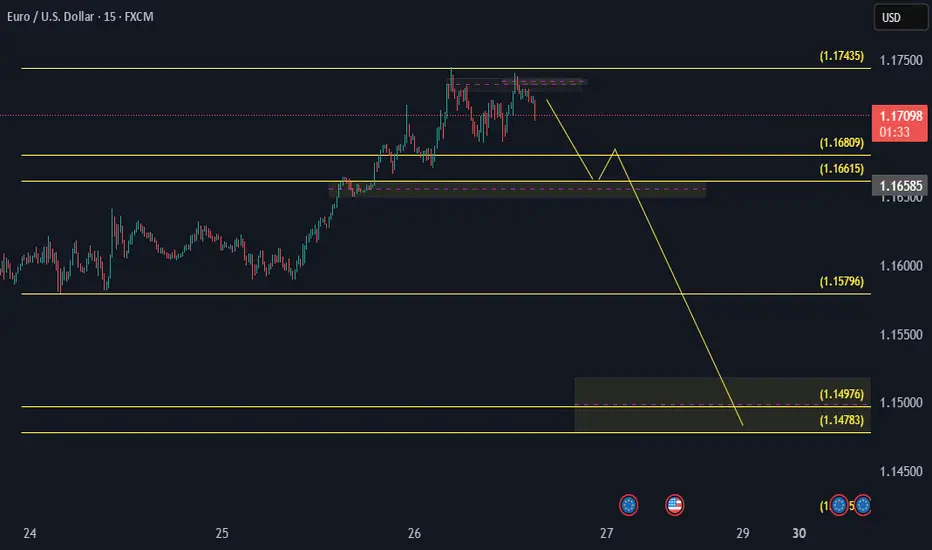
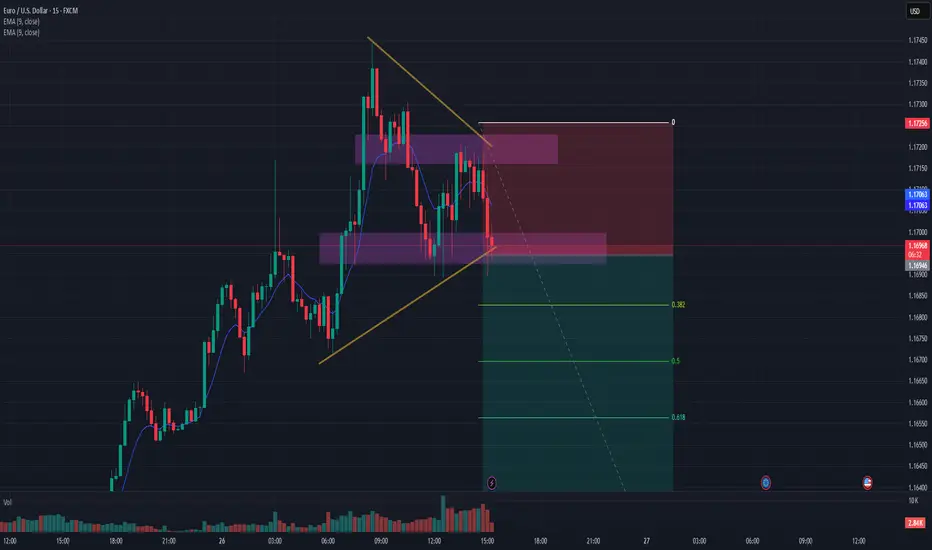
EURUSD SHORT TIME O LOSS TIMEI opened a long position on the EURUSD pair at 1.17195 with 10 lots.
Target: 1.174 – If the target is reached, I will take profit and open a short position.
At the same time, expecting USD weakness, I also opened a short position at 1.17200 with 20 lots.
1.168 to 1.166 is a strong support zone.
If price reaches 1.174 and I have an active short, I will close the 1.17200 short and keep the other one.
Targets and support levels are marked on the chart – I plan to close the positions gradually.
I will close 75% of the position at the 1.149 support level.
This is a demo account – I’m practicing in order to qualify for a funded trading account.
Depending on my success rate, I plan to start trading live on Forex.
EURUSD_TOM trade ideas
Back to low?The EUR/USD has been moving in a tight range around 1.1600 on Tuesday's European session, buoyed by a risk appetite, despite accusations of ceasefire violations in the Middle East. The pair had jumped about 1.30% from the previous day's lows following the announcement of a truce in the Middle East and holds gains with all eyes on the Federal Reserve's (Fed) Chairman Jerome Powell's testimony to Congress.
A confirmation below 1.15798 level would cancel the bullish view and bring the June 19 and June 22 low at 1.1445 back to the focus.

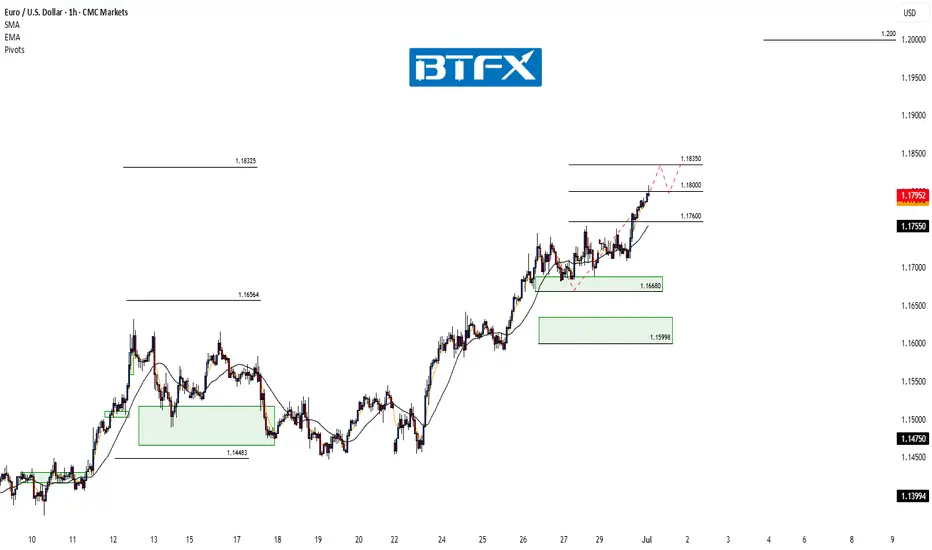
EUR/USD Extends Rally – Watching Resistance at 1.18000Hi Everyone,
We anticipated a retest of the 1.17400 level coming into this week, setting the stage for further upside toward our highlighted targets at 1.17600 and 1.18000. Monday delivered, with a sharp move higher that saw EUR/USD break cleanly above 1.17400 and extend to 1.17600, bringing the 1.18000 level into focus.
As previously noted, we expect dynamic resistance around the 1.18000 area and will provide further updates on the projected path for EUR/USD should price test or breach this level.
The longer-term outlook remains bullish, with expectations for the rally to extend towards the 1.2000 level, provided the price holds above the key support at 1.10649.
We will continue to update you throughout the week with how we’re managing our active ideas and positions. Thanks again for all the likes/boosts, comments and follows — we appreciate the support!
All the best for a good end to the week. Trade safe.
BluetonaFX
CHECK EURUSD SIGNAL READ CAPTAINsell Setup)
Entry Zone: Around 1.17200 \1.17150
Stop Loss: 1.17400
Take Profits:
TP1: ~1.17000
TP2: ~1.16750
Final Target: 1.16550

EURUSD POSSIBLE FINAL STAGE FOR BULL AND BEAR TAKING OVERIn this 15m chart we have MAJOR WEEKLY/DAILY RESISTANCE SUPPORT area around 1.1653
I wait to see if we close below that and get out of this UP-WARD CHANEL
If all this mate i will take sell below 1.1642 and Main target will be 1.113 but as usual will close some along the way
I will update once im in
Thanks

EURUSD Under Pressure! SELL!
My dear subscribers,
My technical analysis for EURUSD is below:
The price is coiling around a solid key level - 1.1726
Bias - Bearish
Technical Indicators: Pivot Points High anticipates a potential price reversal.
Super trend shows a clear sell, giving a perfect indicators' convergence.
Goal - 1.1612
My Stop Loss - 1.1783
About Used Indicators:
By the very nature of the supertrend indicator, it offers firm support and resistance levels for traders to enter and exit trades. Additionally, it also provides signals for setting stop losses
Disclosure: I am part of Trade Nation's Influencer program and receive a monthly fee for using their TradingView charts in my analysis.
———————————
WISH YOU ALL LUCK

Bullish rise?The Fiber (EUR/USD) has reacted off the pivot and could rise to the 1st resistance.
Pivot: 1.1578
1st Support: 1.1278
1st Resistance: 1.1909
Risk Warning:
Trading Forex and CFDs carries a high level of risk to your capital and you should only trade with money you can afford to lose. Trading Forex and CFDs may not be suitable for all investors, so please ensure that you fully understand the risks involved and seek independent advice if necessary.
Disclaimer:
The above opinions given constitute general market commentary, and do not constitute the opinion or advice of IC Markets or any form of personal or investment advice.
Any opinions, news, research, analyses, prices, other information, or links to third-party sites contained on this website are provided on an "as-is" basis, are intended only to be informative, is not an advice nor a recommendation, nor research, or a record of our trading prices, or an offer of, or solicitation for a transaction in any financial instrument and thus should not be treated as such. The information provided does not involve any specific investment objectives, financial situation and needs of any specific person who may receive it. Please be aware, that past performance is not a reliable indicator of future performance and/or results. Past Performance or Forward-looking scenarios based upon the reasonable beliefs of the third-party provider are not a guarantee of future performance. Actual results may differ materially from those anticipated in forward-looking or past performance statements. IC Markets makes no representation or warranty and assumes no liability as to the accuracy or completeness of the information provided, nor any loss arising from any investment based on a recommendation, forecast or any information supplied by any third-party.

EUR/USD 4H CHART IDEA"EUR/USD is currently trading within a key price range, showing signs of consolidation after recent volatility. The pair is testing support near the 1.0700 level while facing resistance around 1.0800. A breakout from this zone could set the tone for the next directional move. Traders should monitor upcoming economic data from the Eurozone and the US, as it may trigger strong momentum either way. The trend remains neutral in the short term, awaiting a clear confirmation."
This is just an idea not financial advice.

Another RR2 Position On EURUSDThesis: EUR/USD is showing signs of exhaustion near the 1.1800 psychological resistance, with price rejecting the upper band of a recent range.
Entry: 🔻 Sell at 1.17883 (current price action confirms rejection)
Stop-Loss: 🔺 1.17943 – Above recent swing high and psychological resistance
Take-Profit: ✅ 1.17767 – Targeting the lower bound of the recent range and prior support
Risk-Reward Ratio: ~1:2 – High conviction setup with tight risk and extended downside potential

EURUSD: Strong Growth Ahead! Long!
My dear friends,
Today we will analyse EURUSD together☺️
The in-trend continuation seems likely as the current long-term trend appears to be strong, and price is holding above a key level of 1.16017 So a bullish continuation seems plausible, targeting the next high. We should enter on confirmation, and place a stop-loss beyond the recent swing level.
❤️Sending you lots of Love and Hugs❤️
Smart Money Concepts (SMC) principles.Smart Money Concepts (SMC) principles. Here’s a full breakdown of the chart and its annotations:
📊
Chart Details:
Pair: EUR/USD
Timeframe: 4-hour (H4)
Current Price: Around 1.16093 USD
🔍
Key Annotations & Zones:
🟫
Pink Zone (Supply/Resistance Area):
This area includes:
Accumulation
FVG (Fair Value Gap)
Price has recently entered and reacted from this zone.
🔼
Buy Side Liquidity:
Highlighted at the top of the range.
Price swept above recent highs to trigger buy stops (liquidity grab), possibly setting up for a reversal.
🔽
Sell Side Liquidity:
Marked below the previous consolidation range.
Price had previously dipped to collect sell-side liquidity before moving upward.
📈
Accumulation:
This phase occurred before the bullish breakout.
Suggests institutional buying or smart money positioning.
📉
FVG (Fair Value Gap):
Imbalance between buying and selling, typically gets filled.
Marked in the pink zone where price may return before continuing its move.
📌
Price Structure Analysis:
The chart shows a classic liquidity sweep setup:
Price grabs buy-side liquidity.
Enters a supply zone.
May return to fill the FVG.
Potential reversal or bearish reaction from this zone.
✅
Trading Implications:
Bearish Scenario:
Price may reject from the pink supply zone after the buy-side liquidity sweep, filling the FVG and possibly heading toward previous lows.
Bullish Scenario (less likely immediately):
If price holds above the pink zone, it could continue trending upward.

Euro's Surge on USD Weakness – Is 1.20 the Next Stop?EURUSD: Euro's Surge on USD Weakness – Is 1.20 the Next Stop?
Hello TradingView Community!
The EURUSD pair is currently commanding significant attention with its strong upward momentum.
🌍 Fundamental Highlights: Euro's Tailwinds & USD's Headwinds
The Euro has demonstrated notable strength, recently breaching the 1.17 mark to hit its highest level in over 3.5 years. According to ING, if this momentum holds, the next target could be 1.20, contingent on continued USD weakness.
The US Dollar faces considerable pressure following news that President Trump intends to name a successor to Fed Chair Powell soon, sparking concerns about the Fed's independence. Such speculation often leads to expectations of a more 'dovish' monetary policy, weakening the USD.
Adding to the Euro's support are the NATO agreement to increase defense spending targets to 5% and President Trump's seemingly "less aggressive" stance towards the EU.
In summary: Should USD depreciation persist, not only the Euro but other asset classes might also attract capital inflows, particularly given the ongoing uncertainties surrounding inflation risks and monetary policy.
📊 EURUSD Technical Outlook (H4/M30 Chart):
Our technical analysis of the EURUSD chart (image_b73298.png) confirms a clear and robust uptrend, characterized by successive higher highs and higher lows. The EMAs are in a bullish alignment, reinforcing this upward trajectory.
Upside Targets (Potential BUY Zones):
1.17807: The initial potential target if the bullish momentum continues.
1.18458: A higher target representing the next potential resistance zone.
Key Support Levels (Potential BUY Zones for pullbacks):
1.16070: A strong support level where demand could emerge after a correction.
An implied intermediate support around 1.166xx (visually suggested by price action between current levels and 1.16070) could also offer buying opportunities after minor pullbacks.
🎯 EURUSD Trading Plan:
BUY Zone 1 (Intermediate Pullback):
Entry: 1.16600 - 1.16700
SL: 1.16450
TP: 1.16800 - 1.17000 - 1.17200 - 1.17500 - 1.17807 - 1.18000 - 1.18300 - 1.18458
BUY Zone 2 (Strong Support):
Entry: 1.16070
SL: 1.15900
TP: 1.16200 - 1.16400 - 1.16600 - 1.16800 - 1.17000 - 1.17300 - 1.17600 - 1.17807 - 1.18458
SELL Zone (Consider only at upside targets with clear reversal signals):
Entry: 1.18458 (This is an upside target, but also a potential resistance for selling if strong reversal signals appear).
SL: 1.18600
TP: 1.18300 - 1.18000 - 1.17807 - 1.17500 - 1.17200 - 1.17000 - 1.16800
⚠️ Key Factors to Monitor:
Fed Leadership News: Any official announcements regarding the Fed Chair succession will trigger significant USD volatility.
Eurozone Economic Data: Upcoming inflation, GDP, and employment reports.
ECB Statements: The European Central Bank's stance on monetary policy.
Geopolitical Developments: Major tensions or agreements can influence market sentiment.
Trade smart and always manage your risk effectively! Wishing everyone a profitable trading day!

The Reversal We have Been Waiting For!Key level has been tapped, gap is still open to be filled at 1.11690.
Entry at 1.16912
SL above top wick
Black line at the low is tp1

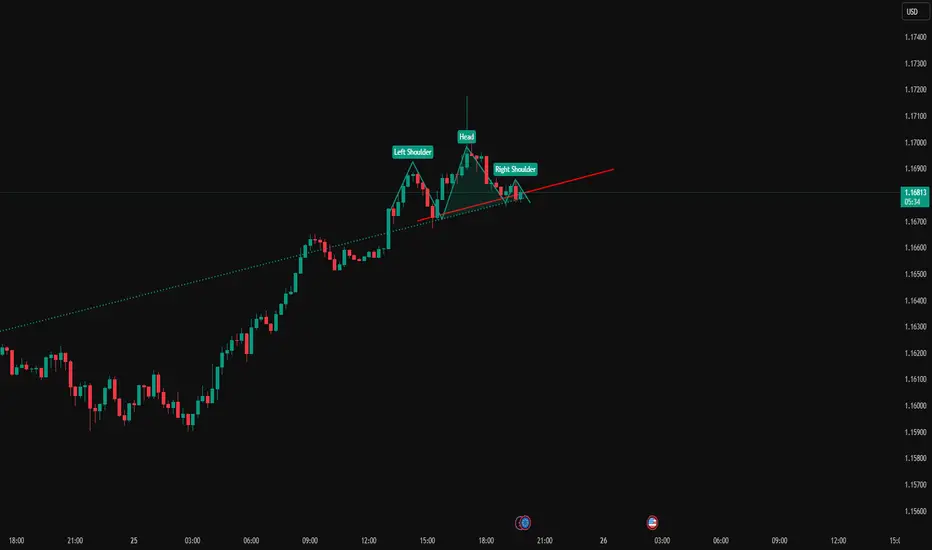
EURUSD Head And ShouldersEURUSD has created a normal head and shoulders pattern while reaching a HTF resistance on the weekly/daily. I expect this pattern to be a catalyst to a bearish movement.
EURUSD – Waiting for Deeper Liquidity Sweep into Extreme POIExpecting EURUSD to sweep liquidity below 1.1660 and drop into the Extreme POI (~1.1600–1.1640). Watching for lower timeframe reversal signals to go long. Targeting 1.1732 initially, extended target near 1.1790. Invalidation below 1.1580.

Summer VibesHello everyone, we a special shart movements in this month , things doesn't look bad as always, because falls and rises are always present in our life.
and opportunities comes in the rights moment..
Please make your studies before going for a random idea on the internet and trade at your own risk:
in this one, we can see the struggle of rising and we can see an Deja vu back flash into to past, the image is well clear then the written so enjoy.
thank you for leaving a comments.

EURUSD Technical Breakdown | Bearish Reversal Ahead?The Euro is showing signs of a potential major trend reversal after completing a strong rally within an ascending channel.
🔎 Chart Analysis:
Price surged out of a long consolidation range and followed a parabolic curve.
The pair reached the upper boundary of the ascending channel and started stalling.
Early signs of a distribution phase are visible, hinting at possible downside momentum.
📉 Bearish Scenario In Play:
A break below 1.1600 could accelerate the sell-off.
Key support zone at 1.14526 — potential first reaction level.
If momentum continues, next major support rests at 1.12329.
Short-Term Outlook:
Watch for breakdown confirmation below the channel.
Risk management is key; consider short entries on bearish candle confirmation.
💬 What’s your view? Are the bears finally taking over EUR/USD? Drop your thoughts below! 👇
#EURUSD #Forex #TechnicalAnalysis #PriceAction

EURUSD Elliott Wave Update: Upward Momentum ResumesThe EURUSD Elliott Wave sequence initiated from the September 2022 low reveals an incomplete bullish structure, signaling potential for further upside. A short-term rally from the May 29, 2025 low is currently unfolding as a five-wave impulse. As depicted in the 1-hour chart below, wave ((i)) peaked at 1.16319. A corrective wave ((ii)) followed which concluded at 1.14435. The internal structure of wave ((ii)) formed a zigzag pattern, with wave (a) declining to 1.1486 and wave (b) rebounding to 1.1614. Wave (c) completed the correction at 1.144, finalizing wave ((ii)) in the higher degree.
The pair has resumed its ascent in wave ((iii)), exhibiting an impulsive internal subdivision. From the wave ((ii)) low, wave i advanced to 1.1544, followed by a minor dip in wave ii to 1.1451. Wave iii surged to 1.1641, with a subsequent wave iv pullback ending at 1.1587. The final leg, wave v, culminated at 1.1745, completing wave (i) in the higher degree. A corrective wave (ii) pullback, likely a three-wave zigzag, appears to have concluded at 1.1678. However, a break above the wave (i) high at 1.1745 is required to negate the possibility of a double correction lower. Given the shallow nature of the wave (ii) pullback, the risk of a deeper correction remains. However, as long as the pivotal low at 1.144 holds, dips should attract buyers in 3, 7, or 11 swings, supporting further upside momentum.

EURUSD Will Move Lower! Short!
Please, check our technical outlook for EURUSD.
Time Frame: 15h
Current Trend: Bearish
Sentiment: Overbought (based on 7-period RSI)
Forecast: Bearish
The price is testing a key resistance 1.173.
Taking into consideration the current market trend & overbought RSI, chances will be high to see a bearish movement to the downside at least to 1.144 level.
P.S
Overbought describes a period of time where there has been a significant and consistent upward move in price over a period of time without much pullback.
Disclosure: I am part of Trade Nation's Influencer program and receive a monthly fee for using their TradingView charts in my analysis.
Like and subscribe and comment my ideas if you enjoy them!

Shorting Optimism: EUR/USD Rally vs RealityAfter the spike to 1.1640 driven by temporary ceasefire news and USD weakness, I’ve taken a short position on EUR/USD. The market priced in too much optimism too fast, and I see limited upside beyond this zone in the current macro landscape. I’m positioned for a controlled retracement back toward the 1.1460–1.1520 region.
The play? Fade the overextension, follow structure, and manage from strength.
Technicals:
• The pair ran into a strong supply zone near 1.1640, which aligns with a previous liquidity sweep.
• Momentum has slowed visibly on lower timeframes, with candles rejecting highs and wicks printing upper tails.
• Daily and 4H SMAs are overstretched. The 20 SMA on H4 is accelerating upward, but RSI is near overbought and flattening.
• My short entry was taken with a stop above 1.1745 and first target at 1.1540, second at 1.1500.
• A potential retest of the 1.1660 zone could offer additional entries if invalidation remains intact.
Fundamentals:
• ECB vs Fed Divergence: The Fed holds firm on rates amid sticky inflation, while the ECB is under pressure to ease further due to weak growth.
• EU Struggles: PMI data remains in contraction territory; HICP cooling to 1.7% YoY suggests little reason for tightening.
• Political Instability: Germany and France both facing internal political crises — risk premia rising.
• Ceasefire Priced In: EUR rally on Middle East headlines lacks depth — conflict paused, not resolved.
• USD Resilience: Weak recent data aside, the USD remains a safe haven. Fed’s Powell reiterated that cuts aren’t imminent.
⚠️ Bias: Bearish as long as price trades below 1.1640. Watching how the market reacts to Fed testimony and ECB rhetoric this week.
🧠 Reminder: Don’t get emotional after vertical rallies. When everyone gets excited, I look for exhaustion. That’s where trades begin.
Note: Please remember to adjust this trade idea according to your individual trading conditions, including position size, broker-specific price variations, and any relevant external factors. Every trader’s situation is unique, so it’s crucial to tailor your approach to your own risk tolerance and market environment.

EUR/USD 3-Year Highs Nears Fibo ResistanceThe Fibonacci retracement drawn from the 2021-2022 move in EUR/USD has continued to produce inflections in the pair. It caught the high in 2023 at the 61.8% retracement of 1.1275. And then last year, it set the low in April that led into a vigorous bounce into the end of Q3. Along the way, the 50% marker of that major move was a sticking point producing multiple inflections on both sides of the pair.
And then as EUR/USD came into 2025 sliding lower, it was the 23.6% retracement that came into play to catch the lows at the 1.0200 handle in January. In February, bulls held a higher-low just above that price and by March, prices were ready to jump-higher.
More recently it was the 61.8% retracement at 1.1275 that was back in the picture and with EUR/USD breaking out now to fresh three-year-highs, the look goes up to the next level in the Fibonacci sequence at 1.1686, which is the 76.4% retracement from that same major move.
Notably, EUR/USD is back into overbought territory on weekly RSI and there's also a rising wedge here, often approached with aim of bearish reversal. All that said, bulls are still making the push but if we do see a USD turn stage around quarter-end or the start of Q3, I think EUR/USD remains one of the more attractive venues to seek that out. Meanwhile, both GBP/USD and USD/CAD remain of attraction for USD-weakness to continue. - js

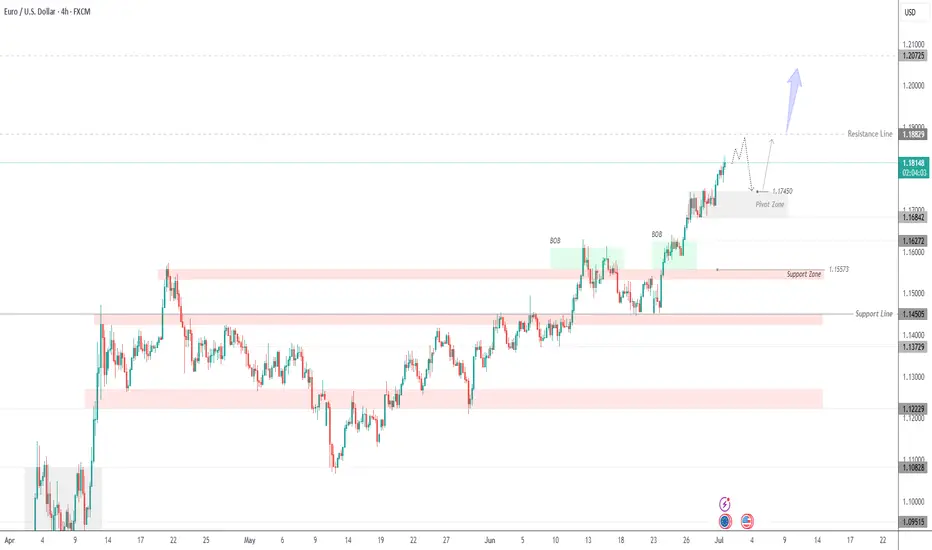
Euro Continues Bullish Trend | Eyes on 1.1882 & 1.2075EUR/USD – Strong Bullish Structure | Watching 1.1745 Pivot Zone for Reentry
The Euro continues to trade in a well-defined bullish trend, supported by institutional demand and clear price structure.
After breaking above the 1.1684 resistance zone, EUR/USD extended toward 1.1818 and now approaches the next resistance at 1.1882. This level may act as a temporary cap, but if breached with momentum, the pair could target the 1.2075 zone next.
Bullish Order Blocks (BOBs) marked on the chart highlight previous accumulation zones where buyers stepped in aggressively. These areas are still valid for demand-based pullbacks.
Key Area to Watch – 1.1745 Pivot Zone:
This level serves as a potential reentry point if the price retraces. As long as EUR/USD holds above this zone, bullish momentum remains intact. A confirmed bounce here could resume the uptrend toward 1.1882 and beyond.
However, a clean break below 1.1745 could open the door for a deeper correction toward 1.1627 or even 1.1557, which is the next major support zone.
Key Levels:
Resistance: 1.1882, 1.2075
Pivot Zone: 1.1745
Support: 1.1627, 1.1557