Opening A Small Position In FARTCOIN HereGood Morning Trading Family,
I may be a little early here, but at $1.00, I can't resist. I am picking up a small position in FARTCOIN here. I have three targets above. Each will eventually be hit IMO, but for now, I will only be shooting for TARGET #1. I may sell half at that point and let the rest ride.
Now, here are the technical reasons for making my entry here without waiting for my indicator to signal.
First of all, there are three trendlines, all significant, all converging at this one particular point, making this a powerful area of confluence!
Secondly, we broke to the topside of that descending trendline but never really came back to kiss mamma goodbye. Today we are doing that! This is a patent technical move that indicates healthy price fluctuation and is exactly what I have been waiting for.
Third, the VRVP indicates a ton of volume in this area (mostly buyer), which will be tough to break below without significant FUD, which, of course, is always a possibility.
Finally, all of my lower indicators show this thing is starting to get oversold: RSI, MACD, Chalkin MF, HA.
If we do dip lower, I will simply increase my position unless I hit my SL first. My SL is around .78 with my projected first target at 1.66 for a nice 1:3 rrr.
Good luck, all!
✌️Stew
FARTCOINUSD trade ideas

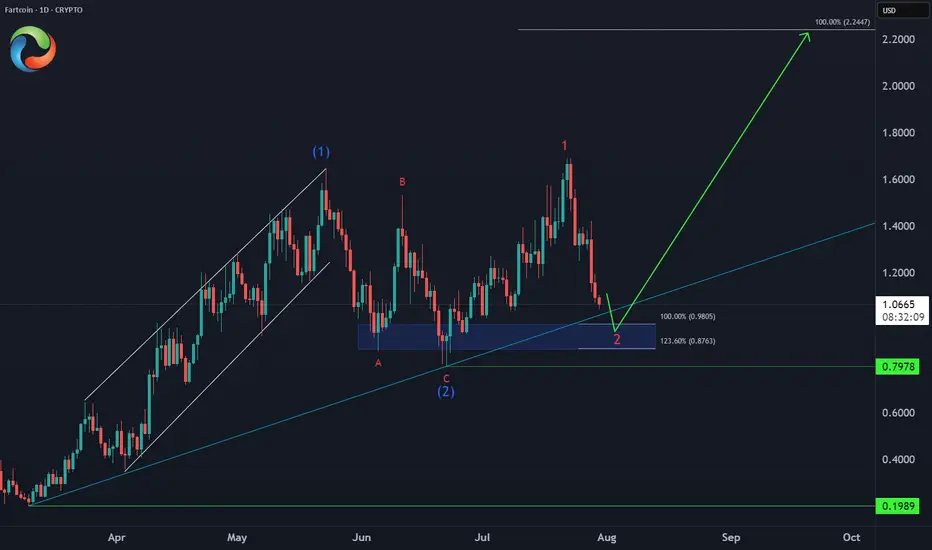
FARTCOIN Bullish Setup 📈 CRYPTO:FARTCOINUSD Entering an extreme buying area:
✅ Key support zone: $0.98-$0.87 (April trendline + equal legs)
⛔ Invalidation: $0.79
🎯 Target: $2.20 (124% upside)
This is how explosive meme setups look before liftoff.
Get Ready! Hot Air Rises. Fartcoin About To Break Wind.Trading Fam,
Our national debt is a meme. The buying power of our dollar is a meme. Our monetary system is a meme. The Fed is a ponzi scheme and a meme. Everything related to geopolitical economics has become a meme. We can't take any of this stuff seriously anymore. So, why not make a profit on the best memes of the day? Enter pungeant FARTCOIN. AI-created and managed, FARTCOIN is cutting loose with no reservations. And it looks like it is about to break wind again. They say hot air rises. Let's see how far this stink can go.
Let her rip!
Stew

Letting gas out of the fartcoin trade, back under $1Fart coin looks like shit. Looks to me like the gas has run out of this trade.
If we look at the chart, we can see that price has rejected resistance here and Heikin Ashi candles starting to show the bearish trend starting.
On top of that you have a massive head and shoulders top forming, which would be confirmed under $.88.
I think it's likely that we see the bottom supports get tagged from here.
Invalidation would be a break of $1.53.

FARTCOIN Bullish Reversal in Progress
CRYPTO:FARTCOINUSD 3-swing correction from the May peak appears complete, even though price didn’t quite tag the $0.75 entry zone.
Now, the spotlight’s on the bulls — can they deliver an impulsive rally off the lows to invalidate a potential double correction next month?

Long $FARTCOINThis is strictly for degenerates. I feel solana tokens are only worth the cumulative trading fees collected within locked and burned liquidity pools. They do have a fundamental value relative their value in solana. As far as what their value in dollars is... well that's probably not far from zero. That's a whole other discussion. This trade is not that. This trade is based on one thing...
Hot air rises.
Feel free to ignore this, or bash me all you want. I have purchased a small (for my net worth) amount of FARTCOIN and pooled it with Solana and USDC in multiple pools to collect trading fees and hopefully I come out with more Solana and USDC than I just pooled. My LP position is not locked. I will pull my LP when I feel like it. That's my position.

Textbook Cup and Handle Pattern on FartcoinThe crypto market has been rather lagging - in terms of performance - compared to other markets, as Bitcoin continues to range around the 100k range with every correction impacting altcoins to a higher degree.
However, I believe that a bullish rally for crypto is imminent, and within crypto, the memecoin sector, specifically, will outperform all other assets.
Macro Factors
- The possible end (or at least temporary halt) to the wars (Iran-Israel, Ukraine-Russia). History has proven that equity markets continue to rally regardless of ongoing wars, but given that we see the situation de-escalate, we could expect further attention and conviction towards risk-on assets.
- Fed's potential rate cuts in July. Fed Vice Chair for Supervision stated that if inflation remains tame, the Fed should begin lowering rates as soon as July (and it probably will). This will mark the end for quantitative tapering, and we'll begin to see massive liquidity flow back into the markets.
- GENIUS Act (Guiding and Establishing National Innovation for U.S. Stablecoins Act): Essentially, the United States government will allow cryptocurrency (stablecoins) use within their regulatory boundaries, as it aligns with their strategic interests. Entities like Circle purchase US Bonds as collateral for their USDC stablecoins, which means that it's a win for both the US government and cryptocurrency market participants. I believe that we'll see an inflow of capital into the cryptocurrency markets, through stablecoins, some of which, if not the vast majority, will flow into risk-on assets like memecoins.
Technical Analysis
- From a TA perspective, there are multiple memecoins that present a massive opportunity, one of which is Fartcoin.
- We can spot a textbook cup and handle pattern on the daily chart, after a whopping 90% drawdown from its all time highs.
- We are currently seeing the formation of a handle, which is presented through the descending parallel channel.
- Within the channel, there's also a textbook corrective ABC wave, as the ascending part of the cup has an impulse 12345 wave count.
- Applying textbook charting techniques on this chart, we can consider an upside to the same degree as the depth of the cup, which would teleport Fartcoin's price to $2.8 levels - a 160% upside from the current price.

FARTCOIN Loading The BeansCRYPTO:FARTCOINUSD after the initial bounce failed, the correction against the March low is still unfolding within a 3-swing Zigzag, targeting the equal legs zone at $0.75–$0.57 — where bulls are expected to step in for the next blast higher.
Load the beans!! Time to fart!! 💨

FARTCOIN is primed for a 3X move!🚀 CRYPTO:FARTCOINUSD April rally cooled off, buyers stepped in at the $1 - $0.75 extreme zone, and now wave (3) is gearing up for liftoff.
🎯Targeting $2.3 - $3.2—momentum is building fast!
Are you strapped in for the ride, or still watching from the sidelines?

fartcoin hit bear market relief rally resistancefartcoin hit bear market relief rally resistance
what i think happens next is a bear trap around 70-80c before new aths sometime Q3/Q4
$fartcoin #fartcoin

Fartcoin big shortThis is a classic altcoin macro SFP.
Daily wick, then it’s just gonna dump hard—breaking lows all the way down to sub-10 cents.
It’s all air anyway—just look at the damn name. Fartcoin. Enough said."

FARTCOIN prints an Evening Star Evening Star on the 4h could signal the end of the strange bull rally on this Memecoin. Barring any weekend tomfoolery, this could be a good spot for a short.
Not advice.

FARTCOIN - Bigly Time ShortPost Trump tariffs the stock indexes have printed ultra high volatility bearish shakeout patterns.
This is how crash structure often begins, and it looks like they are into the next major wave down.
This is being reflected in crypto where its become very bearish and some of these more silly coins may really crash and burn here.
...
FARTCOIN
Weak bounce to the 0.382 retracement.
This is a big whipsaw both on the day chart and also low time frame; similar to other charts I posted (client only).
The high time frame whipsaw prints a shakeout through resistance and that is also a high time frame Head & Shoulders pattern
But this one is very impulsive to the downside.
I'm not posting the bulk of my trade setups here on TradingView but I have selected this one for you guys - I think it is quite nice 👍.
I am recently short here ✨.
RIP hodlers ☠️.
Not advice.

Echo bubble for FartcoinHello friends.
I think that following a breakout from this accumulation area, Fartcoin will soon have an echo bubble that may go as high as $1.00 or even a little higher before the excitement starts to fizzle out again and prices begin falling. There are several things making me interested in this idea.
1) Smart money accumulation
According to Stalkchain, large and profitable traders have been buying recently and expecting the price to rise. Profitable traders are usually right so that is good news.
x.com
2) High volume and high mindshare
The coin regularly turns over it's entire market cap in volume, and has maintained the largest mindshare out of all the AI crypto coins which is favorable for long term growth and means that the attention of traders has not disappeared from this coin like it has for many others. This coin has been mentioned by a lot of famous people, which means it will continue to take up space in the minds of retail traders who will happily start buying if they see that the price is going up.

Fart is starting to recover.? Fart has dropped to the capitulation zone, but it looks like it has found the temporary floor and is starting to move to the upside.
If the a daily candle moves and closes above EMA 21, the top ascending trendline, and the previous weekly high, I might consider to swing trade. But Daily MACD needs to entered the bull zone and daily stochastic has to be not in the overbought territory.
What is going to happen to the crypto market all depends on the Bitcoin performance. Bitcoin is showing a sign of strength, however, it still has not taken the previous lower high. Until that happens, I will consider the market is still fragile and I will not be buying or trading any small cap coins like Fart.

FARTCOIN: Buy and sell strategy around the Channel Down.FARTCOINUSD is about to turn neutral on its 1D technical outlook (RSI = 43.244, MACD = -0.099, ADX = 22.114) as it is approaching the 4H MA50. This is a little under the top of the short term Channel Down and is where the last sell signal flashed. Consequently it is a technical sell entry to target near the S1 level (TP = 0.55000) but tight SL needed. The reason is that if it crosses over the top of the Channel Down, the sentiment will turn bullish and we will abandon shorts, turn to longs and aim for a +300% increase (TP = 2.000), same as the Jan 13th-19th bullish wave.
## If you like our free content follow our profile to get more daily ideas. ##
## Comments and likes are greatly appreciated. ##

Fart is below the critical zone, but ...The previous daily candle closed below the previous month's low as well as the long held ascending trendline. Both 5D and Weekly momentum indicators and price action are strongly bearish.
It seems that the current crypto market is heavily manipulated by market makers and it often happens on weekends when the volume is low. The price seems to drop sharply on Fri and Sat so I am being cautious with such price action and I have been avoiding opening and or closing a position on weekends. The Friday daily candle formed a big fat red candle below the critical zone, and it can trigger some people to panic sell. I might be wrong, but it seems manipulative move to me.
As I said in my previous article, I hold a small bag of Fart coins. I don't leverage trade. I allocate a small capital in various meme coins. My approach is if it goes to zero or clearly goes to zero, I accept my fate. But if it goes up, I take profit when negative divergence forms in either the 4H or daily chart.
Currently, the price is below the previous month low and below the trend line. However, the price reached Fib 0.786 and is hovering above that level. The price is at this stage holding that area. In my experiences, fib 0.236 and Fib 0.785 are quite stubborn areas for the price to penetrate. I look at these lines as the last line of defence for the bull and bear.
I will continue to observe how the price will behave in the area marked in the blue rectangular block in the chart. All momentums are bearish so it is not the time to be buying, or get involved in any way!
Do not buy the dip. If you are interested in investing in this asset, wait for the momentums to come back for the bull and buy the strength.

Simple trading idea for long position with RSI and FibI have a bag of Fartcoin. I am planning to hold it for a while, but there is one possible trade idea using RSI in the daily chart.
On Dec 8th, RSI lines cross to the upside in the bull zone and the price continue to go up until RSI lines reached the overbought territory and crossed to the downside. If you opened a long position at the close of Dec 8th's candle and closed at the close of Dec 20th's candle, the risk reward ratio was 1:3.
The same set up just appeared two days ago. RSI lines crossed in the bullzone. MACD lines have also crossed and the first green histogram appeared as well, which is pretty bullish.
If you are interested in swing trading it, you can open a long position now with stop loss just below the previous week low and profit target at $2.97. It will be a risk reward ratio of 1:3. You can also take profit in stages according to the Fib extension levels - 1.618, 2, 2.618 and 3.
It is just an idea.

Fart is starting to pop - buy? Fart just formed higher high in the daily chart. Stochastics (9,3,3) reached the overbought territory and are moving up. The price also closed and moved above the previous week mid.
The next hurdle for the bull is to move above the the previous higher high which is the previous month high at $1.30 area.
Daily MACD is in the bull zone and daily stochastics are resetting, which signals the upside momentums are building up.
The 4H MACD is entering the bullzone, but the only problem is 4H stochastic has already reached overbought territory. Once the stochastics comes down, resets and starts to move upwards, it might be a good area to open a long.
My general trading rules are below:
I use two time frames - weekly/daily and daily/4h.
1) MACD in the higher timeframe needs to be in the bull territory which is above 0. The angle of MACD is not important. It needs to be in the bull zone.
2) Stochastics (9,3,3) in the higher timeframe needs to reset and stochastics needs to cross and starts to move upwards. It cannot be in the overbought territory.
If these two conditions are met in the higher time frame, I go to the lower time frame to start looking for an exact entry point.
3) MACD lines in the lower timeframe properly cross and enter the bullzone or cross and move upwards above the bull zone. And ideally the stochastics in the lower time frame hasn't reached the overbought territory.

Fartcoin - it is a bit deflatedI was anticipating the price to continue to move up higher when it broke above the previous month high. However, I need to acknowledge that the daily RSI is showing a clear negative divergence. 4H MACD is also starting to dive into bear territory. RSI and Stochastic also are pointing downwards. The candle closed below 1.2932 zone (strong resistance/support level) and the recent 4h candle closed below the buy block.
It is still too early to conclude it is the start of the bear trend. The price is still travelling along the ascending trendline. I will wait to see what the price will do around $0.95 area where Fib 0.786 meets the trendline.
I intend to hold the tokens for this bull cycle. I won't be considering to sell the tokens or open a short position. I will just wait for an opportunity for re-entry. The blue rectangular area in chart might be the area of interest for re-entry. The most important condition for me personally is that I won't go long when MACD in 4H (time frame I am trading in) and Stochastic in Daily (time frame I get a confirmation from) are not moving upwards. The angles of these momentum indicators are very important in my experience.

Fartcoin - Fart is going to blast off The price has been consolidating since 21st Dec. Since 25th Dec, the price had been consolidating in the descending wedge pattern. It broke above it, retested, the top descending trendline and bounced back up. Now, the price is about to break previously week high. All momentum indicators in 4H and Daily are signalling the price to move up. ai16Z and Virtualprotocol both had the very similar set up in Daily chart before they had a parabolic leg up.
I think it is a good place to go long.
The profit target for me is $2. I don't trade with leverage.

Fartcoin ($FART): The Meme Coin Shaking the Crypto WorldIn a world of serious financial protocols and innovative blockchain technologies, Fartcoin ($FART) has emerged as a lighthearted yet lucrative contender in the cryptocurrency space. From its humble beginnings rooted in fart jokes to its current billion-dollar market cap, this Solana-based meme coin is making waves in the market. Let’s explore the fundamental and technical aspects driving its success.
A Billion-Dollar Market Cap Without Major Listings
Fartcoin ($FART) recently hit a market cap of $1.09 billion, a remarkable achievement considering it has yet to secure listings on major exchanges like Binance or Coinbase. The token’s popularity is largely driven by its unique "Gas Fee" system, where every transaction triggers a digital fart sound, and its ability to gamify the initial token distribution through user-submitted fart jokes and memes.
Trading Activity and Market Sentiment
The daily trading volume of $FART stands at $221.6 million, with Bitget leading the charge as the most active trading platform. The FART/USDT pair on Bitget alone has recorded a 24-hour trading volume of $21.9 million, showcasing significant liquidity and user interest. Despite a slight dip of 3.9% in trading activity, the token remains resilient in an otherwise bearish crypto market.
Performance Metrics
- All-Time High (ATH): $1.29 (December 20, 2024)
- Current Price: $1.09, reflecting a 15.1% dip from its ATH.
- All-Time Low (ATL): $0.02003 (October 30, 2024), marking a staggering 5,380.04% increase to its current price.
Fartcoin’s meteoric rise highlights its ability to outperform both the global crypto market (down 8.7%) and the meme coin sector (down 15.3%) in the last week, with a 19% price surge.
Circulating Supply and FDV
The circulating supply of 1 billion $FART tokens contributes to its fully diluted valuation (FDV) of $1.09 billion. With its emission schedule fully realized, the token has cemented its position as a leading meme coin.
Technical Analysis
As of now, $FART is trading 29.7% higher, demonstrating robust bullish momentum. The token is forming a bullish pattern that could pave the way for sustained upward movement.
Key Support and Resistance Levels
- Support: Immediate support is found at the 38.2% Fibonacci retracement level, which presents a strong buy zone for investors.
- Resistance: The token’s recent high of $1.29 serves as a key resistance level, and breaking past this point could open the doors to even greater heights.
Potential Long-Term Growth
Given its strong community backing and unique appeal, Fartcoin is poised for a potential rally to $3 in the long term. Its current trajectory suggests that investors could witness significant gains as the meme coin sector regains traction.
What’s Next for Fartcoin?
Fartcoin’s rise underscores the power of community-driven projects in the crypto space. With its playful branding, unique tokenomics, and strong market performance, $FART has positioned itself as more than just a joke—it’s a serious contender in the meme coin arena.
As the token awaits listings on major exchanges, its accessibility and adoption are likely to increase, further solidifying its position in the market. For now, investors are watching closely to see if $FART can maintain its bullish momentum and hit new all-time highs.
Conclusion
Fartcoin’s journey from meme to market leader showcases the evolving dynamics of the crypto space. Whether it’s the playful appeal of its "Gas Fee" system or its robust trading activity, $FART has proven that even the most unconventional ideas can find success in the world of blockchain. With strong fundamentals and a bullish technical outlook, Fartcoin might just be the breath of fresh air—or gas—that the meme coin market needs.

FARTCOIN Ready to Go Down?I usually don't cover highly speculative altcoins like CRYPTO:FARTCOINUSD but when I looked at the chart, it looked a clean 5 wave up complete. It looks ready to begin the correction from here. Difficult to say how this correction would unfold, i.e. ABC, WXY, WXYXZ. It should do a minimum of 38.2% retracement of the whole rise, though I would be open to much bigger correction (>50%).
Having said that, exercise caution given the highly speculative nature of this coin. This view gets invalidated if the high of 0.92305 is breached.
