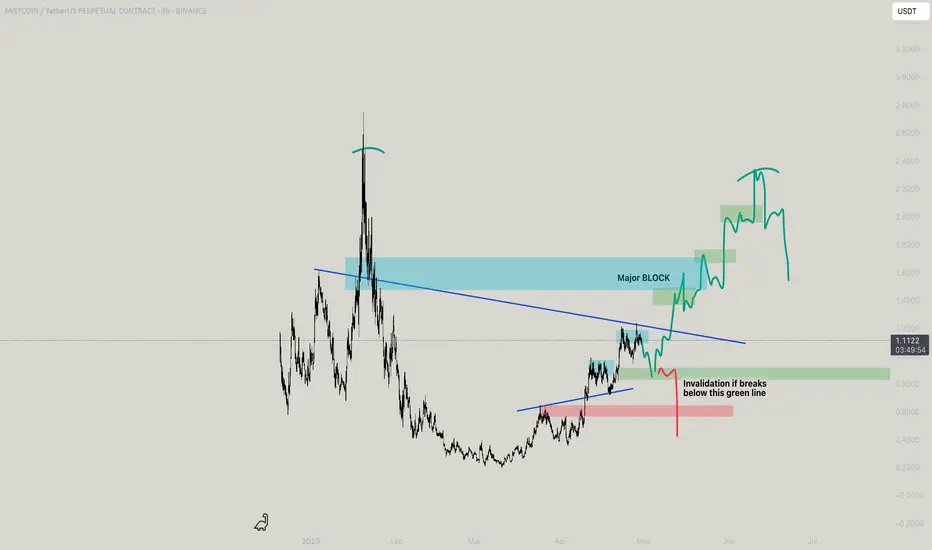
Mega FartCoin Analysis - Is it the beginning? $3 when?SO previously if you have seen me analyzing fartcoin, its on this basis that all OB works in place so well, So would decipher it better. Also you can see my old posts to get a conclusion on whats to be done.
Coming to the Market Profile -
we can see that the market has built a solid volume base around the $1.08–$1.11 zone, with multiple POCs (Point of Control) stacking here — indicating strong buyer interest and fair value acceptance. This region is acting as a strong demand zone. The structure is developing a higher-low pattern since April 22nd, suggesting bullish intent, especially as price is trying to hold above the VAL/POC levels of the last two profiles. However, each upward push is still getting capped near the $1.14–$1.16 VAH area, which now becomes a critical breakout zone. If price can close above $1.16 with volume, we can expect expansion towards $1.20+. On the flip side, if price loses $1.08 and starts building value below it, that would shift the bias bearish again with potential retest of $1.03–$1.00.
Now based on this, ive drew a lower TF 1H parabolic steep curve, which is also marked on my channel for better understanding. Now at this very point of time on 4H LTF the same pattern is being formed where invalidation is done (which is a prior to a swing before a UTAD move)
As you see cyan boxes say the pattern to get achieved and for the green is yet to be achieved!! Also have marked a major block, where most settlement of big longs and new buyers would be encouraged!!
FARTCOINUSDT.P trade ideas
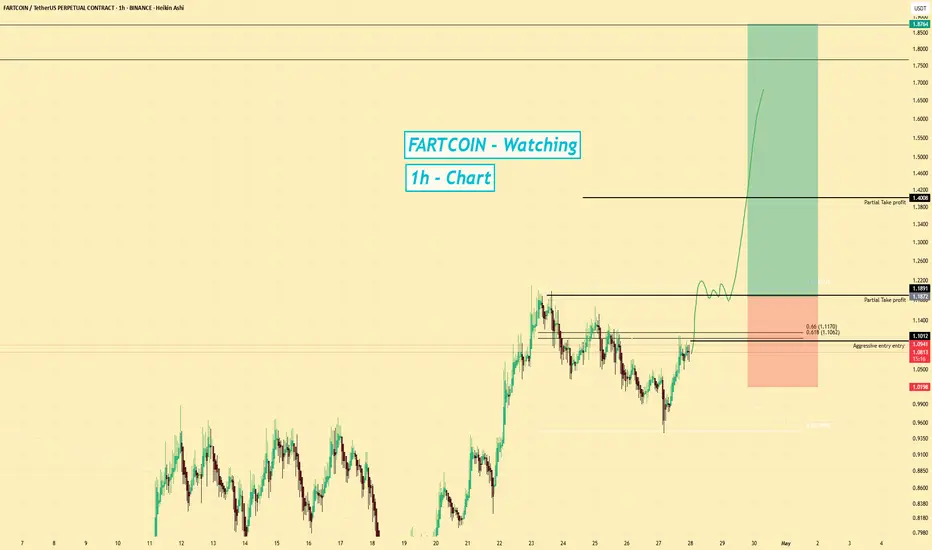
FARTCOIN |Long | Aggressive Long Watch | (April 2025)FARTCOIN (FART) | Aggressive Long Watch | Meme Coin Spot Buying Surge | (April 27, 2025)
1️⃣ Insight Summary:
FARTCOIN (FART) has seen a massive spike in spot buying over the past few hours. Despite being a meme coin, the volume and activity are signaling a potential aggressive trading opportunity.
2️⃣ Trade Parameters:
Bias: Aggressive Long
Entry Zone: Watching price action and consolidation around $1.18
Stop Loss: Below the consolidation base or most recent swing low
TP1: Dynamic target after breakout (early partials recommended)
Partial Exits: Highly encouraged given the high volatility of meme coins
3️⃣ Key Notes:
✅ Spot buying has sharply increased, showing growing interest despite FARTCOIN’s meme status.
✅ Heavy shorting is already happening around this area — increasing chances of a potential short squeeze.
✅ Watching closely for consolidation near $1.18 with volume and money flow confirmation.
✅ Money flow indicators must support the bullish case before entering aggressively.
❌ Risk remains extremely high — meme coins are unpredictable and can reverse sharply, so risk management is critical.
4️⃣ Follow-up:
I will continue to watch FARTCOIN very closely and will update if we get a strong consolidation breakout setup or a change in the money flow dynamics!
Please LIKE 👍, FOLLOW ✅, SHARE 🙌 and COMMENT ✍ if you enjoy this idea! Also share your ideas and charts in the comments section below! This is best way to keep it relevant, support us, keep the content here free and allow the idea to reach as many people as possible.
Disclaimer: This is not financial advice. Always conduct your own research. This content may include enhancements made using AI.

Ready for more farts?Fartcoin is on critical 4H OB, owing to the moves earlier, it shall move in the way drawn,

Fartcoin update: more bullish than expectedNow it looks a lot like acceptance above the pmPOC. Volume is building here and it doesn´t look like possible excess anymore regarding the previous bracket.
By extending the pwProfile (previous week profile) we can see (white range) that value is building higher (the POC - point of control) is higher than in the pwProfile from last week.
If bulls keep up the acceptance, then Fartcoin will go for a full rotation to the pmVAH (previous month value area high).
I have taken profit off the short from above 1.10 and just bought some at 1.05 ish, looking for 1.42.
Tapping the high of the previous bracket at 0.96 probably would be my invalidation.

FartCoin resistance after completing a potential Elliott Wave 5Fartcoin Tests Major Resistance – ABCD Correction in Play?
FART is trading at a significant resistance level, with signs suggesting the completion of an Elliott Wave 5. This could trigger a larger corrective ABCD pattern.
Price has stalled at the $1.15–$1.30 range with multiple daily rejections.
Wave 5 structure appears completed, pointing toward corrective downside.
Macro ABCD correction setup is visible, hinting at extended retracement.
From a structure standpoint, this region represents a potential macro lower high. Without strong bullish follow-through, the market could begin a deeper retracement phase. The lack of candle closures above $1.30, paired with a bearish order block at that level, suggests strong resistance.
If sellers regain control, the next area of interest lies in the $0.90–$1.00 range, with further downside possible if the macro ABCD pattern plays out fully.

Fartcoin preparing for the next leg up This significant consolidation could possibly lead to the next big movement, waiting for a breakout

Fartcoin will lose a lot of valueFartcoin offered a very nice long opportunity below the bracket, because price broke to the downside on decreasing volume. That´s not what strong bears wanted to see. So over there one could have accumulated a lot, wait for the bearish auction process to come to an end and then trade it to the upside. The minimum target was, of course the top of the bracket. After reaching the top of the bracket, we need to judge the volume. Price broke to the upside on very weak buying volume. That´s not what strong bulls want to see. Price also broke through the pmPOC with low volume. Only afterwards price pumped higher on a lot of buying volume in comparison. I really believe that all these buyers here above 1$ will be trapped. They are the foundation for a lot of downside, that we will see in the next days. My minimum target is once again the low of the bracket at 0.78 ish - a decrease of roughly 30%. Then we will judge the volume and a potential breakout attempt once again. So right now I am just accumulating shorts, waiting for the bullish auction process to come to an end and then it will fall back down relatively quick.
If we will see the breakdown, price will naturally lose the pmPOC which will cause a FTR (failure to rotate), because obviously then price was unable to fully rotate the pmProfile. We will then target the origin of the move, which is minimum all the liquidity below the bracket.
Another important fact to mention: The freshest pwProfile (previous week profile) below is pretty balanced. Above, the highest risk for new longs is given but the biggest opportunity for sellers. Of course the current move is very extended for good reasons, but it is still an important factor that requires some good risk-management and understanding of the profiles and auction process. I´ll see you at the low of the bracket.

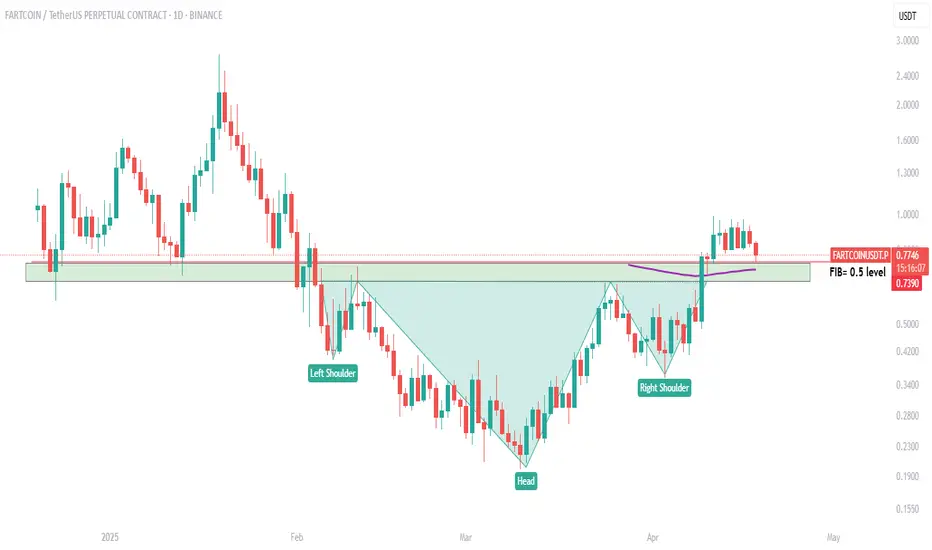
FARTCOINUSDT: Inverse Head & Shoulders patternJoin our community and start your crypto journey today for:
In-depth market analysis
Accurate trade setups
Early access to trending altcoins
Life-changing profit potential
Let's analyze Fartcoinusdt :
FARTCOINUSDT has completed a classic Inverse Head & Shoulders pattern, signaling a potential bullish reversal. The neckline breakout around 0.7390 aligns with the 0.5 Fibonacci retracement level and 100 EMA adding strong confluence. Price is now retesting this zone after a brief rally, with current support holding firm near 0.77. As long as this level remains intact, bulls are in control. A successful bounce here could lead to a continuation toward the $1.00 psychological zone and beyond. However, a daily close below the neckline could invalidate the structure. Watch for strong bullish reaction in this key demand area to confirm trend continuation.
Support: $0.73- $0.66
Resistance: $1
If you find this analysis helpful, please hit the like button to support my content! Share your thoughts in the comments, and feel free to request any specific chart analysis you’d like to see.
Happy Trading!!
FARTCOIN/USDT.P – Smells Like a Clean Short Entry’s cooking, and this setup is dripping with RR juice. Let's break it down:
📍 Entry Gameplan:
Short Zone: 1.0660 – 1.0710
SL: 1.1195 (tight and right above the wick)
TP1: 1.025
TP2: 0.9835
TP3: 0.9055 (send it 💨)
Why I Like This Setup:
That choch ➝ BOS combo? Chef's kiss.
Price tapped into supply and reacted fast = strong sellers present
Beautiful RR — no overcomplications, just structure, imbalance, and timing
This thing's been cooking sideways long enough. Now that it’s broken structure and filled its pockets with early buyers, we might finally see a solid dump.
Let’s see if FART delivers the gas.

Breaking: $FARTCOIN Surge 17% to Reclaim $1 Resistant Point The price of Fartcoin ($FARTCOIN) saw a notable uptick of 17% today to reclaim the $1 resistant flipping competitors like SEED_DONKEYDAN_MARKET_CAP:BONK , $PONKE, etc. to reclaim the $1 billion market.
This move is truly historic for $FARTCOIN as the asset has been swinging between the $0.80- $0.90 zone before reclaiming the $1 resistant point.
The 4 hour price chart shows the formation of a U-shaped pattern that is a hinting at a bullish continuation pattern with a 150% surge in sight.
Since January 2025, $FARTCOIN loss about 93% of market value dipping from a high of $2.76 to as low as $0.109. But current chart patterns and metrics hints at a bullish continuation move.
Furthermore, data from CMC shows an increase of about $352.1M in 24 hour trading volume representing 92.72% increase for $FARTCOIN.
Fartcoin Price Data
The Fartcoin price today is $1.07 USD with a 24-hour trading volume of $354,166,937 USD. Fartcoin is up 17.57% in the last 24 hours. The current CoinMarketCap ranking is #62, with a market cap of $1,068,365,252 USD. It has a circulating supply of 999,998,256 FARTCOIN coins and a max. supply of 1,000,000,000 FARTCOIN coins.

FARTCOIN GOING TO 5$This chart showcases the 1-day timeframe analysis of FARTCOIN/USDT, highlighting a significant bullish breakout pattern. The downtrend that had dominated the market since late 2024 has officially been broken, as indicated by the diagonal trendline breach. A major breakout occurred with strong volume confirmation—an essential sign of genuine bullish interest. Furthermore, a bull flag has formed and successfully broken out on the smaller timeframe, reinforcing the upward momentum.
The current price sits at approximately $1.06, with strong bullish targets mapped out in the highlighted yellow zone, projecting potential upside levels of $2, $3, and even $5. These targets represent gains of over 400% from the breakout point. However, traders should remain cautious as the bull thesis would be invalidated if the price drops below the $0.70 mark, which serves as a key support level.
Volume bars at the bottom show increasing bullish activity, supporting the breakout's legitimacy. If momentum continues, FARTCOIN may enter a sustained bullish phase, making this an important area of interest for technical traders. This analysis underscores the importance of volume, trendline structure, and continuation patterns like the bull flag in predicting potential crypto moves.

FART - YOU ROCK!I wont suggest fartcoin now but to those who hold the coin they may trail to book profits. Parabolic move commenced, means either it gets hold of the blue box making 4 stages before a fall, or might reverse from the last green box as said. The yellow is what if the last green box gets in place

Global scenario for FartcoinIn this video I considered the global possible price movement, also made possible scenarios for the current week
Write a comment with your coins & hit the like button, and I will make an analysis for you
The author's opinion may differ from yours,
Consider your risks.
Wish you successful trades! MURA

Small Silent Farts for a BIg FART!Okay so I have posted each and everywhere how fart can move, considering this, small farts below the red point marked to get work done! Can churn liquidity on the red box!

Gas ready? for FARTSFARTS is having a lot of beans and this coin you see with all fall rise like a beast! 4H 1H loooks very very strong, LIKE VERY!!!

Breaking: $FARTCOIN Gearing For A Breakout To 1 Bln Market CapThe price of fartcoin has been surging consecutively, but failed to break the $1 pivot or resistant point withholding the asset from breaking the $1 billion market threshold.
The memecoin was created on the Solana blockchain through pump.fun, shortly after the community took over the project making it graduate to Raydium- a DEX on Solana ecosystem. Gaining momentum, the asset was listed on few CEX like Kucoin, GateIo, BingX, etc.
Fartcoin ($FARTCOIN) has made 3 attempts to break pass the $1 resistant but each move was denied making the asset to form a short-term head and shoulder pattern. while the asset is consolidating after the recent fit, failure to break the $1 resistant for $FARTCOIN might resort to a retracement to the $0.60 support point before picking liquidity up for a reversal.
Fartcoin Price Data
The Fartcoin price today is $0.760227 USD with a 24-hour trading volume of $292,550,722 USD. Fartcoin is down 15.66% in the last 24 hours. The current CoinMarketCap ranking is #77, with a market cap of $760,225,448 USD. It has a circulating supply of 999,998,256 FARTCOIN coins and a max. supply of 1,000,000,000 FARTCOIN coins.

#FARTCOINUSDT is set for a bearish scenario📉 SHORT # BYBIT:FARTCOINUSDT.P from $0.7376
🛡 Stop loss: $0.7830
🕒 Timeframes: 1H + 4H
✅ Overview:
➡️ On the 4H chart BYBIT:FARTCOINUSDT.P , price broke down from the Bullish Flag, thereby invalidating the bullish scenario.
➡️ The Top 2 formation failed to break the previous high, confirming a bearish structure.
➡️ The $0.7822 level was broken and now acts as resistance — currently being retested.
➡️ The current entry at $0.7376 is optimal after a weak bounce, with high downside potential.
➡️ Volume increased on the red candles, confirming that sellers are in control.
➡️ Support levels are at $0.7172, $0.6970, and $0.6765. The main target lies near the volume-based POC at $0.5269 (in the next stage).
🎯 TP Targets:
💎 TP 1: $0.7172
💎 TP 2: $0.6970
💎 TP 3: $0.6765
📢 The bearish scenario is confirmed. A continuation of the downtrend is expected.
📢 The channel breakdown and weak bounce with declining volume are strong confirmation signals for entry.
📢 Stop-loss is placed above the rejection zone.
📢 Local VPVR and price structure confirm seller pressure in this area.
🚫 Long positions are not valid at the moment — no reversal patterns or confirmations above volume resistances.
🚀 BYBIT:FARTCOINUSDT.P is set for a bearish scenario — downward movement is the priority! Watch price action and manage your levels carefully!

FARTCOINFARTCOIN as you could see swept BSL with a clear 4h displacement creating a an orderblock. I will be placing my short orders at the body of this orderblock and fortunately matches the breaker.
SL and TP is seen on chart. Use max 5x leverage and 0.5% of you capital
GL

fartcoin about to have diarrhea if you love fartcoin then dont worry! U will be able to buy it at 30c again in the next 1-2 months!
Invalidation if daily close above 1$
full send it to zero
shoutout to the CT influencer scammers who keep shilling this on the feed

Fartcoin path
Not Financial Advice, Do your own research
Bottom in the .82s-8.3s
Begin hedging at .84
Maybe as low as .74 but it’s a washout wick
( IF: Close a 4hr/daily below, leave longs , wait to sell shorts in low .60s)
After we bottom today/tomorrow next
Move up to .96 and we break the range. $1.07 is the target. I’m thinking a little surprise Friday rally. Correct back to mid .94s in a wick and breakout over next week to $1.40

$FARTCOIN | #1D + #1M Technical View #shortAfter a 400% monthly rally, price is now testing major resistance at $0.93–$1.00, which aligns with:
— Monthly supply zone
— Psychological level at $1
— Key breakdown structure from earlier
📌 Key observations:
— First retest of the level that triggered the previous collapse
— Signs of local weakness on the daily TF after tapping resistance
— Untapped D1 order block below ($0.25–$0.30 range)
🎯 Trade Setup:
— Short Entry Zone: $0.93–$1.00
— Targets: $0.65 (interim support) → $0.25–$0.30 (OB demand)
— Invalidation: Strong breakout and close above $1.03 with volume
⚠️ This is the first reaction to HTF resistance.
Losing the $0.78–$0.80 support would open the door for a deeper correction.
Momentum Trading Insights: MACD & meme coin FartcoinHello,
For momentum trading a coin like Fartcoin, the momentum is extremely difficult to measure on the small scale time frames. For example, the 1 minute, 5 minute, 10 minute, and even 30minute time frames are all undependable since the momentum of the price could go any other direction at any moment.
However, don’t be discouraged to trade in these time frames, my suggestion here is to increase the probability of successful momentum trading through confident, reliable, and emotionally detached trading. By analyzing larger timeframes such as the 4 hourly timeframe, the MACD and other indicators such as RSI, the VWAP, we could be more sure the overall price is heading in the direction we’d like. Taking this crucial step avoids the panic selling of a coin in the short-term when in the big picture, things are looking more than terrific.
The MACD indicates when a momentum is positive, slowing down, and negative. By looking at the 4 hourly timeframe, we could be sure that once a negative momentum starts slowing down, chances are higher that it will switch to a positive momentum. I have changed the colouring of my MACD so it represents the colours of a traffic light. Red — don’t trade (lowest probability of making profit). Yellow — the momentum could change (if from red to yellow then price is going up; if green to yellow, price is going down). Green — trade here (greatest probability to make profits).
Once confirming that the 4hourly is in a good place, you could be rest assured that when whiplash and sudden price dumps occur, you could hold more conviction to continue on holding, rather than panic selling and then an hour later, you have FOMO because the price moved incredibly higher.
In order to enhance the prediction of memecoins, look into the total market and analyze it at the greater time-frames as well. I recommend higher time-frames the the 4hourly since the total market has a lot more data than the life of Fartcoin which is only a few months old. If the momentum is looking good, you could be more confident with your trades.
This concludes my ideas on momentum trading memecoins and how we could leverage the best case use of these coins through a grounded trading technique such as momentum trading. Momentum trading doesn’t try to predict the price, it at the current probability of momentum.
Cheers!
-RanMcdon
