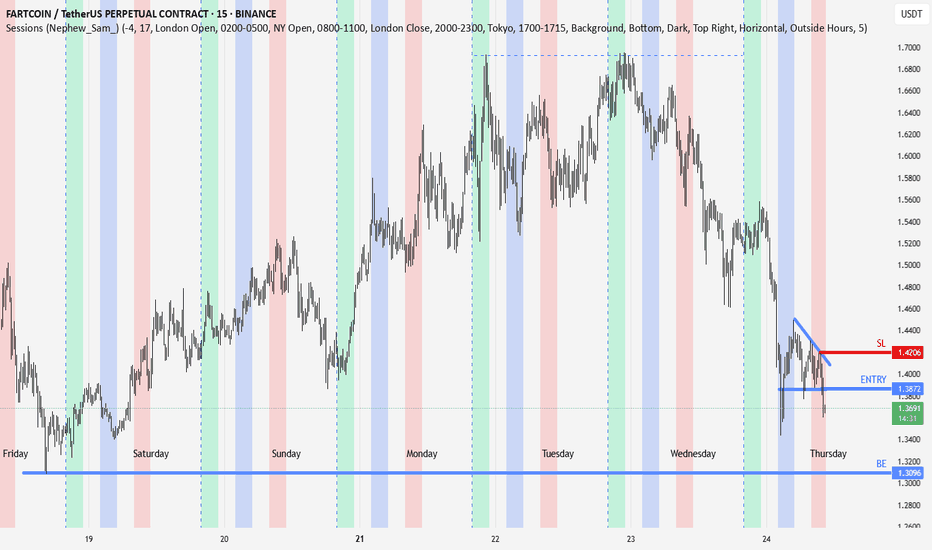
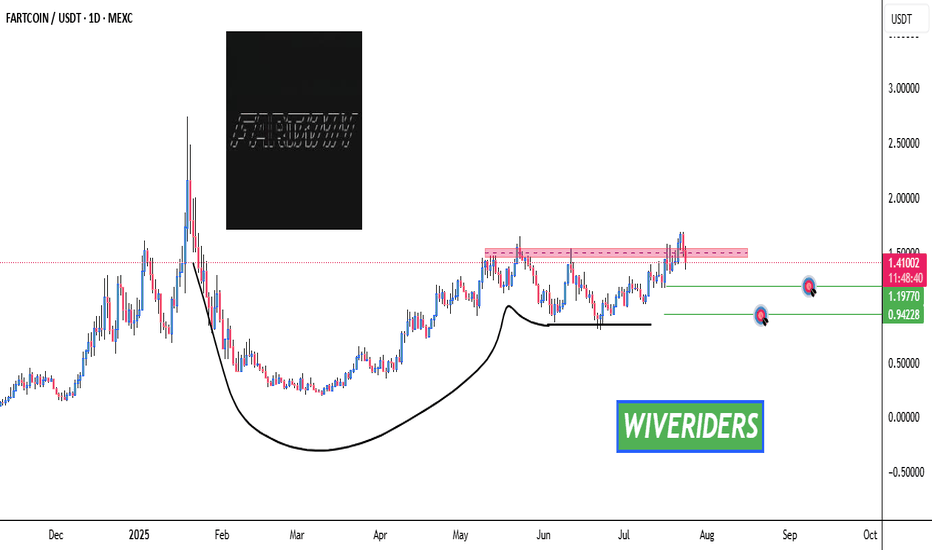
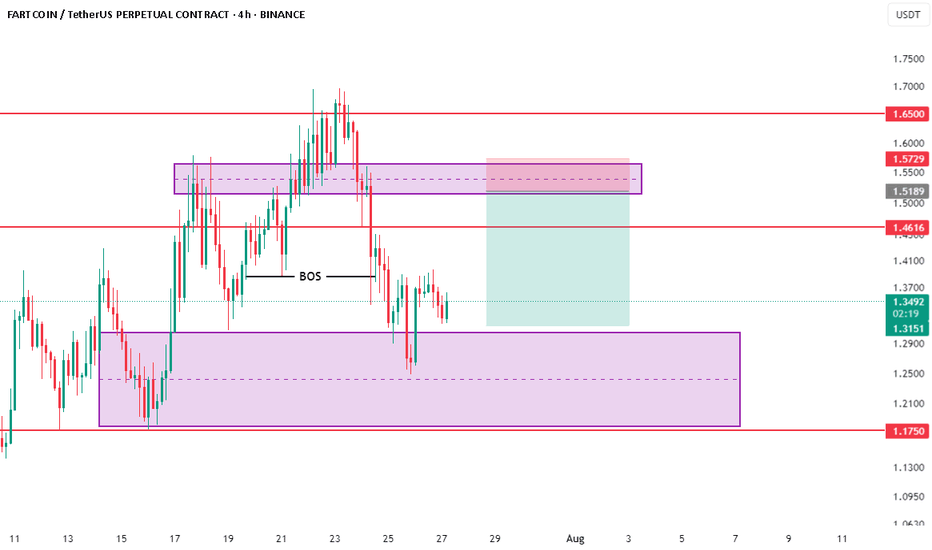
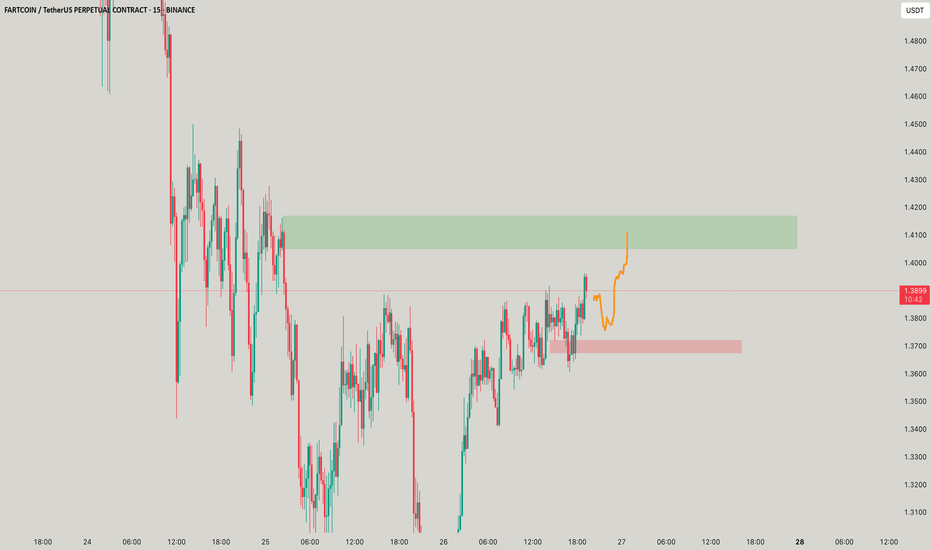
FARTCOIN Is About to Make or Break—Massive Correction Incoming ?Yello Paradisers — have you seen what’s brewing on #FARTCOINUSDT? After our spot-on predictions in previous waves, this might be the final shakeout before the real show begins. But one wrong move here… and it all falls apart.
💎#FARTCOIN has recently shown aggressive movement, completing the third wave of a classic Elliott Wave impulse. Waves 1 and 2 are in place, and with the third now printed, there's a strong probability of entering an ABC corrective phase — forming the 4th wave — which could retest areas near the previous resistance-turned-support.
💎Zooming out, the asset has been shaping a long-term Cup and Handle formation, and while we’ve seen a breakout above the neckline, a retest is highly likely before any continuation. This aligns with a potential ABC structure, adding confluence to a possible pullback scenario.
💎On top of that, FARTCOIN is flashing signs of strength within a bullish inverted Head and Shoulders pattern, with a neckline around 0.6273. A retest of this key level is probable and would further validate buyer interest in this zone.
💎Additional confluence comes from Holding the multi-timeframe EMA 20 as dynamic support. A visible order block at the 0.618 Fibonacci golden pocket (0.5217), which could act as a magnet for price during the correction.
💎If this area holds, the bullish case remains intact, with probable targets at 0.8913, and an extended move into the 1.0542–1.1361 zone. However, this structure would be invalidated on a candle close below the right shoulder, or a breakdown below the 2nd Elliott Wave low.
This is the point where the weak hands get shaken out and smart money reloads. If you're aiming for long-term success, wait for high-probability setups and protect your capital. Strive for consistency, not quick profits. Treat the market as a businessman, not as a gambler, Paradisers.
MyCryptoParadise
iFeel the success🌴
FARTCOINUSDT trade ideas
Momentum Trading Insights: MACD & meme coin FartcoinHello,
For momentum trading a coin like Fartcoin, the momentum is extremely difficult to measure on the small scale time frames. For example, the 1 minute, 5 minute, 10 minute, and even 30minute time frames are all undependable since the momentum of the price could go any other direction at any moment.
However, don’t be discouraged to trade in these time frames, my suggestion here is to increase the probability of successful momentum trading through confident, reliable, and emotionally detached trading. By analyzing larger timeframes such as the 4 hourly timeframe, the MACD and other indicators such as RSI, the VWAP, we could be more sure the overall price is heading in the direction we’d like. Taking this crucial step avoids the panic selling of a coin in the short-term when in the big picture, things are looking more than terrific.
The MACD indicates when a momentum is positive, slowing down, and negative. By looking at the 4 hourly timeframe, we could be sure that once a negative momentum starts slowing down, chances are higher that it will switch to a positive momentum. I have changed the colouring of my MACD so it represents the colours of a traffic light. Red — don’t trade (lowest probability of making profit). Yellow — the momentum could change (if from red to yellow then price is going up; if green to yellow, price is going down). Green — trade here (greatest probability to make profits).
Once confirming that the 4hourly is in a good place, you could be rest assured that when whiplash and sudden price dumps occur, you could hold more conviction to continue on holding, rather than panic selling and then an hour later, you have FOMO because the price moved incredibly higher.
In order to enhance the prediction of memecoins, look into the total market and analyze it at the greater time-frames as well. I recommend higher time-frames the the 4hourly since the total market has a lot more data than the life of Fartcoin which is only a few months old. If the momentum is looking good, you could be more confident with your trades.
This concludes my ideas on momentum trading memecoins and how we could leverage the best case use of these coins through a grounded trading technique such as momentum trading. Momentum trading doesn’t try to predict the price, it at the current probability of momentum.
Cheers!
-RanMcdon
FARTCOIN/USDT – HIGH PROBABILITY SHORT FROM PREMIUM ZONEMarket structure shift confirmed with CHoCH, signaling bearish intent.
Price is retracing to fill the Fair Value Gap (FVG) — a premium zone where institutions are likely to re-enter shorts.
Entry: 0.8971 – 0.9010
Target: 0.8571 – 0.8264 – 0.7689
Stop: 0.9254
This is a high-RR setup with clean structure, imbalance, and trend alignment.
Entry in FVG with confirmation = sniper entry.
Targeting downside liquidity zones with ~1:3.5 RR.
Always do your own research, manage your risk, and use proper confirmation before entering any position. Trade responsibly.
Fatcoin Setting Up for a Potential Swing Long OpportunityFatcoin is showing signs of a potential swing long setup as it approaches a critical support level. With key technical confluences aligning, traders should keep a close eye on how price reacts around this zone. If support holds and volume confirms, this could present a high-probability long entry in the days ahead.
Key Points:
• $1.51 is the critical support level to hold for bullish continuation
• This level aligns with the 0.618 Fibonacci retracement and the value area high
• A spike in volume on the retest of this level will confirm market interest
Fatcoin’s current pullback may present an ideal opportunity for a swing long, but only if $1.51 holds as support. This level carries significant weight as it aligns with three major technical factors: the 0.618 Fibonacci retracement of the recent move, the value area high, and the previous support zone. These overlapping confluences create a high-interest area where buyers are likely to step in.
Equally important is the volume profile. For this setup to be valid, we need to see a notable increase in volume when price tests the $1.51 level. This surge in volume will signal that market participants are stepping in with conviction, validating the support zone and increasing the likelihood of a bounce or continuation to the upside. Without this confirmation, the level remains vulnerable and the setup loses strength.
If volume confirms the support hold, this would suggest the bullish market structure remains intact. A strong reaction from this level would likely set the stage for the next leg up, making this an optimal area to consider entries for those targeting higher timeframe swing moves. As always, patience is key — let the level prove itself before executing. A disciplined approach will always outweigh a rushed entry when trading key inflection zones.
Momentum Fading on FARTCOIN – High-Risk Short SetupBINANCE:FARTCOINUSDT.P
📊 Pair: FARTCOIN/USDT (1H)
🔴 SHORT
CMP / Entry: 0.8639
Stop Loss (SL): 0.8946
🎯 Take Profits:
TP1: 0.8485
TP2: 0.7890
TP3: 0.7378
TP4: 0.6977
White Lines are Extened TP's
🧠 Technical Outlook
A clear bearish divergence is visible on the 1H chart — price has made a higher high while RSI prints a lower high, signaling a potential momentum fade. RSI currently sits at 67.83, rolling off the overbought zone, indicating room for correction.
Volume shows slight decline, supporting a possible near-term retracement. Price action appears to be stalling beneath resistance.
📌 Strategy
Short from CMP with a tight SL above recent high. Secure partials along target zones. A break of TP1 could trigger a cascade toward deeper support levels.
Leverage: 25x
Position sizing: Margin 1–2% of your portfolio
⚠️ Disclaimer
#NFA, DYOR. Margin 1–2% of your portfolio.
Financial markets are subject to high volatility and unpredictable moves. Always trade with a clear risk management plan and avoid overexposure.
FARTCOIN Buy Setup: High-Risk, High-Reward Play on Meme Momentum🚀 FARTCOIN Trade Idea: Fundamentals & Disclaimer
Fundamental Concentrate:
Meme Hype & Community: FARTCOIN thrives on viral social media traction and speculative retail interest, typical of meme coins. Recent spikes in mentions (Twitter/Reddit) suggest short-term volatility opportunities.
Low Market Cap: Tiny market cap (<$10M?) allows for explosive pumps with minimal inflow—but high risk of rapid dumps.
Exchange Listings: Watch for new CEX listings (e.g., speculated KuCoin listing), which could trigger 50-100% spikes.
Tokenomics: Check circulating supply. If heavily locked/burned, reduced sell pressure could amplify pumps.
⚠️ CRYPTO TRADING DISCLAIMER:
FARTCOIN is a high-risk, unregulated asset. Never invest more than you can afford to lose.
Meme coins often lack utility; prices rely purely on hype. Exit liquidity risks are extreme.
This is not financial advice. DYOR, use tight stop-losses, and avoid FOMO.
📌 Trade Smart: Meme coins are casino plays. Scale in/out, and never marry a position.
FARTCOIN bullish scenario C&Hwatching possible cup and handle on Fartcoin.
Handle (flag) currently forming.
Watching on lower timeframe for price to push up towards upper range of handle for a possible short opportunity back down to bottom of the handle range.
Opportunity to long at the bottom of the range if price reacts accordingly.
$FARTCOIN | #1D + #1M Technical View #shortAfter a 400% monthly rally, price is now testing major resistance at $0.93–$1.00, which aligns with:
— Monthly supply zone
— Psychological level at $1
— Key breakdown structure from earlier
📌 Key observations:
— First retest of the level that triggered the previous collapse
— Signs of local weakness on the daily TF after tapping resistance
— Untapped D1 order block below ($0.25–$0.30 range)
🎯 Trade Setup:
— Short Entry Zone: $0.93–$1.00
— Targets: $0.65 (interim support) → $0.25–$0.30 (OB demand)
— Invalidation: Strong breakout and close above $1.03 with volume
⚠️ This is the first reaction to HTF resistance.
Losing the $0.78–$0.80 support would open the door for a deeper correction.
FARTCOIN Surges Over 35% in 24 Hours, Trading Volume Nears $444FARTCOIN, built on the Solana blockchain, has posted a strong daily gain. The token has risen 35.44% in the last 24 hours, 41.99% in the last seven days, and 227.62% in the last 30 days.
The current price stands at $0.7494, with a circulating supply of 999,998,256 tokens out of a total of 1 billion. Its market capitalization has reached $749.48 million while the 24-hour trading volume has spiked to $443.51 million, up 79.72%.
Technical Analysis: SEED_WANDERIN_JIMZIP900:FART Tests Key Resistance. Can It Break Above?
SEED_WANDERIN_JIMZIP900:FART is trading at $0.7494, showing bullish momentum. The price is trying to break through a major resistance level of around $0.7000, which has acted as a key level for prices for months.
The breakout comes with a strong volume, confirming buyer strength. The RSI is near 69.06, which also clarifies the bullish momentum in play. If a successful breakout is seen at the current resistance level, a move toward the previous high at $2,7 could follow.
Looking further at the 50 and 100 moving averages, they back up the bullish momentum as they all are below the current market price, reading at $0.46 and $0.37, respectively.
Fartcoin price analysis😕 In such a market, it is probably safe to buy only #FARTCOIN
But seriously, price has been holding quite well in recent days, despite the "bloody market"
You shouldn't rush to buy, but why not take it "on the pencil".
🐳 A safe purchase is made after the blue route will fix up
💔 Risky buying - by the red road.
What will you choose?)
fartcoin bullish on 4hBelow is a high-level technical analysis of the chart you provided (labelled “FARTCOIN / TetherUS Perpetual Contract — 4H, Binance”), based on what is visible in the screenshot and referencing common Smart Money Concepts (SMC) and price action principles. Note: this analysis is for educational purposes only and does not constitute financial advice.
1. Market Structure Overview
Previous Uptrend and Sharp Decline:
From the chart, FARTCOIN appears to have experienced a sharp rally sometime in mid-to-late January or early February (potentially reaching well above 1.50 to around 2.00+). After that, price dropped dramatically, eventually bottoming out in the 0.20–0.30 region.
Flattening/Consolidation:
Following the steep decline, price went into a consolidation range around 0.20–0.30. This range can often precede either an accumulation phase or a continuation to the downside. In SMC language, it could represent a zone in which institutional players (Smart Money) are accumulating if support levels hold firmly.
Recent Shift in Structure (CHoCH / BOS labels):
The chart shows a Change of Character (CHoCH) in the vicinity of 0.40–0.50, followed by a Break of Structure (BOS) around the 0.60–0.70 region. These labels typically signal that price has made a higher high (HH) after a higher low (HL) relative to prior swing points, suggesting a possible shift from bearish-to-bullish market structure on the 4H timeframe.
2. Key SMC Concepts on the Chart
BOS (Break of Structure)
A BOS is often noted when price breaks above a key swing high or below a key swing low. On your chart, the first big BOS after the downtrend likely signals that bullish momentum is picking up.
The second BOS (if drawn on the chart) would confirm continued bullish structure if FARTCOIN climbs above another important swing high.
CHoCH (Change of Character)
A CHoCH is commonly used to mark the initial sign that the dominant trend might be reversing. On your chart, the CHoCH around 0.40–0.50 indicates that price began making higher lows and higher highs, breaking the prior bearish sequence.
Demand Zones & Liquidity Areas
The blue zones on your chart (at or below 0.40, and perhaps one near 0.50–0.60) are likely demand zones (areas where institutional orders could be resting). Price may revisit these areas if there is a pullback before continuing its uptrend.
Look for reactions when price returns to these zones: a strong bounce can confirm bullish demand still holds.
Premium/Discount Concept
Under SMC, you often divide a swing (the total price move from a major low to a major high) into “premium” (top half) and “discount” (bottom half) zones. Many traders prefer to enter positions in the “discount” zone during an uptrend to aim for better risk-to-reward. Conversely, if price is in a “premium” zone and showing signs of weakness, it may be time to consider partial profit-taking or waiting for lower entries.
3. Notable Support and Resistance Levels
Immediate Support:
Around 0.40–0.50 (Demand zone / CHoCH area).
Any close below 0.40 again could cast doubt on the new bullish structure, so this is a critical region to watch.
Near-Term Resistance:
Around 0.80–1.00, based on prior swing highs. The chart also seems to highlight the 1.00 psychological level as an upside target.
Beyond that, if price pushes above the 1.00–1.30 region (the upper resistance shown in some SMC markings), you could see attempts to fill “inefficient” price action or to revisit previous supply zones near the February highs (1.50–2.00+).
4. Potential Price Scenarios
Bullish Continuation:
Price consolidates briefly near the 0.70–0.80 zone, then breaks higher, reaching 1.00+ in a continuation of the bullish structure.
The bullish scenario is supported by the recent CHoCH and BOS. If volume and momentum remain strong, a move up to retest higher-timeframe supply zones could be in play.
Pullback, Then Bounce:
Price corrects from the current level back down into the noted demand zones (~0.40–0.60).
If strong buyers step in and defend support, this could offer a “discount” entry region for swing trades, and price may then continue its uptrend to challenge 1.00+.
Deeper Reversal:
Price loses support around 0.40, indicating that the “change of character” was just a temporary rally.
A drop below 0.30–0.40 could signal a full breakdown and a possible retest of the previous lows, negating the bullish thesis.
5. Additional Considerations
Volume & Liquidity:
Watch trading volume and liquidity closely, especially on pullbacks. SMC often emphasizes volume spikes at key supply/demand zones to confirm if Smart Money is actually stepping in.
Higher Timeframe Analysis:
Always check 1D or 1W charts to see if this 4H bullish structure aligns with a higher timeframe uptrend or if it’s merely a corrective move in an otherwise larger downtrend.
News & Fundamentals:
FARTCOIN’s fundamentals and overall market sentiment (e.g., Bitcoin’s general trend, altcoin hype cycles, or any project-specific news) can heavily influence price. Technical signals are more reliable when fundamentals do not contradict them.
Risk Management:
If long, decide where your invalidation point is (e.g., a close below 0.40).
Consider partial profit taking at key resistance levels or major supply zones.
Keep position sizing in check, especially since small-cap tokens can be extremely volatile.
Summary
From the SMC labels (CHoCH, BOS) on your 4H chart, FARTCOIN appears to have transitioned from a downtrend into an early-stage uptrend or at least a significant relief rally. The confluence of (a) higher highs and higher lows on the 4H timeframe and (b) support forming around 0.40–0.50 suggests that bullish momentum could continue toward 1.00 and higher, provided the market structure remains intact and trading volume supports the move.
As always, be mindful of broader market conditions, watch out for any breakdown below key support zones, and apply sound risk management practices
FARTCOIN/USDT Analysis – Long Setup in a Bearish MarketThis coin appears stronger than the overall market. Even during Bitcoin's sharp decline, it maintained its position and only slightly corrected.
Currently, a strong volume zone has formed at $0.50–$0.52. We expect a reaction from this level.
If confirmed, we are considering a long position with the potential to test the $0.65 high.