Time for a short? As you can see, after the price dropped, it made a retracement close to the 0.78 Fibonacci level, and then the market reacted with another downward move.
At the same time, a triangle pattern—or whatever you’d call it—has also formed, which is often considered a continuation pattern, especially in a downtrend. So, there’s a chance the price could drop further.
Personally, I entered a short position at 0.121$, with my take-profit set at 0.8$.
FARTCOINUSDT trade ideas

Dribble Farts - Smell like rosee!So this fart smells like rose i sniffed! Just let the move come down, hodl it, look after the caution line!

FARTCOIN – Short-Term Reversal SetupPrice consolidating near strong support at 1.1523 with bullish signs emerging.
Key Levels:
Entry: Around 1.1589
Support: 1.1523
Targets: 1.1649 → 1.1698 → 1.1820
As long as 1.1523 holds, this setup favors short-term upside. Break and hold above 1.1649 can lead to stronger momentum.
#DYOR #NFA


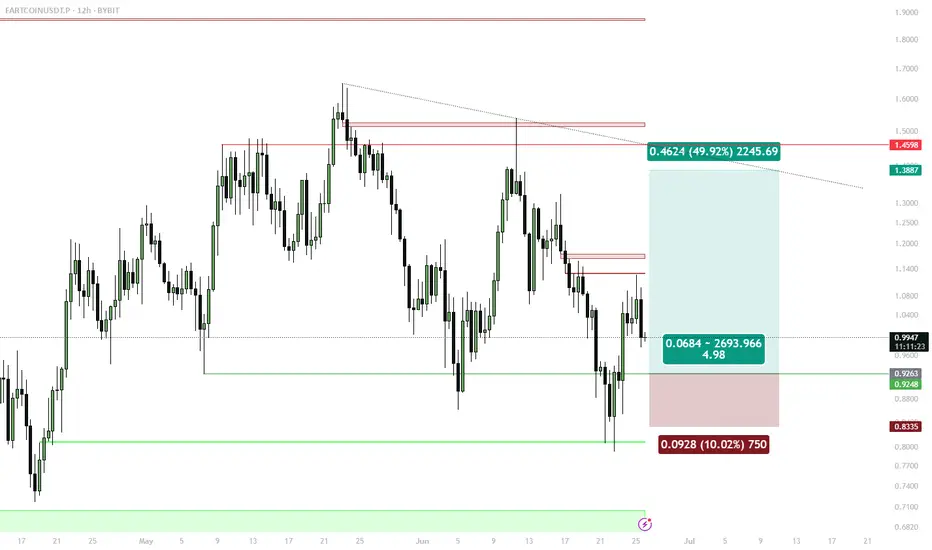
Fartcoin Swing Long – 7R Setup in PlayI’m entering a Fartcoin swing long on a golden pocket pullback during a bullish structure continuation, with confluence from EMAs, fibs, and demand volume. The setup is based on the daily chart for trend structure and 1-hour chart for entry timing.
My stop is placed below structural invalidation, and I have two profit targets: one conservative (TP1) and one trend-continuation (TP2).
Entry at $1.15 – Inside the golden pocket (0.618–0.65 fib), where bullish pullbacks often reverse. Confluence with reclaim of daily 50 EMA.
Stop-loss at $1.08 – Below structure and golden pocket. If broken, the setup is invalid and trend may shift.
TP1 at $1.36 – 0.786 fib level and previous local high. Strong resistance and logical partial profit zone. Locks in 3R.
TP2 at $1.64 – Full fib retrace and swing high. If trend continues, this is where momentum likely tops out short term. Gives 7R.
DISCLAIMER: I am not providing trading signals or financial advice. The information shared here is solely for my own documentation and to demonstrate my trading journey. By openly sharing my process, I aim to put pressure on myself to stay focused and continually improve as a trader. If you choose to act on any of this information, you do so at your own risk, and I will not be held responsible for any outcomes. Please conduct your own research and make informed decisions.

FART _ You dont realise he farts on us? All day?If you look at this Farts - Comes two perspective here - One - This is retracement, i.e it took all sellers wrecked - took buyers on top and would break the skyblue line and eventually come to the red one - But the fact is - if we see another prespective - We see it can just go up at 1.26 also -- For me I would follow this what I have learnt, And am pretty sure it would retrace back the red box as well in full

FARTCOIN – Triangle Pattern Setting Up for a Break
**Pair:** FARTCOIN/USDT
**Timeframe:** 1H
**Pattern:** Symmetrical Triangle
FARTCOIN is consolidating around 1.1820 within a symmetrical triangle on the 1H chart. This structure usually signals a breakout is near — but the direction remains uncertain.
**Bullish Case:**
If the price breaks above the upper trendline with strong momentum, we could see a short-term bullish move.
**Bearish Case:**
If the triangle support breaks down, expect bearish continuation in the short term.
No confirmed move yet. Wait for a clear breakout before entering.

Parabolic3 days of rise, broke daily structure, pulled back above vwap , got one lot in and 10% down in half a day

FARTCOIN/USDT – 4H Chart Analysis$FARTCOIN is showing strong structure and has broken out of a bullish flag formation on the 4H timeframe. The price is currently holding above the breakout zone, which increases the probability of continuation.
Setup:
Entry: Buy on retest of breakout (~1.20–1.21 zone)
Stop Loss: Below 1.15
Targets:
TP1: 1.25
TP2: 1.35
TP3: 1.53
Support: 1.15
Resistance levels ahead: 1.25 | 1.35 | 1.53
Watch for the retest — it may provide a great second entry opportunity if missed.
DYOR. Not financial advice
#FARTCOIN #CryptoTrading

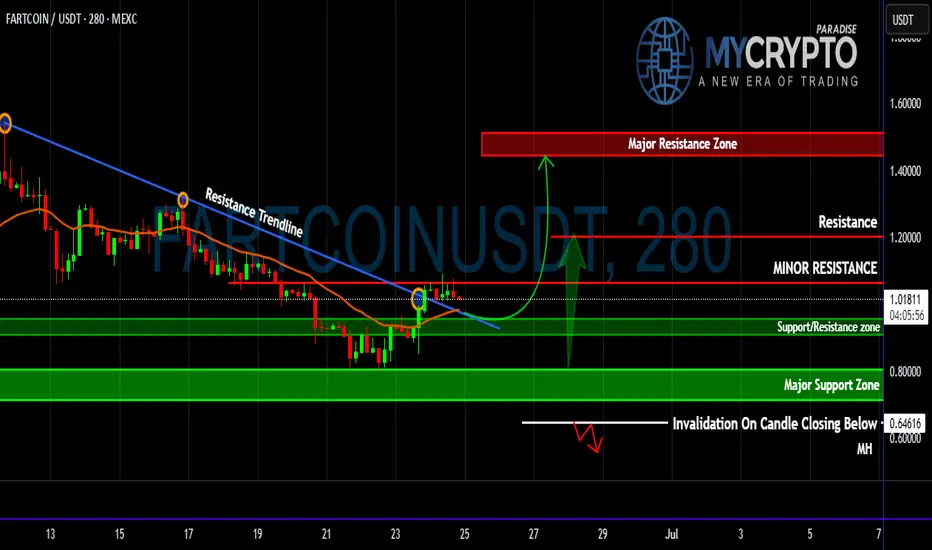
FARTCOIN Flipped Key EMA—Is This the Start of a Pump or Trap?Yello Paradisers ! Are we looking at a breakout that could deliver massive upside, or is this just another emotional trap before the next leg down? The market has been ruthless lately, and unless you base your decisions on structure, probability, and proper confirmation, you’re gambling—not trading. Let’s break down this #FARTCOIN setup from a professional standpoint.
💎#FARTCOIN has finally broken above a clearly defined descending resistance trendline, signaling a potential probable shift in short-term momentum. This breakout occurred precisely as the price reclaimed the multi-timeframe EMA —a key dynamic level that has consistently acted as resistance throughout the downtrend. The reclaim and hold above this EMA significantly increase the probability of a short- to mid-term trend reversal, especially as it aligns with an early attempt to build a bullish market structure.
💎Price is now trading just below a minor resistance level. This zone has capped previous upward attempts and is the first level bulls must overcome for continuation. A confirmed 4H/1H or daily candle close above this resistance will open the door to a measured move toward the next key level at $1.20265, with extended upside potential into the major resistance zone between $1.44660 and $1.55099. Should bullish momentum pick up with increasing volume, a Probable upside move becomes a realistic scenario.
💎However, none of this is guaranteed. We're dealing with probabilities, not certainties. The support/resistance flip zone between $0.95949 and $0.90596 now becomes a crucial reference point. A healthy retest of this area could provide a higher-probability long entry, especially if price continues to respect the reclaimed EMA. Below that, the major support zone from $0.80693 to $0.71058 represents a broader demand block. If the price pulls back this far, it may signal the formation of a larger accumulation range rather than immediate continuation.
💎To manage risk effectively, traders must monitor the invalidation level at $0.64616. A 4H candle close below this level would nullify the bullish breakout scenario and increase the probability of renewed bearish control, suggesting the recent breakout was a deviation or fakeout.
Stay sharp, Paradisers! Will this be a breakout or a fake-out? Only time—and disciplined trading—will tell!
MyCryptoParadise
iFeel the success🌴
FARTCOIN Swing Long — Reclaimed Support, Bids at Bullish OBSwing Long Setup:
Entries: Limit orders in $0.91–$0.93 (12h OB zone, 1D support)
Stops: 4h close below $0.86–$0.87 (support invalidation)
Targets: $1.16 (first TP), $1.43 (secondary target)
🔔 Triggers & Confirmations:
Only stay in trade if 1D/12h support holds on 4h closes
Re-enter on reclaim if stopped out and structure recovers
🚨 Risk Warning:
Breakdown of reclaimed S/R flips setup invalid — exit on signal
FARTCOIN — Perfect Swing Long Up 27%, Dips Are for BuyingDips into $1.06–1.09 (1H FVG + BOS) are for buying.
Still bullish while above $0.92–0.93 OB. Eyeing $1.43 next.

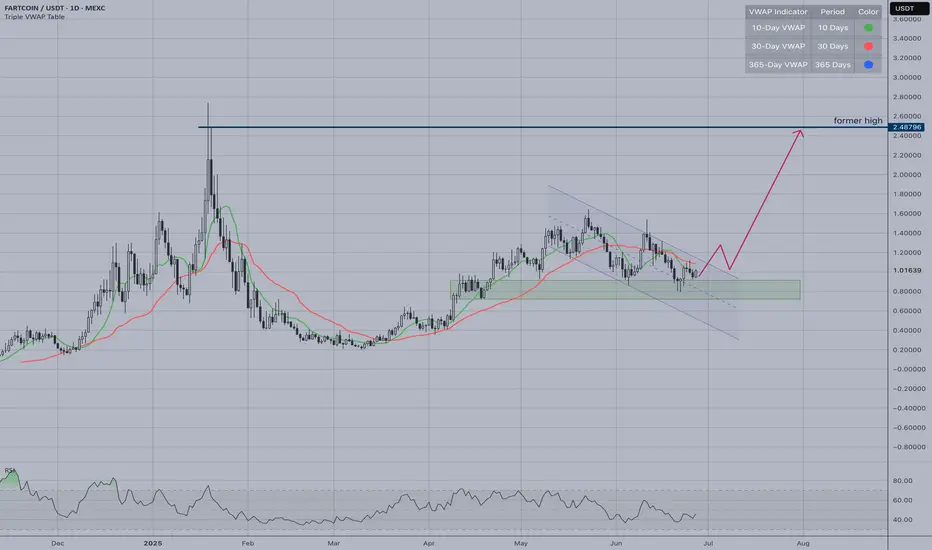
FARTCOIN | VWAP-30 Cross SetupAfter its massive 2025 rally, this consolidation could be preparing for the next leg higher. FARTCOIN has been one of the standout meme coin performers, making this technical setup particularly interesting for momentum traders.
Current Situation:
Price: ~$1.01, trading below 30-day VWAP (red line)
Consolidating in support zone ($0.80-1.00)
Waiting for break above VWAP resistance
The Setup:
VWAP crosses are significant technical signals. When price breaks above the 30-day VWAP with volume, it often indicates renewed institutional interest and can trigger sustained rallies.
Key Levels:
Support: $0.80-1.00 (current consolidation)
Resistance: 30-day VWAP + $1.20-1.30
Target: Previous high at $2.48
Have you heard a trumpet FARTS?So yeah that would sound amazing, but this sound is like he boasts yeah man come i am giving you free money LOLOLOL


Fart isnt deadly anymore!Just a smol notion on how things work! This can make or break though shall break up, but for me ideal is break down and up!

FART to the Rescue!It helps to make money hence always a rescue for us!!! Okay so this is marked as small stances means if it breaks will slip, most probably will bonk most shorters to the up! Keep eyes!

Is it a silent fart? Or a big noise yet to come?This pattern seems a liquidity hunting trapping buyers and if it doest goes above then a fall is emminent!

fartcoin trade ideathe orange impulsive wave is unfolding however the wave 3 is very weak and it didn't even took the wave 1 high but it is still allowed and can be called weak wave 3 so Wave 4 should unfold the support zones are mentioned with green box as area of opportunity I expect the wave 5 to be the biggest wave compared to 1 and 3 target for wave 5 is also mentioned

$FARTCOIN - $1 Bearish Retest MEXC:FARTCOINUSDT | 1D
Just a quick update:
Fartcoin hit our LTF support at 0.88 and is holding so far.
If CRYPTOCAP:BTC can stay above 103k–102.7k, we could see a retest of $1
From there, we'll see if we're going to revisit the HTF demand at 0.64–0.50

Fartcoin BullishCup and Handle formation showing on Fartcoin.
Bitcoin once it goes will lift a bunch of alt coins. I believe bitcoin is en route towards $130k next. Alt coins will likely move after.

FARTCOIN | Midrange Retest After Rejection from Range HighClassic midrange scenario: defend $0.97 for another leg up, or risk testing the lower demand.

Heavy Air comes down - FARTCOINSO the arrow is purely made of fun and agression lol thats the move you expect, expecting btc to fall a bit for it fall further and move, ranges marked
