Ready for Missile Farts in FARTCOIN?As mentioned FARTCOIN is again onto the cushion auction OB and would slowly get all the buyers asscoiated to pull things up as said!
depicted Market profile as shown
Invaldiation if close below the green line!
FARTCOINUSDT trade ideas

FARTCOIN longPlan, trade idea is: FARTCOIN reclaimed Monday lows and above range lows, BTC is holding very strong at range highs no real weakness. Want to see Monday lows hold like on TAO and see a push into range mid -> if we reclaim range mid we target Monday highs and than $1.7

FARTCOIN Bearish Head and Shoulders – Testing Blue Support🚨 $FARTCOIN Bearish Head and Shoulders – Testing Blue Support 📉
$FARTCOIN has formed a bearish head and shoulders pattern and is now testing the blue support. There’s potential for a breakout, so we need to watch closely for any signs of further movement! 📊
Let’s monitor this closely! 💼💸

Big analytics of top memes on Solana In this video, I take a look at the 4 memes BINANCE:WIFUSDT BINANCE:PENGUUSDT BINANCE:BONKUSDT BINANCE:FARTCOINUSDT.P from a global posture and from this week's posture. Some of them are quite high and we can see a local correction already this week
Write a comment with your coins & hit the like button and I will make an analysis for you
The author's opinion may differ from yours,
Consider your risks.
Wish you successful trades ! mura

Fartcoin update for previous bearish ideaQuick update for you:
Fartcoin took out the initial high at 1.46 several times but we are only seeing swing failures. We do not see the price closing several candles above the pmVAH and pwPOC for an attempt to build value, to then swing up for higher prices.
As long as we spend the majority of time below these levels, I am still looking towards the pwPOC below, maybe even 0.96 ish to fully take all the liquidity.
The price is ranging here (blue). If it breaks down, we will keep observing the potentially big range (white) for future price movements.
So nothing has really changed here. We know what to look out for.

FARTCOIN - Dont Miss it!As said earlier! I was anticipating a fall from the point i drew but somewhere the pattern was disobeyed and the fall was not respected, owing to the top liquidity, expecting this for a greater catch to get the fall!!
Its based on pure patterns as seen by me and only me and to the best of my knowledge lol

Fiat Coin Faces Key Test at $1.00 — Is Momentum Slipping?After a strong bullish run, Fiat Coin may be entering a critical phase. Price action has struggled to break past the $1.42 resistance level, signaling a possible cooldown in momentum. This failure to push higher increases the likelihood of a short-term retracement toward lower support — a necessary move to maintain the integrity of the uptrend by establishing another higher low. All eyes are now on the $1.00 support zone, which holds technical significance and could dictate whether bulls can regain control.
Key Technical Points:
Major Resistance at $1.42: Price rejected multiple times, stalling upside momentum
Key Support at $1.00: 0.618 Fibonacci retracement in confluence with historical demand zone
Bullish Trend Intact: Market structure still holds higher highs and higher lows
Fiat Coin has seen bullish momentum in recent weeks, but its inability to breach the $1.42 resistance is now drawing attention. This level has acted as a strong supply zone, with each attempt to break through met by selling pressure. As a result, momentum has visibly slowed, and price is beginning to coil below resistance.
This type of price action often precedes either a breakout or a retracement, and current signals suggest a retracement is more likely. A pullback would not necessarily be bearish — in fact, it could offer the opportunity to solidify the uptrend with another confirmed higher low.
The $1.00 level emerges as the most probable area for a bullish reset. It aligns with the 0.618 Fibonacci retracement from the recent swing low to high and also acts as a historical demand zone. This confluence adds weight to the idea that price could bounce from this level if tested.
If Fiat Coin reaches this area and holds, it would reset the momentum structure and set the stage for another rally attempt. Holding this zone would also preserve the higher low pattern that has defined the current uptrend.
What to Expect in the Coming Price Action:
Should Fiat Coin retrace to the $1.00 support and hold, expect a bounce that could eventually retest the $1.42 resistance zone. A successful reclaim of this key level would signal renewed bullish strength and continuation toward higher targets.

Let the fart rip Excuse my language but it Might rip an time soon 💨💨💨
Memecoin rotation going on
Not a financial advice
Fartcoin should retrace, which would be healthyI am in a short on Fartcoin. Price is above the fresh pwPOC -> highest risk for new longs, biggest opportunity for shorts. Also the last pwProfiles are overlapping which is a sign of a potentially aged trend. The bearish sequence is not active yet, but the foundation that is currently forming would be an amazing confluence for the trade. Also, price did not find acceptance above the pmVAH yet (so far) and this is also a rejection off the pwPOC for a potential FTR, which would lead to lower prices aswell. So this is really no trade or a short. If the current high gets broken, it would destroy a potentially bearish foundation for the sequence and potential for further downside. Then price could start to find acceptance above for bullish continuation. So the current high is the invalidation for this idea. If price would manage to bust through the pwPOC, then we have targets below but it becomes more tricky there. The fresh pwPOC would be the easiest TP and I would take most profits there.
Also: Since the beginning of last week value mostly built lower. Yes, we had aggressive shorts down there but they got squeezed. If this would be a lot more bullish, then value needs to shift to the current upper place. It didn´t so far, which could be an additional confluence.

TradeCityPro | FARTCOIN: Watching Trendline & RSI for Next Move👋 Welcome to TradeCityPro!
In this analysis, I’m going to review the FARTCOIN token. This project is one of the meme coins that launched in 2024 and has shown good growth so far.
🔍 This meme coin currently has a market cap of $1.31 billion and ranks 65th on CoinMarketCap.
📅 Daily Timeframe
On the daily timeframe, as you can see, the price recorded a major top at the 2.16674 zone in early 2025 and then entered a correction phase.
✨ This correction phase was quite long and extended down to 0.21562, but after a bottom was formed in that area, bullish momentum returned to the coin and it started moving upward again.
✔️ Currently, the price has moved up to around the 1.53002 level and has a rising trendline that it has touched several times, serving well as a dynamic support level.
📊 For now, the issue with this trend is that the volume has significantly decreased compared to the previous leg, which could indicate weakness in the upward trend. We need to wait and see whether buying or selling volume increases in the next move — either a correction or another bullish leg — to confirm whether the trend will reverse or continue.
📈 For a long position, 1.53002 is the closest trigger to the current price. If this level is broken, the price could move toward 2.16674.
🛒 The main confirmation for a bullish continuation and a strong long position would come after the breakout of 2.16674. That’s also our trigger level for a spot buy.
🔽 To turn bearish, the key trigger is breaking the 0.63121 support. However, a riskier trigger would be breaking the trendline and activating the 1.00301 trigger. If that happens, we can consider it confirmation of the beginning of a correction.
💥 The RSI oscillator is currently forming a clean box between 50 and 70 and is now near the top of this box. If RSI enters the Overbuy zone, it would strongly confirm a long position.
📉 For a trend reversal or the start of a correction, a sustained RSI move below 50 would provide confirmation.
📝 Final Thoughts
This analysis reflects our opinions and is not financial advice.
Share your thoughts in the comments, and don’t forget to share this analysis with your friends! ❤️


Fartcoin 24hr potterboxwell it looks like the fartcoin is bouncing off the top of the box. and turning red lets keep a eye on it. Happy trading.

$FARTCOIN Update!!$FARTCOIN has successfully bounced off the ascending channel support, aligning perfectly with the 200 EMA and previous breakout zone.
This confluence adds strong confirmation to the bullish setup. The price now targets the channel's upper boundary around $1.63, offering a solid risk-to-reward trade opportunity.
The momentum favors the bulls as long as the structure holds and the price stays above the breakout zone.
Any pullback can be seen as a chance to accumulate with a tight stop-loss of $0.92 just below the support area.
This setup looks technically sound and is for a continuation toward higher levels.
Keep your eyes on volume!

Fartcoin 24hr potterboxI have drawn a potterbox for the fartcoin 24hr time frame, and you can see it is bouncing off the floor and hopefully going back up. using the laws of three and the powers of three. this has made this same pattern before.as i have circled the 3 places and if you count the three candles it will tell you whats about to happen. Good luck and have a great day. I am not really sure if you can use the potterbox strategy on these coins but it gives you a idea of support and resistence😁

Fartcoin Corrects Into Macro Support — Decision Point atFartcoin just tapped into a pivotal area after a fast drop that erased over 10% in value. The $0.91 zone now stands as a crucial test—not just because it’s a recent low, but because it aligns perfectly with key technical structures.
We’re talking about the 0.618 Fibonacci retracement drawn from the last major impulse, stacked directly with VWAP-based support from recent highs, and also overlapping a previously swept swing low. These confluences don’t appear often—and when they do, they usually set the stage for an inflection point.
From a structural standpoint, this is the macro higher low that needs to hold if Fartcoin is to maintain its bullish progression. However, one red flag is the continued decline in volume during this drop. Without notable buy-side volume stepping in, the bounce play loses credibility. On the flip side, if we see responsive demand enter here, the path toward a reversion to the $1.29 swing high opens up again.
This isn’t just a bounce-or-die moment—it’s a level where the market needs to show intent. If $0.91 fails, we shift from a structure of higher highs and higher lows into the risk of a lower low forming, potentially resetting the trend altogether.
Bias Summary:
Bullish Bias: Holding $0.91 could lead to a rebound toward $1.29 if accompanied by volume.
Bearish Bias: Failure at this level breaks macro structure and likely signals a deeper correction.

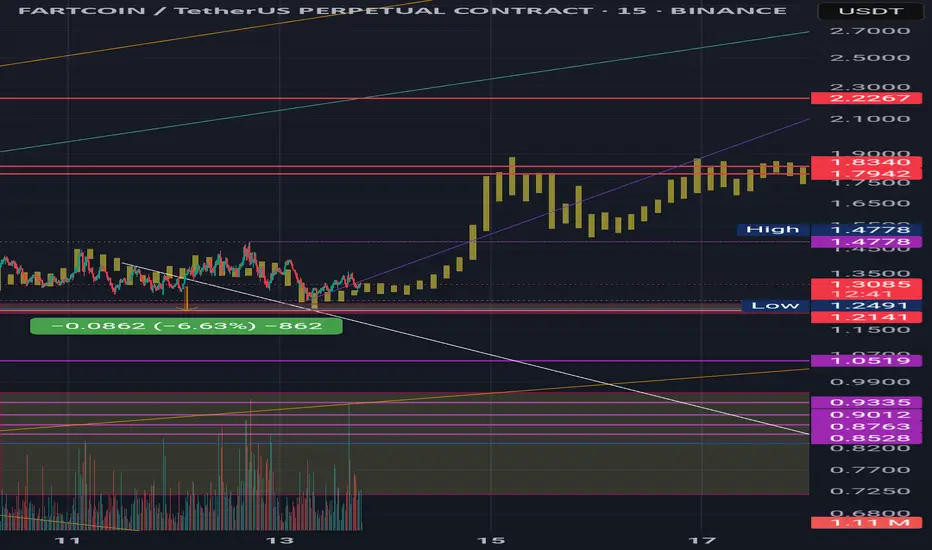
FARTCOIN weekly planIn this idea I marked the important levels for this week and considered a few scenarios of price performance
Write a comment with your coins & hit the like button and I will make an analysis for you
The author's opinion may differ from yours,
Consider your risks.
Wish you successful trades ! mura

FARTCOIN Breakout and Potential RetraceHey Traders, in today's trading session we are monitoring FARTCOIN for a selling opportunity around 1.1650 zone, FARTCOIN was trading in an uptrend and successfully managed to break it out. Currently is in a correction phase in which it is approaching the retrace area at 1.1650 support and resistance zone.
Trade safe, Joe.

Fartcoin: Is the Smell of a Downtrend in the Air? 📉 Fartcoin: Is the Smell of a Downtrend in the Air? 💨
🚨 Alert: The RSI is holding its nose... and so should we.
After a suspiciously bubbly rally, $FARTCOIN is now showing bearish RSI divergence on the 4H chart — and let’s be honest, it’s starting to stink. 🦨
The recent price action looks like someone tried to pump it... but forgot to ventilate. 💣💨
🧻 Support is about to get wiped.
💩 MACD says momentum is going down the drain.
🚽 Volume drying up like gas after Taco Tuesday.
TA Summary:
RSI Divergence ✅
Rising wedge (aka clogged pipes) ✅
Community still in denial? ✅

FARTCOIN! Yet another move to come??HEYYY Fart is back!! I have attached my recent mega fart pattern which would be able to be relocated at the bottom of this page!
Look at this it - it shows a notable slowdown and rotation phase after a strong move.
From the left of the chart, price had a bullish breakout around April 27–28, with a large session where VAH and POC shifted up aggressively and volume built high near $1.24. However, that impulse seems to have faded. Since May 1st, we can observe balanced profiles with POCs aligning flat near $1.12 to $1.09, indicating market indecision and acceptance in this range.
Importantly, the last session has compressed with VAH, VAL, and POC almost overlapping near $1.09–$1.10, showing low conviction and suggesting a potential breakout build-up. If price breaks above $1.11 with good volume, it may retest $1.14–$1.17. If we lose $1.08, we could rotate lower to $1.05 or even $1.00 where older value sits.
NOwwwwwww what I can say is - in the mean time look at the charts on my doodle, the green downfall is necessary for a more good move, but can defy that in an extent because it already fell!!

FART-The 200% Explosion That's About To Correct – PREPARE now
## The Most Deceptive Chart Pattern In Crypto Right Now 💣
The 4-hour FARTCOIN/USDT chart reveals a textbook example of parabolic extension that's setting up for a critical reversal. This explosive move (+13.93% today) has created the perfect storm for smart traders to position ahead of what appears to be an inevitable correction.
🔥 TECHNICAL ALARM BELLS SCREAMING:
💥 Triple Channel Overextension
* FARTCOIN trapped in powerful ascending yellow megaphone pattern
* Secondary gray channel providing momentum framework
* Price hitting upper boundaries of BOTH channels simultaneously
* Current price ($1.06284) testing resistance cluster
💥 Unsustainable Vertical Rally
* 200%+ gain from April lows ($0.35503) to current levels
* Extreme volume spike (634.2K) signaling potential exhaustion
* Parabolic acceleration far exceeding mean channel growth rate
* Candle structure showing early reversal signals at resistance
💥 Blue Forecast Path: The Smart Money Road Map
* Initial testing of $1.20 psychological resistance
* Multiple retests of the $1.00 psychological support
* Final capitulation toward $0.85-0.90 channel support area
Why This Pattern Is SIGNIFICANTLY More Important Than It Appears
This isn't just another correction—it's the classic "blow-off top" formation that has historically preceded major reversals in speculative assets. The confluence of technical factors suggests we're witnessing the final phase of a multi-week uptrend.
🧠 The Psychology Behind This Pattern:**
* Retail FOMO creating final buying surge
* Smart money distribution happening during high volume spike
* Divergence between price action and momentum indicators
* Pink consolidation zone formed perfect launchpad for final push
## The ACTIONABLE STRATEGY For Maximum Protection & Profit
For CURRENT HOLDERS:
* Consider taking partial profits above $1.10
* Set trailing stops at $1.03 to protect gains
* Prepare for 20-30% retracement possibility
For NEW POSITIONS:
* Primary entry zone: $0.88-$0.92 (lower channel support)
* Potential secondary entry: $0.98-$1.02 (psychological support)
* Invalidation point: Sustained trading above $1.20
Risk:Reward = 1:3 on counter-trend positioning
The Hidden Market Dynamics Few Are Noticing
The explosive move coincides with broader altcoin rotation and appears to be sector-specific rather than fundamentally driven. The technical pattern suggests institutional distribution rather than accumulation—a critical distinction for timing the reversal.

FARTCOIN → Moving into the realisation phase. A rally?BINANCE:FARTCOINUSDT.P has entered the buying zone, or the realization phase, after breaking through the resistance of the ascending triangle. The altcoin is within an upward trend.
Bitcoin continues to consolidate ahead of a possible rise. FARTCOIN has entered the buy zone at this time. The realization of Bitcoin could trigger continued growth in altcoins
FARTCOIN is entering the realization phase after consolidating within an uptrend and an ascending triangle. The coin looks quite positive overall, but a retest of 1.2100 may form before growth.
Resistance levels: 1.2933
Support levels: 1.0719, 1.0632
There is significant resistance ahead on D1, and a small correction to the nearest liquidity zone at 1.2097 may form. However, consolidation against 1.2933 is expected before a breakout and continued growth.
Best regards, R. Linda!

FARTCOINFARTCOIN has broken structure on the higher timeframe forming new demand zones. I will be looking for longs as the strend is still moving up. I found a good orderblock that lies next to the displacement candle of the liqduitity. I will likely be entering on that!

Fartcoin - weekly plan In this idea I marked the important levels for this week and considered a few scenarios of price performance
Local important support in the range of 1-0.96, if this zone will be broken, there is a chance to see a deep correction. In case the price does not renew the local bottom, there are chances to see the achievement of targets 1 and 2
Write a comment with your coins & hit the like button and I will make an analysis for you
The author's opinion may differ from yours,
Consider your risks.
Wish you successful trades! MURA
