Fetch.AI (FET) Looking At A Different Type Of SetupOk, we looked at MTHBTC and the higher low chart setup... It ends up with prices moving higher but this one is different... Let's have a look.
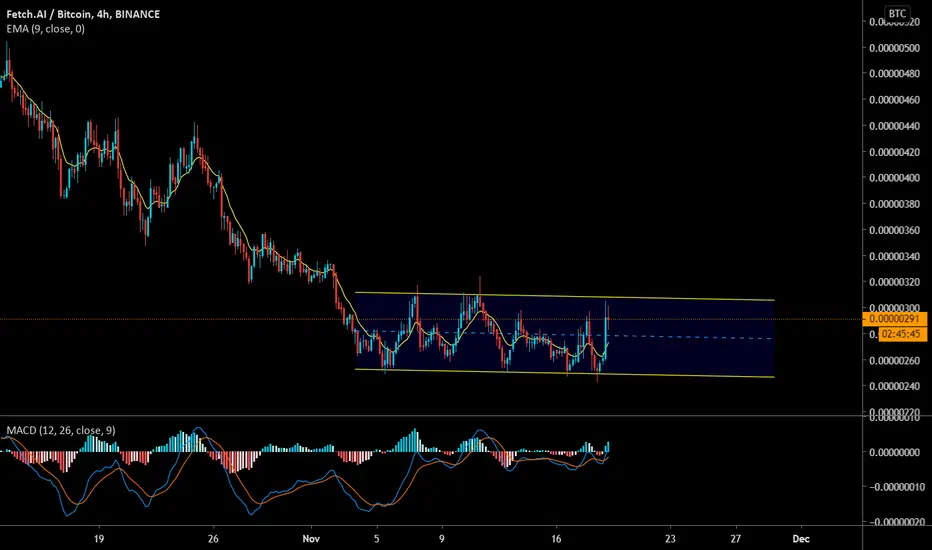
For FETBTC we have a falling wedge but there is no low followed by a higher low...
Instead, we see prices first printing a strong decline, and little by little they start to curve.
When we look at the end of the falling wedge, 5th November, same date, prices completely stop the drop...
Now it starts to go sideways; consolidation...
What's comes next? ...
The prices jump.
Let's continue with the signals...
As prices go flat we see a break first of EMA10.
We also get increasing volume and the RSI moves ahead.
Slowly but surely as time goes on, FETBTC will go bullish and grow.
This is me just reading the chart...
Trading would be a completely different game and here is how it goes.
The last low is your stop-loss and the resistance levels above it can be your targets to collect profits... That's all.
Can you see how simple this is?
Yes o no?
Share your thoughts in the comments section below.
Namaste.
FETBTC trade ideas

$FET, Showing some signs of life after a quick accumulation..$FET
Showing some signs of life after a quick accumulation over ~230 sats level..
Volume starting to rise but I would like to see it clearing ~300 sats level for an entry (R/S flip maybe?)
Worth setting some alerts!
#FET

FET/BTC Accumulation Zone!Hello Community!
Before we begin please support my idea with a thumbs up and a comment. It'll be greatly appreciated and will motivate me to post a little more!
Lets keep it simple.
When taking a look at FET/BTC on the 4 hr TF, we see it trading in a parallel channel after it's long decent. This channel is also a temporary accumulation zone before another big move. It's currently trading at the top of the channel and can easily break through and begin the blast off or it can continue to trade in this zone. If going long, the area of value will be towards the bottom of the channel. Manage your risk and trade with a tight stop to minimize loss.
This is not Financial advice.
Safe Trading Calculate Your Risk/Reward & Collect!
Simplicity Win

🎓#SpotTrade 🎓 $FET / BTC 🎓🔸Signal Info: Fetch AI
Rank: #173
Exchange: Binance
Direction: LONG
🔸Analysis: FET is a buy. Lets go over a few things we can observe on this daily chart. Earlier this week, the coin crossed down into a new trading range, established through may earlier this year. This drop synced up well with a bottom side trend break along the green line. This week has seen a positive structure build up here. This flat top triangle has been filled in well, and it'll make a good swing up to the trending curve above. Looking for the entry on the bottom size of the triangle.
🔸Indicators: Our indicators are the standard RSI and our trusty PXI (hashedplutus.com). I scouted this coin out by filtering for a +35 crossing on the RSI, and the chart just looks fantastic the way its building up to this crossing. Our PXI buy signal should trigger on the days close. All things signal a go for Fetch AI
✖️5 Multiplier
🔸Current Price: 290sats
❇️Entry: Limit 75% @ 279sats, Market buy 25%
🎯Take Profit: 312sats (+15%~75%), 351sats (+30%~150%)
♦️Stop Limit: 260sats (-4%~20%)


fetmost altcoins resistance hits0 in december 1st but they wont breakout unless bitcoin hits 20 k cause after this resistance there is a price discovery starts which means bitcoin is goin to break 20 k before december 1st and alt run is about to fuckin hit unless they r goin 0

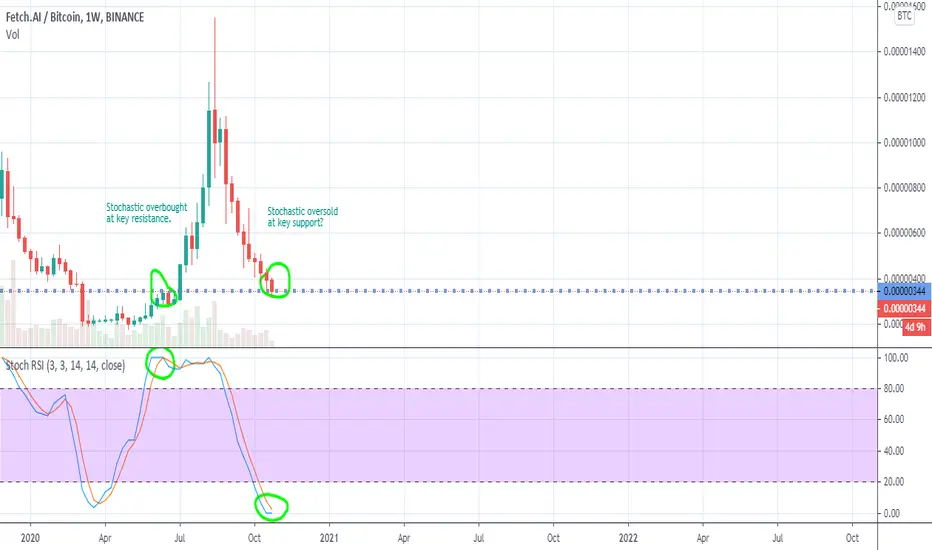
PeculiarAn interesting relationship between the stochastic RSI and the price action. Are there clues here about potential price movement to come.
*Full disclosure: I am long. I think we are in the ballpark of a major impulsive move to the upside. Perhaps, not yet seated in the stands, but definitely in the parking garage walking through the arena doors.
FETBTC | This is my pan
FET is forming a Bearish Cypher pattern against BTC, with the CD leg forming as we speak.
Price Rejected at the 1.272 Fib extension, confirming the formation of a cypher.
Also forming a falling wedge, indicating an upward relief rally.
Im Long


FET keep it simpleFET needs to stay above 372 (weekly key support).
The next support will be 292 in case of losing the first one.

FET Weekly looks really nice :-) Is this possible?Call me Crazy :-) Lets try this!
What do you think?!


FET BTCOur Crypto today:
FET BTC, the circle-marked areas are pins imposing bearish pressure to complete leg 'e' on its lower high. Our tp is at 0.0000436
All of my market shared technical set-ups are speculative, they are not guaranteed for accuracy or in completeness in the form of any content. At this profile page, the analysis, ideas and also, the strategy of a chart belongs to Khiwe; -it is not to advice on financial markets; please apply your own analysis and confirm it with price action.


FETBTC - Long - Potential 13.20%321) FETBTC - Long - Potential 13.20%
Entry - 447
TP1- 472
TP2 - 507
SL- 405
Please follow & like if you are a fan of the idea
Possible TP3 at 507 but risky

FET retraced to major support levelWith Staking 2.0 release in October and a full retrace to major support levels, FET is one of the most promising coins of the list.

FET/BTC (Retest Previous Key Support)💎Technical Analysis Summary💎
BINANCE: FETBTC
-After the recent small run-up, Fetch.AI is back at previous key support
-The big question we have is, will this support hold again?
-Tough to answer this one right now so we need to be careful
-My advice is to wait for a few days until it forms a base of support
-And zome in on 4H timeframe to look for early buy entry
A big Thanks for donating 💰 via Tradingview coins this week to seba26-77 🙏🎉
``````````````````````````````````````````````
Trading Involves High Risk ⚠️
Not Financial Advice 💸
Please Exercise Risk Management 💱
``````````````````````````````````````````````
If You Like My Daily Published Ideas 👍
A little Help By Supporting My Channel 📺
Through Leaving A Thumbs Up, Comment & Follow 💬
Happy Trading! ➡️ Thank You! 😊
``````````````````````````````````````````````


FETBTC - C&H Weekly + Forming C&H 4H - 40% TargetI'm bullish for reasons:
1. Weekly Cup & Handle
2. Weekly HK Doji signs of reversal
3. Price breaks the 0.5 RED resistance and hopefully will hold as support
4. Bullish Divergence already played out (inside vertical lines)
5. S&R Flip (resistance becomes support to hold the Handle in the Cup
Buy Area @ 0.382, 0.5, 0.618 RED Fib
Stop below 0.618 BLUE Fib
Targets @ 0.236, 0.382, 0.5, 0.618 RED FibEx

Fetch.AI (FET) Support Confirmed, Bullish, Next Target MappedFETBTC looks very similar to the ANKRBTC chart we shared recently.
Prices found support at the MA200 black line.
A strong bounce is taking place and we see resistance after resistance in the form of EMAs being conquered.
We also have a falling wedge breakout and bullish indicators, MACD and RSI.
All these are bullish signals that tell us that this altcoin pair can continue to grow.
NOTE: If prices were to drop, the main support is now at 0.00000453.
Moving below this level would invalidate the above signals.
Remember that it is recommended/necessary for good results when you trade, to have a plan/strategy in place before buying any pair.
This is not financial advice.
Namaste.
