FETBTC trade ideas


Parabolic Moves ! FET/BTC #FET #FetchAI $FET Here we see our FET 3 day chart and as you see we broke out last night ! Coming very close , as expected, to our high from last Summer near 1550 .With Mainnet coming in 3 days we seem to be entering into a Parabolic upward movement here .You see where the green arrow is on the chart ? That shows an obvious Kumo Twist on our Ichimoku Cloud - ( also known as a Kumo Breakout ) and it's very Bullish ! . We are also about to have a Golden Cross happen with our light blue 50 MA going to cross up and through our dark blue 200 MA . Next target above us is 3200 - 3420 area ,which is near strong resistance and our .236 fib. I'll link the fib targets in my other chart below . This looks great , extremely bullish chart . Now there can always be some pullback along the way as well as consolidation - I'm not saying we go to 3200 and above tomorrow - but it is definitely looking good for April and beyond !


FET will test ath in btc pair this yer..longterm holdYOUR LIKE OR COMMENT IS MY FUEL FOR NEXT ANALYSIS :) IF U HAVE ANY QUESTION REACH ME HERE
This is not a financial advice. Always do your own research and always put stoploss in your trade (SL) :) If you want more detailed info how to study and read charts or just need help with some coin, just write to me here a comment, i will try to answer to everybody... i can help you :) all for free, don't worry, BE HAPPY!

Started From The Bottom FET/BTC #FET $FET #FetchAIHere we see our FET 6 hour chart on Binance .If you remember just a couple days ago FET had almost reached to 1400 - and last Summer's high of 1550 seemed to be close . But of course Bitcoin dumped last night and everything has pulled back- as expected in that situation. FET has pulled back to 1120 area and could obviously go a bit lower . But see where that green key is on the chart ? That shows you our price action is still above the Ichimoku cloud . I see more upside for FET all this year . 2021 is the Bullrun year and altseason should start very soon imo .FET has very good news soon , with a Mainnet coming in 6 days and an AMA happening today with them. I'd say things look bright for the future and I would definitely not get shaken out . Did you come all this way to leave now ?


Bull Flag ? Let's Run It UP ! FET/BTC #FetchAI $FET #FETHere we see our FET 2 hour chart from Binance . And inside those black lines it appears we have a Bull Flag forming . This is bullish and should break up after it finishes it's consolidation.If you don't know what a Bull Flag actually is - it's a formation you will find on a chart that has a strong uptrend in place. This uptrend can almost look like a Flagpole- hence the name. A pullback happens forming the "flag" of this pattern and after it is finished consolidating it will break upwards . So where that green arrow is on my chart I expect to see this break up . Could be tomorrow or could be next week - it's hard to say . But we will see FET start a rise towards it's previous high of 1550 from last Summer at some point. And then onwards after that . I'll post my previous FET chart below.

Final Destination? FET/BTC #FetchAI $FET #FETHere we see our FET weekly chart and you can see it looks great, we are already wicking into the Weekly Ichimoku cloud. See that red dotted
line ? With the orange arrow pointing at it ? That's our last Weekly resistance and looks like it's a target we could be seeing soon . If we are entering a small altseason for the next month then this resistance line near 3231 could definitely be a target .It is also right near our .236 fib at 3420 . I would definitely love to see FET go to at least between 3200 to 3400 by mid April but it's impossible to predict a timeframe there . All I can say is we look great to have continuation- first stop is still our previous high from last summer of 1550 .


Only Way Is Up FET/BTC #FetchAi #FET $FETHere we see our FET 3 day chart from Binance . You see our Ichimoku cloud has clearly started to turn up .This is going to break up and the ends of the cloud will twist up to form a Kumo Twist - or Kumo Breakout .It's extremely Bullish . We will almost certainly revisit our high from last Summer of 1550 sats . Next stop up after that should be the .236 fib near 3420 . FET looks great .

FETBTC - Long - Potential 11.84%FETBTC - Long - Potential 11.84%
Exchanges: Binance
Signal Type: Regular (Long)
Entry Targets:
1) 0.00000902
Take-Profit Targets:
1) 0.00000949
2) 0.00001009
Stop Targets:
1) 0.00000822
Trailing Configuration:
Entry: Percentage (1.0%)
Take-Profit: Percentage (1.0%)
Stop: Breakeven -
Trigger: Target (1)

Target Practice FET/BTC #FetchAI #FET $FET Here we see our FET BTC weekly chart from Binance . You can see our colorful fib levels on the right side of the chart - and our possible price targets have check marks next to them . FET just had an AMA talk earlier today in their chat group and their chart looks great - now sitting over 900 sats . I predicted we would be hitting this area and that our next stop up will probably be 1550 - marked by the blue line with pink checkmark on our chart - because of course this was our high from last summer. And we should be revisiting 1550 fairly soon in my opinion . After we gain that level I would expect our targets to hit at the fib levels above us which should be as follows =
3420 - that's our .236 fib - I would say there is a very high probability of hitting this fib
5443 - that's our .382 fib
7077 - that's our .5 fib
8712 - that's our .618 fib and in a Bullrun year I would expect us to get here but that could be later in the year . Of course , our targets can also
go higher than this but let's take this one stage at a time. FET has a Mainnet end of March - so less than 3 weeks from today - everything looks great here !

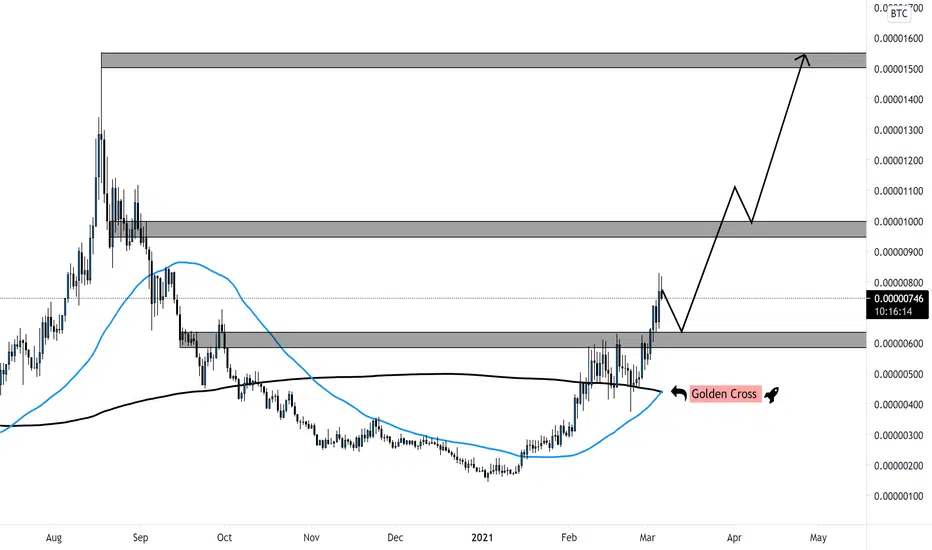
April Jewels -3 Day Golden Cross in Apil ? FET/BTC #FetchAi $FETHere we see our FET 3 day chart on Binance . You can see our light blue 50 MA is looking to turn up into our dark blue 200 MA and that could mean a Golden Cross happening here on our 3 day chart as it just recently already happened on our 1 day chart ! In case you didn't know - a Golden Cross is extremely Bullish especially on higher timeframes like 1 day , 3 day , and 1 week charts . And a Golden Cross is when our 50 week moving average crosses up and through our 200 week moving average - which looks like it will happen on our chart sometime i n April where you see the rocket on my chart . This looks great already but add in the fact that FET is having a Mainnet at the end of March and you have an extremely great scenario for all of us who are trading or holding FET . I personally would like to see Fet approaching 5800 - 6000 sats in Summer but we almost certainly will go over 1000 sats soon and a target still seems to be that blue line on my chart near 1550 - which was our high from summer 2020 . Looks great and Good Luck !


Golden Cross on FET/BTC DailyGolden Cross: The golden cross is a technical chart pattern indicating the potential for a major rally.
This is NOT Financial Advice. Trade at your own risk! NO ONE is responsible for your financial decisions except YOU!
DYOR!


Golden Cross Hi guys i hope u enjoy it
Golden Cross : When the shorter MA 50 day scrosses above the longer term MA 200 days it's a buy signal (big pump)
and i think we can buy it in deep because of BTC want dump i think and its good news for us
FET lookd goodYOUR LIKE OR COMMENT IS MY FUEL FOR NEXT ANALYSIS :) IF U HAVE ANY QUESTION REACH ME HERE
This is not a financial advice. Always do your own research and always put stoploss in your trade (SL) :) If you want more detailed info how to study and read charts or just need help with some coin, just write to me here a comment, i will try to answer to everybody... i can help you :) all for free, don't worry, BE HAPPY!
********************************************CHECK MY LATEST ANALYSIS DOWN BELOW********************************************

Lovely Day FET/BTC #FetchAi $FET #FETHere we see our FET Btc 3 day chart from Binance . As you see we surged to 800 sats last night and we are now inside the 3 day Ichimoku cloud and that means we should almost certainly go to the top of this cloud near 875 sats where you see that pink arrow pointing . At that point I would expect to see a bit of consolidation before more rise - probably going up to revisit our high from last summer of 1550 sats - you can see that where the blue line is on my chart above us. Where this gets interesting is that when we get to the top of the 3 day chart near 875 that will have us wicking slightly into the weekly cloud ( the bottom of which is near 860 sats ! ) And it will be a truly lovely day when we enter that weekly cloud . Anyway FET looks great for the first half of 2021 and also has a Mainnet coming at the end of March .


