FETUSDTCryptocurrency Futures Market Disclaimer
Trading cryptocurrency futures involves high risks and is not suitable for all investors. Cryptocurrency prices are highly volatile, which can lead to significant gains or losses in a short period. Before engaging in crypto futures trading, consider your risk tolerance, experience, and financial situation.
Risk of Loss: You may lose more than your initial capital due to the leveraged nature of futures. You are fully responsible for any losses incurred.
Market Volatility: Crypto prices can fluctuate significantly due to factors such as market sentiment, regulations, or unforeseen events.
Leverage Risk: The use of leverage can amplify profits but also increases the risk of total loss.
Regulatory Uncertainty: Regulations related to cryptocurrencies vary by jurisdiction and may change, affecting the value or legality of trading.
Technical Risks: Platform disruptions, hacking, or technical issues may result in losses.
This information is not financial, investment, or trading advice. Consult a professional financial advisor before making decisions. We are not liable for any losses or damages arising from cryptocurrency futures trading.
Note: Ensure compliance with local regulations regarding cryptocurrency trading in your region.
FETUSD trade ideas
FET Wave 2 Complete?NYSE:FET (Fetch.ai) appears to have completed a wave 2 pullback and looks set for the next move up towards $1.1
Price swung below the bottom of the wedge, tested the S1 daily pivot and 61.8 Fibonacci golden pocket. It quickly recovered with a bullish engulfing daily candle negating the 3 previous days bearish price action.
A close above the top wedge line and daily pivot will be the signal to go long again.
Analysis is invalidated below $0.54 and that will bring up a downside target of $0.34 which is the ascending macro support from June 2023.
Safe trading

Fetch way five up two waves down?Fetch looks to consolidate down to the .618 fib level .63? fetch topped out at .72 not quite break out 7.4.. Looks like .72 was the high or will a bounce of support and go on a wave five break out?

Is Fetch heading for long term support?Looks like fetchHe's heading for long term support about the .50 which is the fifty percent retracement level. After this, will it bounce back the .090 or higher.

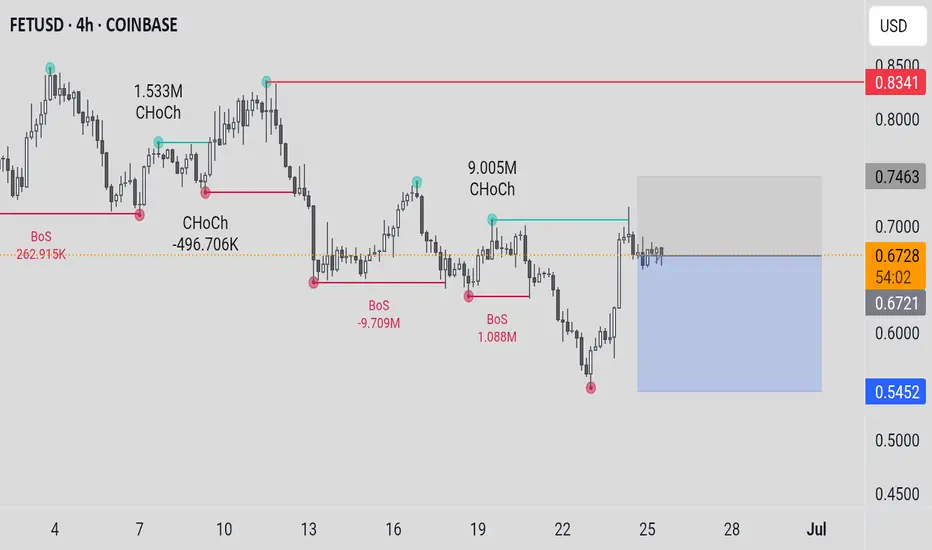
FETUSD – Post-Breakout CooldownFetch showed a period of quiet sideways movement before breaking out sharply toward $0.70. The rally was followed by a rejection and pullback near resistance, currently stabilizing above $0.675.

FETUSD is an excellent buy, targeting at least $3.75Artificial Superintelligence Alliance (FETUSD) or otherwise known as FETCH.AI has been trading within a multi-year Channel Up and right now is on its latest Bullish Leg and quite possibly the last for this Cycle.
Given that all similar Bullish Legs that started with 1W MACD Bullish Crosses that low, grew by at least +1012%, we expect a minimum Target for this Cycle at $3.75. If it follows the more aggressive +2041% rise of 2023/ 2024, we can even see $7.00 but that is the more optimistic scenario.
-------------------------------------------------------------------------------
** Please LIKE 👍, FOLLOW ✅, SHARE 🙌 and COMMENT ✍ if you enjoy this idea! Also share your ideas and charts in the comments section below! This is best way to keep it relevant, support us, keep the content here free and allow the idea to reach as many people as possible. **
-------------------------------------------------------------------------------
💸💸💸💸💸💸
👇 👇 👇 👇 👇 👇

FETAI SURGING TO 2$ canadian by summer. Perfectly bouncing in the support resistance bull climb dating back to when the coin first came about BUY NOW

Fet (Daily) Elliot Wave ii underway after ending diagonalFetch appears to have completed a motif wave (1) with an ending diagonal after finding a bottom at the major support high volume node (HVN) macro wave 4.
Wave 2 has not retraced as deep as other alt coins showing strength in the move up. The downside target is just above the wave (1) swing high, the 0.618 Fibonacci Retracement.
Wave 3 should be a powerful move up taking price into all time high.
Failure to hold this support could see price heading back to fresh lows and testing the $0.35 HVN once more.
Safe trading

Fet.ai will be 10$ cad eoyWith Ai advancing in tech and crypto, with the potential of crypto and Ai.. this is a winner of a coin.
Been volatile BUT stable.
Support in the channel it dates back to 2021.
Buy zone .80/.87 looking for 1.16/1.60 usd or cad equivalent for small profit take

FETUSDTSET UP BUY LIMIT FEDUSDT 📈📝🚨🚨
DISCLAIMER:
what I share here is just personal research, all based on my hobby and love of speculation intelligence.
The data I share does not come from financial advice.
Use controlled risk, not an invitation to buy and sell certain assets, because it all comes back to each individual.

FET Vs Global Liquidity FETUSD (Blue) / Global Liquidity (Yellow)
Global liquidity if offset by 78 days.
Could be a significant uptrend in the pipeline.
Not advice.

Wyckoff distribution on FET/USDI noticed this Wyckoff distribution pattern that has formed on the 1h time frame for FET/USD and it convinced me this might be a good time to step out and wait.
The crypto market has been going sideways since last week now and we didn't really get a strong rebound after the selloff a few days ago. Even with the positive Macro news it's starting to feel like there's just not enough buyers around right now to push BTC and everything else to higher highs. My advice is to be cautions now and wait for a correction, then enter at more favorable prices.

FET - Next Pump Comin SoonFET
Looks like a 3 wave correction with shallow and cause building 3rd wave that you could call a Wycoff Creek.
Could be a great buy right here; looks set to pump again soon.
FET apparently is a super big deal in AI and it has a super long name to boot.
This coin really does pump hard.
If you can buy the dip right then it can be a great ride.
This was a deep dip back in the 2023:
And the first solid dip in this wave up was as the 2 week candle closed a hammer within a 1:1.618 Golden Window.
And this is a nice opportunity here before this coin becomes a runaway train again.
Not advice

FETUSDI sold every single FET I had at around 2.50s in May 24 and I've not been really interested in it since then, apart from a few short term traders. It's always been a terrible asset to trade frequently, a pain to wait for it to do its thing and then everything happens in a matter of few weeks. As if it's not enough, the merger made it even less attactive.
Anyway, this chart is from December and finally it's in my buy zone. If the qFVG doesn't hold, then i think it'll go down to htf golden pocket for a 98% retrace from ATH. The team behind is relentlessly building and making partnerships, so i think its time can come again.

FETCH AIsweet spot to buy, but this danger if u in the market use leverage.
better spot market time to dollar cost averaging.

FETUSD - Recovery From a Double TopShowing my thoughts with the bars pattern tool in green
The red circles contain two double top patterns
I expect price to recover below the lower white line and then move back up into the channel following short term time below this white channel
Daily timeframe


After an 80% Drop, Is FET Finally Ready to Reverse?Exactly one year ago, FET reached its all-time high of $3.5, but since then, it has experienced a steep decline of over 80%.
However, the coin has recently found strong technical support around the $0.45 zone, which, in my view, signals a potential rebound on the horizon.
Currently, FET is trading near $0.52, and from a psychological standpoint, being around a key round number and its Binance listing price, we could see a bounce from these levels.
With this in mind, I anticipate a trend reversal, with an initial target of $1 in the near future. Additionally, $0.80 stands as a significant resistance level and could serve as an interim target before further upside movement.
From a risk-reward perspective, this setup offers an attractive 1:5 ratio

Breakout on the horizonLooking on the daily timeframe, we've seen a clear downtrend from the $2.24ish highs, with price respecting this descending trendline for months. However, we might be approaching a significant reversal opportunity.
If price can close decisively above the trendline, this could trigger a significant rally targeting the $1.00 psychological level first, with potential to reach the $1.05-$1.12 zone.
Entry strategy:
Stop loss below recent low at $0.46
First target: $1.00
Second target: $1.12

FETUSD - Last year move about to hit ?x3 on this one
Open : 0.8
SL : 0.599
TP1 : 1.5 // 10 to 100% (depends on the date we hit it)
TP2 : 3.2 // 25% to 100% (depends on the date we hit it)
TP3 : 5 // 50 to 100% (depends on the date we hit it)
Note the similarity between, 16 feb 2024 and 2025 setup

one of the cleanest breakout retests in the market right now Fetch ai is a great buy based on trendlines, easy 100%

FETUSD Support Levels - Buy Looking for buy entries on FETUSD at $0.42 and $0.15
Feels like we are being blessed with amazing entries on many of these tokens.
Merry Christmas.

50% Jump incoming!Price has reached a critical support zone - Looking for strong rejection or breakdown.
Bollinger Band Contraction
Bands (purple lines) showing significant narrowing
Price consolidating near the lower band
Squeeze pattern suggesting imminent volatility expansion
TTM above zero line
VFI (Volume flow indicator by Markos Katsanos) (not shown on chart)
Crossing above zero line - buy signal
Given the bearish context, any long positions require tight stops
