FET long setupAI play. Target/stops marked on chart. Target 1 127% fib extension, target 2 161% fib extension, let 1/3 of position run long term
FETUSD trade ideas

I caught the bottomThe final wave of this 7 wave correction has completed with bullish divergence on the 4hr chart and I will be taking my first profit at the .236 fib retracement line of the 7th wave for an 8%+ trade.
I believe this is just the beginning of a larger impulse wave about to run up to $.86 for a 1:1 fib from the last large impulse wave from the beginning of December which is an increase of 165% increase from where we are now.

FET leading the AI sectorHi All,
Breaking out from the bullish flag/falling wedge!
4th Elliott wave completed! Now we are heading for the last 5th impulse - target at 1.618 Fib extension which exactly coincides with the macro .618 retracement from the bear market downfall move. 80c price target is coming.
Nice reward/risk ratio: 3.2
GL&HF ;)

Revision: Fetch weekly long gameI misspoke in my previous iteration. There's a hidden bullish divergence indicating a trend continuation on the weekly chart. Placing the long position with the SL at the previous swing low and setting a 2:1 P:L ratio it appears to be possible to attain a 50% return.
In the previous iteration I erroneously mentioned a 2x potential when it's a 1.5x potential.

Weekly Fetch long gameWeekly chart shows a bullish divergence just before a doji. Watchlist. If Bull run confirms next Sunday the standard 2:1 P/L ratio indicates an opportunity to potentially 2x on a single long position

FETUSD (1H) - Bullish breakoutHi Traders
FETUSD (1H Timeframe)
The market is in an uptrend and we are waiting for an entry signal to go LONG above the 0.3522 resistance level. Only the downward break of 0.3365 would cancel the bullish scenario.
Trade details
Entry: 0.3522
Stop loss: 0.3365
Take profit 1: 0.3617
Take profit 2: 0.3773
Score: 8
Strategy: Bullish breakout


Big Move ComingFET is putting in an 8 week flag with volume drying up in the base (sell pressure subsiding) and weekly RSI reset. Think this is ready to breakout and move towards the ATHs in the coming weeks. The Fetch Ignition campaign is 3-4 weeks of updates & announcements, which will likely act as the catalysts to get us there.
AI is one of the biggest narratives that is likely just beginning.

🚀 FET is bullish in the short term 🚀 FET is bullish in the short term with a good ratio. Happy trading! #FET 💰

Large Breakout ImminentFET developing a solid ascending triangle above the 21 EMA. RSI has been reset and sell volume has been declining in the base. Think it goes for the breakout shortly. Ideally, FET heads for the ATHs and bases for 2-3 months before a big move this summer.
AI names got a huge boost due to ChatGPT and is shaping up to be the narrative of 2023.

FET/USD trading ideaFetch is printing a nice and long ascending triangle which give us oppurtunity to take advance of it. A 50-60% move to the upside will be possible in the coming weeks if we can break out of the triangle to the upside.

FETUSD IdeaHi get in or get out of here
I wouldnt be typing more but tradingview doesnt let me to post...

FETCH.AI made a bullish, but do not FOMO.FETCH.AI. has hit a resistance. February is historically a bearish month. Do not FOMO on the AI hype. Look for consolidation first, then a potential stage 2 continuation. Always place your stop loss. Crypto moves fast. High risk high reward.

FET|USD Soars 326% in 30 Days: A Rapid Rise ReflectionsFetch.ai is a decentralized platform that provides AI-powered solutions for various industries, including finance, transportation, and energy. It uses blockchain technology to allow for secure and efficient exchanges of data and value, enabling the creation of autonomous economic agents.
Fetch.ai offers a range of products, including a decentralized marketplace for data exchange, a digital twin platform for modeling real-world systems, and a suite of AI tools for businesses and developers. The platform enables efficient, secure, and decentralized transactions between individuals and organizations, allowing for a more efficient and fair exchange of value.
Fetch.ai's vision is to create a decentralized, self-organizing, and autonomous digital economy, where data, value, and tasks are managed and executed by autonomous agents, allowing for more efficient and effective transactions. By leveraging the power of AI and blockchain technology, Fetch.ai aims to revolutionize traditional industries and create new opportunities for businesses and individuals.
A 1-day chart analysis of Fetch.ai (FET) can provide valuable insights for short-term holders of the cryptocurrency. By examining the price trends, volatility, and volume of Fetch.ai over the past day, it is possible to make predictions about the short-term performance of the asset.
For instance, a sudden surge in the price of Fetch.ai, accompanied by high trading volume, can indicate a sudden increase in demand for the asset, which can be a good opportunity for short-term traders to take advantage of the price increase and sell at a profit. On the other hand, if the chart shows a lot of volatility and price swings, it could signal a lack of market stability, which may be a concern for short-term holders.
Additionally, a 1-day chart analysis can also provide insights into the impact of any major events or news on the price of Fetch.ai. For example, if there was a significant spike in price following the announcement of a new partnership or product launch, this may indicate that the market is optimistic about the potential of the project and that short-term holders may benefit from this positive sentiment.
Overall, a 1-day chart analysis can provide valuable information for short-term Fetch.ai holders to make informed decisions about their investments. By monitoring trends and staying informed about market conditions, they can make more informed decisions about buying and selling Fetch.ai.

SHORT BITCOINI think Everyone in plus in this game should take profit and take money off the table .. we are got the short stoplosses now and double top was printed in , still in bearmarket only not that strong bearmarket maybe .. not advise do your own research
Fetch io is a small hint

FETCH.ai CRYPTO:FETUSD
FETUSD
I think after FET was listed on BINANCE Perpetual Futures ,
FETCH.ai start printing Wickoff Distribution Schema , maybe CZ want to buy more & dump more .. Couse i think all AI coins&stock will be next bubble in our life :) I am preparing for cumulate some of this , but who know ? I really dont know nothing ,this is not advice do your own research :D ... couse my ideas are 60% wrong ... I am only conspirate...

FET/USDT Updated IdeaOn the 1HR chart FETCH is making a full ascending triangle pattern which normally will be play out to the upside. The overall trend is bullish.
My 1st entry will be at 0.17 when it breaks out to the upside. When it will come back and do a retest I will do another entry.
Profit Points
TP1: $0,20
TP2: $0.219
Good luck

should see some downside first then strong bull movesame model back to the basics. Not taking this trade bc Coinbase doesn't allow OCO orders and I can't wait for it to play out all night

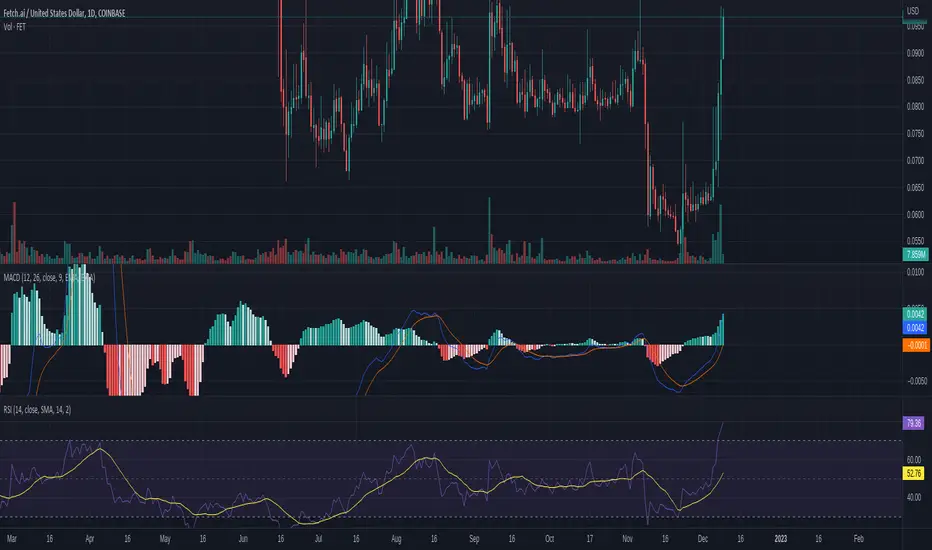
Watched FetchAI this week - 3 things all fetusdt HODLer loveWatched FetchAI this week
There are 3 things all fetusdt HODLer will love to see
1. a bullish divergence in the weekly RSI
2. price might close above volume profile $0,081 in a few hours
3. we see increase in volume after long decrease
Let me know your thoughts in the comments🤗
⬇️⬇️⬇️
Likes and Follow for updates appreciated🤗
Disclaimer:
Not financial advice
Do your own research before investing
The content shared is for educational purposes only and is my personal opinion

Trying to improve my recognition with this patternFor all of you pro traders ....
is this or is this not a quintessential " Bull Flag" on the daily, I am really looking for help in recognizing / trading this pattern......thanks

$FET to $.22-$.24?Fet looks like it's about to make a big run. It's been in accumulation for 6 month and looks like it's about to break out. Once it can break the bottom resistance at $.09, I think there could be a quick move to $.13 and if that breaks, there's a lot of room for price to move upwards.
I ultimately think the move will take us somewhere to the $.22-.24 range before topping.
Let's see. Long from under $.09.

just entered a small position on fetfet has been very volatile. very low market cap. looking for a possible swing
