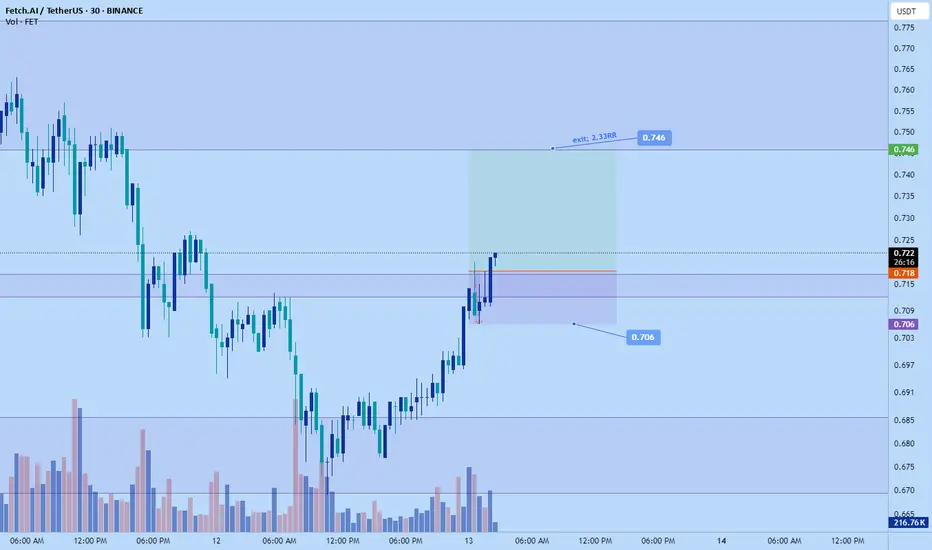
$FET Broke out from the bull flag!!🚨 NYSE:FET is broke out from a falling channel — and it’s about to go FULL SEND! ⚠️📈
It’s pressing above the breakout zone💣
Break above $0.72, and we’re ripping to $0.84 → $1.00 like it’s programmed. 🔥
🤖AI season heating up. Chart structure loaded.
💥The breakout candle has come. Be early — or

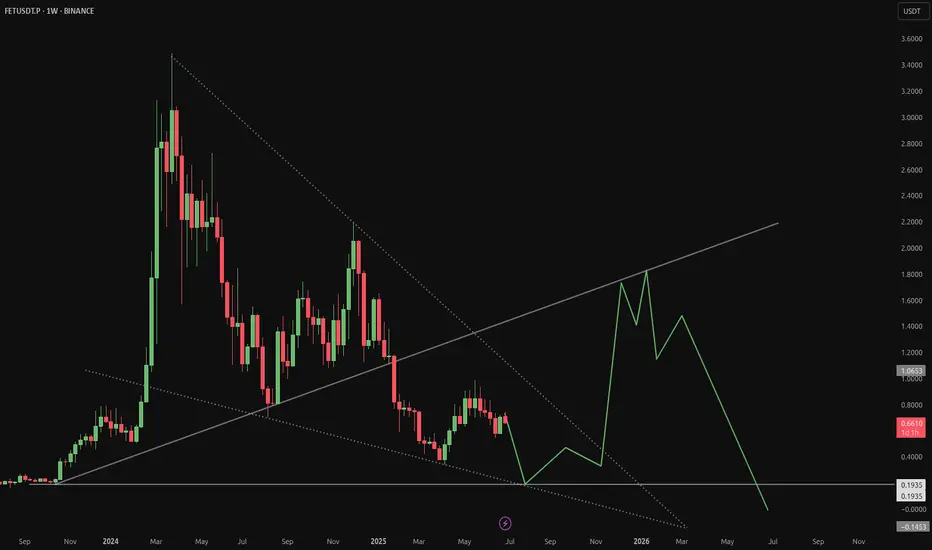
FET – HTF Setup Primed for ExpansionFET is looking strong here from a high time frame perspective — currently sitting around $0.739, well into the discount zone of the macro trend channel.
We’ve got:
✅ Price holding monthly demand
✅ A clear swing higher low forming on the weekly and 3W
✅ Already seen the first expansion leg out

Buy Trade Strategy for FET: Backing the Future of AI & BlockchaiDescription:
This trading idea highlights FET (Fetch.ai), a cryptocurrency powering a decentralized network that merges artificial intelligence and blockchain to create autonomous economic agents. These agents are designed to optimize services such as transportation, supply chain, and smart city in

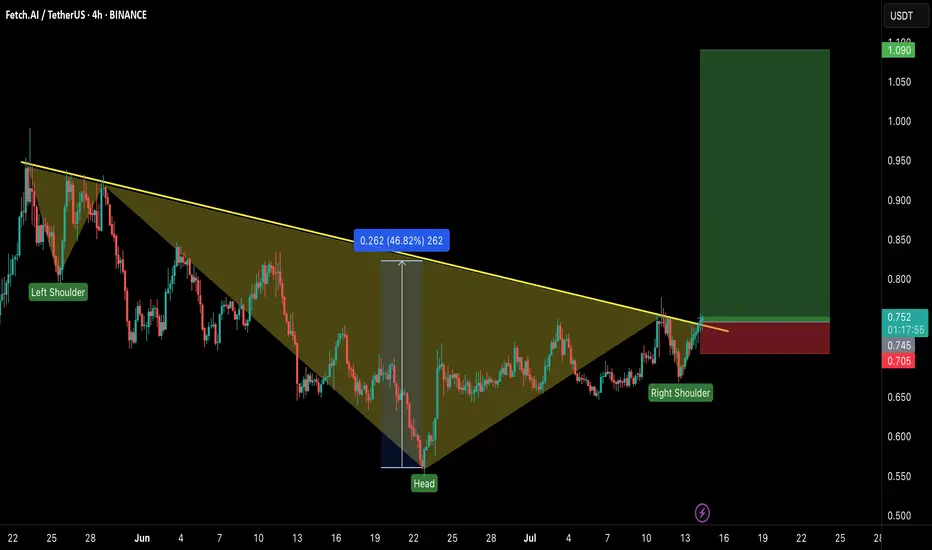
FET/USDT – Head & Shoulders Breakout!Hey Traders — if you're into high-conviction setups with real momentum, this one’s for you.
ONDO is trading inside a falling wedge on the daily chart — a classic bullish structure that often leads to explosive breakouts. 📈
FET just broke out of a classic inverse head & shoulders pattern — a strong
FET/USDT Breakout Imminent? Preparing for a Major Rally!
🧠 Key Pattern: Descending Trendline Breakout
On the daily chart (1D), FET/USDT (Fetch.AI) has been consolidating under a strong descending trendline since its late 2024 highs. Currently, price action is coiling tightly just below this resistance, signaling a potential explosive breakout.
The pric

#FET/USDT Preparing for a Major Rally ?#FET
The price is moving within a descending channel on the 1-hour frame and is expected to break and continue upward.
We have a trend to stabilize above the 100 moving average once again.
We have a downtrend on the RSI indicator that supports the upward break.
We have a support area at the lowe

$FETUSDT Support level. NYSE:FET just broke out of a falling wedge, which is a bullish sign.
It’s now holding above the 80-day EMA, a solid support level.
If this breakout holds, we could see a strong move toward $0.988, which is about a 43% increase from current levels.
Keep an eye on it.
DYRO, NFA

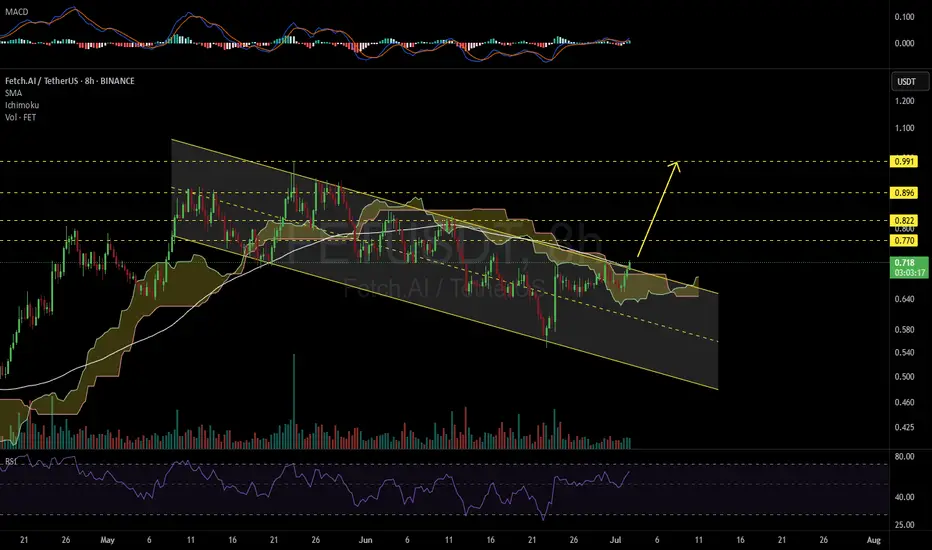
FETUSDT 8H#FET 8H chart is looking promising.
It has broken out of the Ichimoku cloud, and is currently trading above both the descending channel resistance and the SMA100.
If the current candle closes above the channel, we can expect the following targets:
🎯 $0.770
🎯 $0.822
🎯 $0.896
🎯 $0.991
⚠️ As always,
See all ideas
Summarizing what the indicators are suggesting.
Oscillators
Neutral
SellBuy
Strong sellStrong buy
Strong sellSellNeutralBuyStrong buy
Oscillators
Neutral
SellBuy
Strong sellStrong buy
Strong sellSellNeutralBuyStrong buy
Summary
Neutral
SellBuy
Strong sellStrong buy
Strong sellSellNeutralBuyStrong buy
Summary
Neutral
SellBuy
Strong sellStrong buy
Strong sellSellNeutralBuyStrong buy
Summary
Neutral
SellBuy
Strong sellStrong buy
Strong sellSellNeutralBuyStrong buy
Moving Averages
Neutral
SellBuy
Strong sellStrong buy
Strong sellSellNeutralBuyStrong buy
Moving Averages
Neutral
SellBuy
Strong sellStrong buy
Strong sellSellNeutralBuyStrong buy