FET — The AI narrative isn't over yetFET is still being held back by the 0.75–0.80 zone, but bulls are not giving up. On the daily timeframe, a trend reversal is emerging based on the moving averages. A breakout above resistance could send the price toward the $1 area — a potential 50–60% gain, which looks quite attractive for a spot l
Related pairs

Artificial Superintelligence (FET): Looking For Buy Entry 2We are shifting our focus currently to the 200EMA, where we are expecting the price to reach that area this week; after that, we will be looking for a proper breakout from that region.
In total we still got those 3 entry points we've been aiming for since last time so we wait patiently, not rushin

Artificial Superintelligence Alliance (FET) Enters Bullish PhaseThere is always really high volume on this chart. FETUSDT trading is very active and this is always a good signal regardless of the overall picture. It means there is interest in this trading pair. Some pairs you can see have absolutely no volume and you know only bots are trading it. When volume is

Realistic targets for fet Dear Traders,
Fet have a nice potential im also invested in , here the full targets and realistic ,
you can check my analysis on my profil and see how most of my analysis hit targets ,
fet may take time its too slow
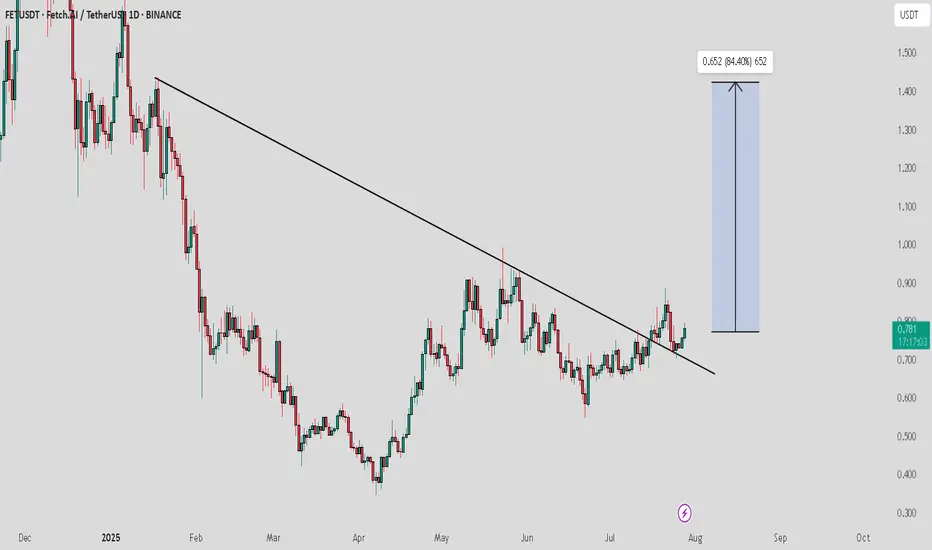
FET / USDT : Momentum building after successful retestFET/USDT has successfully broken out of the descending trendline resistance and is now holding strong after a successful retest. With momentum building, we are expecting a significant move towards the $1.5 level in the coming weeks.
Artificial Superintelligence (FET): Seeing Buying OpportunitySeeing a good opportunity for buying forming here, where we are seeing a proper overturn of trend happening.
We are not going to rush but wait for a proper break of structure to form, which would give us our last confirmation for upcoming bullish movement on FET so focus your attention on the buy

FET Setup: Reclaim, Retest, RallyScenario:
Price reclaimed the 1W order block (OB), confirming strong support in the $0.60–$0.70 area.
If price consolidates above this weekly OB, expect continuation toward the $0.96 equilibrium/resistance zone.
A pullback to retest the 1W OB as support (especially in August) is possible and w

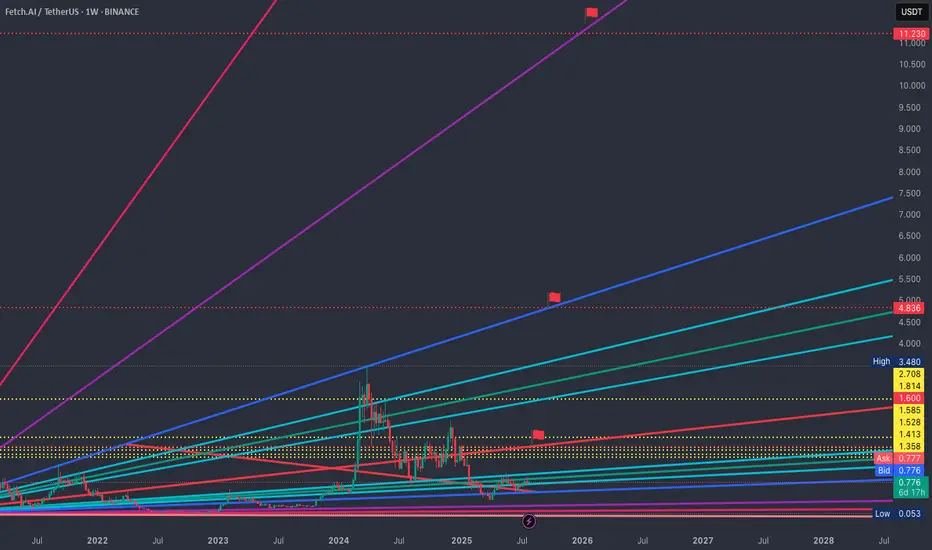
FET Secondary trend 19 07 2025Logarithm. Time frame 1 week for clarity.
Main trend is an ascending channel.
Secondary trend is a descending channel
Local trend is a Ross hook, at the median resistance. Reversal zone.
By the way, the trading idea from 2022 FET/BTC is still relevant. Pay attention to where the price is.
FET/BTC

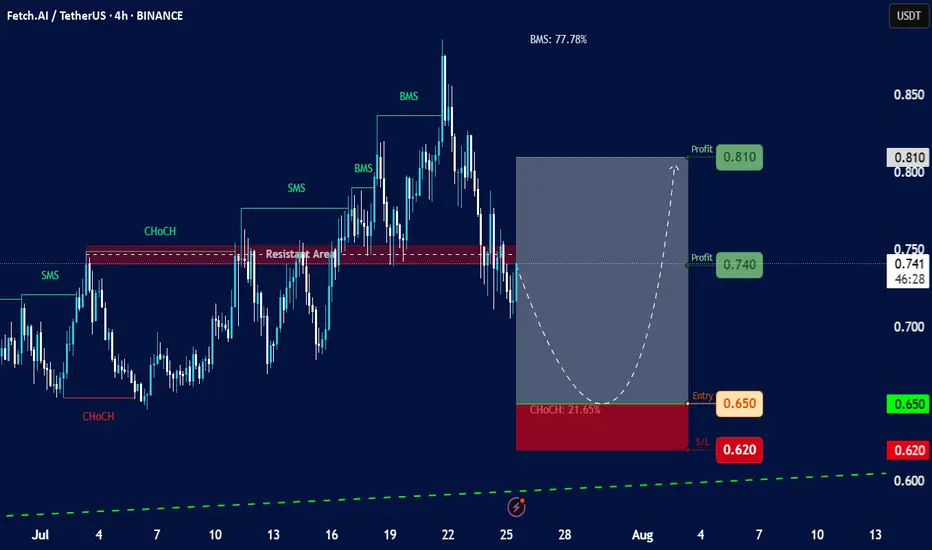
Fetch.AI (FET) against TetherUS (USDT)Chart Overview:
Asset: Fetch.AI (FET) against TetherUS (USDT).
Timeframe: 4-hour (4h) candles.
Current Price (approximate based on chart): Around 0.741 USDT.
Date and Time on Chart: July 25, 2025, 15:11 UTC+4 (This matches the current provided time context, so the chart is very recent).
Overall
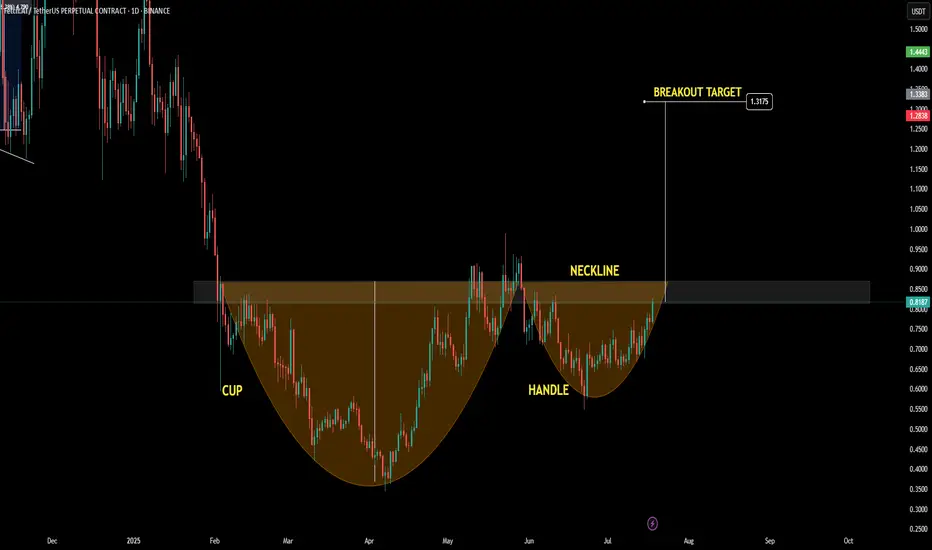
$FET possible Cup & Handle pattern forming!🚨 NYSE:FET possible Cup & Handle pattern forming!
Price is currently at resistance (neckline), a small correction could come before the breakout.
Let’s hope CRYPTOCAP:BTC continues to pump or at least move sideways for this to play out. If BTC dumps, most altcoins will follow.
See all ideas
Summarizing what the indicators are suggesting.
Oscillators
Neutral
SellBuy
Strong sellStrong buy
Strong sellSellNeutralBuyStrong buy
Oscillators
Neutral
SellBuy
Strong sellStrong buy
Strong sellSellNeutralBuyStrong buy
Summary
Neutral
SellBuy
Strong sellStrong buy
Strong sellSellNeutralBuyStrong buy
Summary
Neutral
SellBuy
Strong sellStrong buy
Strong sellSellNeutralBuyStrong buy
Summary
Neutral
SellBuy
Strong sellStrong buy
Strong sellSellNeutralBuyStrong buy
Moving Averages
Neutral
SellBuy
Strong sellStrong buy
Strong sellSellNeutralBuyStrong buy
Moving Averages
Neutral
SellBuy
Strong sellStrong buy
Strong sellSellNeutralBuyStrong buy
Displays a symbol's price movements over previous years to identify recurring trends.
Frequently Asked Questions
The current price of Fetch.ai/Tether USD (FET) is 0.638 USDT — it has fallen −1.79% in the past 24 hours. Try placing this info into the context by checking out what coins are also gaining and losing at the moment and seeing FET price chart.
Fetch.ai/Tether USD price has fallen by −8.99% over the last week, its month performance shows a −1.20% decrease, and as for the last year, Fetch.ai/Tether USD has decreased by −61.16%. See more dynamics on FET price chart.
Keep track of coins' changes with our Crypto Coins Heatmap.
Keep track of coins' changes with our Crypto Coins Heatmap.
Fetch.ai/Tether USD (FET) reached its highest price on Mar 28, 2024 — it amounted to 3.550 USDT. Find more insights on the FET price chart.
See the list of crypto gainers and choose what best fits your strategy.
See the list of crypto gainers and choose what best fits your strategy.
Fetch.ai/Tether USD (FET) reached the lowest price of 0.030 USDT on Jun 16, 2021. View more Fetch.ai/Tether USD dynamics on the price chart.
See the list of crypto losers to find unexpected opportunities.
See the list of crypto losers to find unexpected opportunities.
The safest choice when buying FET is to go to a well-known crypto exchange. Some of the popular names are Binance, Coinbase, Kraken. But you'll have to find a reliable broker and create an account first. You can trade FET right from TradingView charts — just choose a broker and connect to your account.
Crypto markets are famous for their volatility, so one should study all the available stats before adding crypto assets to their portfolio. Very often it's technical analysis that comes in handy. We prepared technical ratings for Fetch.ai/Tether USD (FET): today its technical analysis shows the sell signal, and according to the 1 week rating FET shows the strong sell signal. And you'd better dig deeper and study 1 month rating too — it's sell. Find inspiration in Fetch.ai/Tether USD trading ideas and keep track of what's moving crypto markets with our crypto news feed.
Fetch.ai/Tether USD (FET) is just as reliable as any other crypto asset — this corner of the world market is highly volatile. Today, for instance, Fetch.ai/Tether USD is estimated as 8.53% volatile. The only thing it means is that you must prepare and examine all available information before making a decision. And if you're not sure about Fetch.ai/Tether USD, you can find more inspiration in our curated watchlists.
You can discuss Fetch.ai/Tether USD (FET) with other users in our public chats, Minds or in the comments to Ideas.