FETUSDT trade ideas
$FET Broke out from the bull flag!!🚨 NYSE:FET is broke out from a falling channel — and it’s about to go FULL SEND! ⚠️📈
It’s pressing above the breakout zone💣
Break above $0.72, and we’re ripping to $0.84 → $1.00 like it’s programmed. 🔥
🤖AI season heating up. Chart structure loaded.
💥The breakout candle has come. Be early — or be exit liquidity.

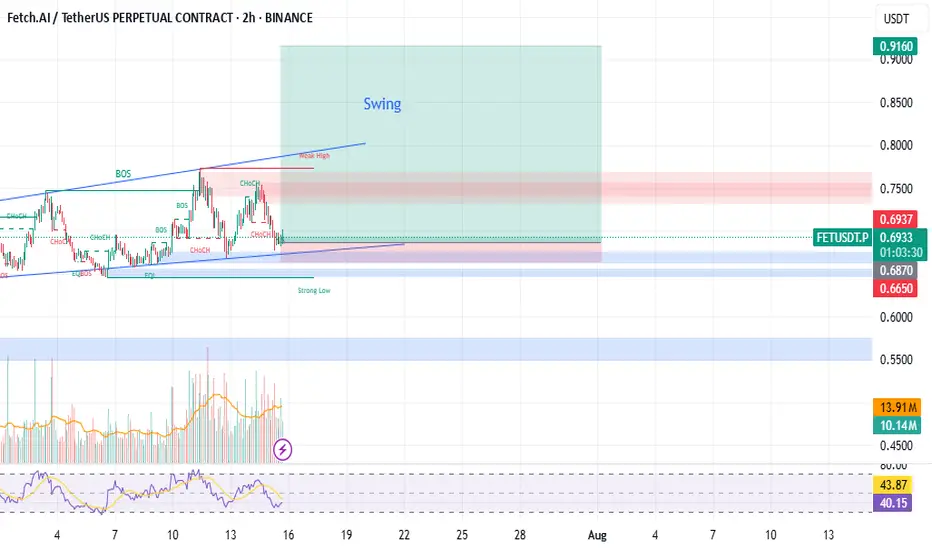
FET – HTF Setup Primed for ExpansionFET is looking strong here from a high time frame perspective — currently sitting around $0.739, well into the discount zone of the macro trend channel.
We’ve got:
✅ Price holding monthly demand
✅ A clear swing higher low forming on the weekly and 3W
✅ Already seen the first expansion leg out of demand
✅ Now potentially loading the next move higher
Zooming out, price is still trading below the midline of the long-term uptrend channel — and a move back to the upper boundary puts targets in the $6 region, aligned with a new higher high.
📈 HTF Structure
Midline rejection flipped support
Demand tested and respected
HL printed after clean retest
370% upside just to retest the prior HH at $3.50
HTF trend structure still fully intact
This setup is also supported by the broader HTF bullish bias across BTC, ETH, and majors, which adds confluence to a potential larger expansion phase for alts — especially strong narratives like AI.
🎯 Targets
🎯 $3.50 = prior high
🎯 $6.00+ = upper channel target / next HTF extension zone
From current levels, risk/reward looks very clean.
1W:
3W:
3M:

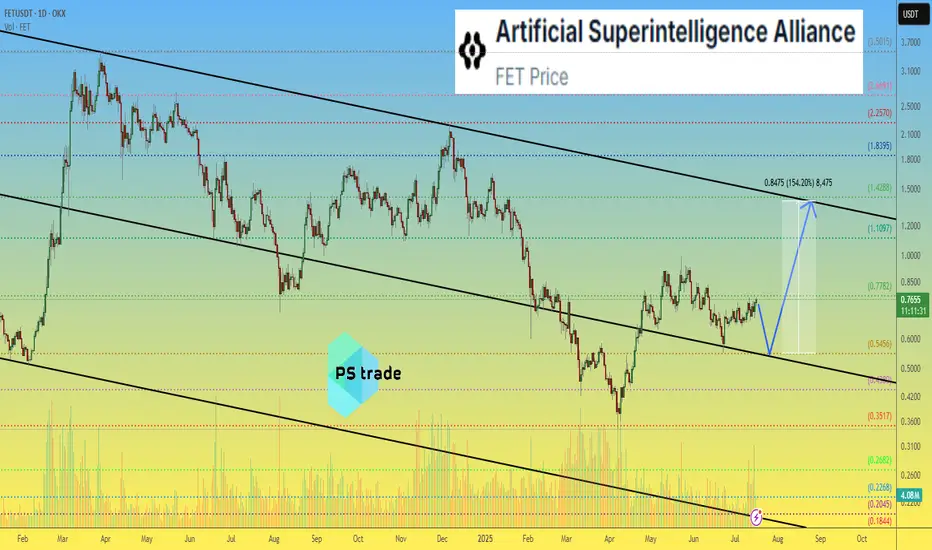
Artificial Superintelligence Alliance - FET price analysis📈 It looks like the price of the combined and updated #FET is trying to consolidate at the top of the channel.
All that remains is to wait for confirmation, i.e., for the OKX:FETUSDT price to stay above $0.55 in the coming days/weeks.
🤖 And then the #ArtificialSuperintelligenceAlliance token (the name is more complicated than the stop word from the movie “Eurotrip” — "hello olds" :) can be purchased for an investment portfolio with a growth potential of at least +150%.
_____________________
Did you like our analysis? Leave a comment, like, and follow to get more
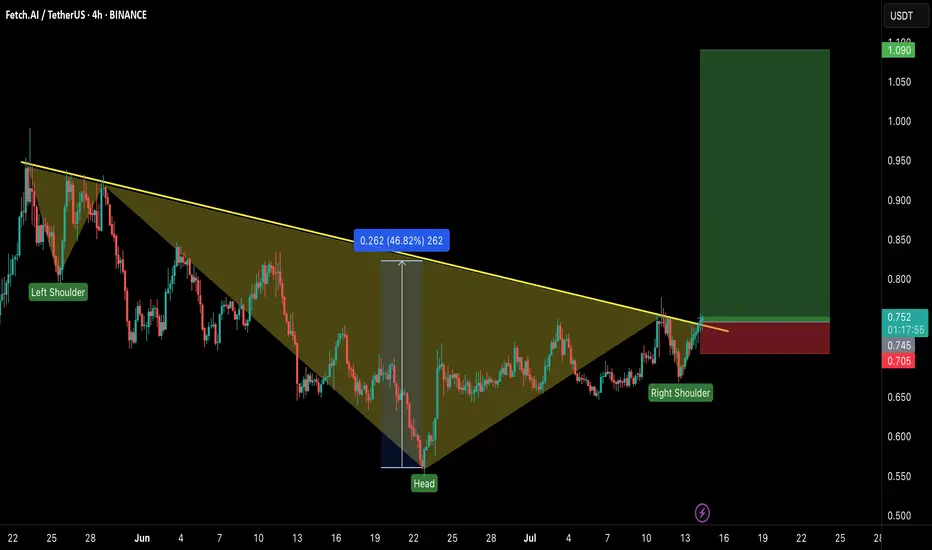
FET/USDT – Head & Shoulders Breakout!Hey Traders — if you're into high-conviction setups with real momentum, this one’s for you.
ONDO is trading inside a falling wedge on the daily chart — a classic bullish structure that often leads to explosive breakouts. 📈
FET just broke out of a classic inverse head & shoulders pattern — a strong bullish reversal structure! The breakout looks clean with a confirmed close above the neckline and volume starting to pick up.
💼 Entry: CMP ($0.75)
🎯 Targets: $0.85 / $0.95 / $1.09
🛑 Stop-loss: $0.705
📈 Risk-Reward: Favorable
🧠 Why it matters:
Clean breakout above resistance
Strong trend reversal structure
Potential for 40%+ move ahead.
💬 Are you in this breakout play or watching from the sidelines? Let’s talk below!
👉 Smash that LIKE and FOLLOW for more real-time setups!
Buy Trade Strategy for FET: Backing the Future of AI & BlockchaiDescription:
This trading idea highlights FET (Fetch.ai), a cryptocurrency powering a decentralized network that merges artificial intelligence and blockchain to create autonomous economic agents. These agents are designed to optimize services such as transportation, supply chain, and smart city infrastructure. FET is at the forefront of this innovative fusion, aiming to decentralize machine learning while reducing inefficiencies in data-driven industries. Backed by strong development momentum, strategic partnerships, and increasing relevance of AI technology, FET presents a compelling long-term use case in a rapidly evolving digital economy.
Still, it's important to understand that the crypto market remains highly volatile. News related to regulation, tech adoption, and market sentiment can rapidly shift valuations. Projects like FET, though fundamentally strong, are not immune to speculative pressure and risk.
Disclaimer:
This trading idea is for educational purposes only and should not be considered financial advice. Investing in cryptocurrencies like FET involves a high level of risk, including the potential for total capital loss. Always conduct your own due diligence, assess your financial condition, and consult a licensed financial advisor before making any investment decisions. Past performance is not indicative of future results.

FET - Perfect trade for beginner- FET is breaking out from the flag pattern and we have clear and confirmed breakout
- most of the like flag pattern breakout succeeds, this gives a high confidence trade
Entry Price: 0.775 (current price)
Stop Loss: 0.5307
TP1: 0.9072
TP2: 1.1495
TP3: 1.3791
TP4: 1.7927
TP5: 2.1468
Max Leverage 5x
Don't forget to keep stoploss
Cheers
GreenCrypto

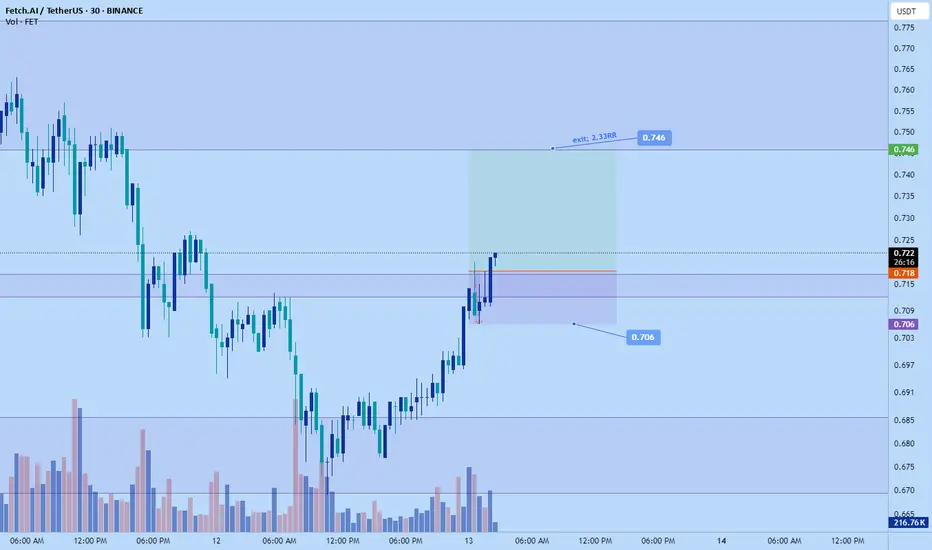
Fet long to $0.723Opened up a long on FET. Aiming for $0.723
2RR roughly
Stop: $0.689
DTT strategy applied

Fet to LongFet is trading in an ascending pattern. one can take a long entry. with stoploss closing below previous high.
Entry : 0.6870
Stop-Loss : 0.6650
Tp 1 : 0.7650
Tp 2 : 0.9160
Trade at your own risk
FET — AI Market Wake-Up Above $0.801. Watch for breakout & close above $0.80
2. Enter on confirmed weekly hold > $0.80
3. TP: $1.12–1.25 (major resistance)
4. Key support: $0.73–0.71 (must hold)
5. Stop: below $0.71

FET to 1$ this week?NYSE:FET Has broken out of the bull flag!✔️
This has so far come +40% and now looks certain to test the benchmark level next!
Potential Target should be 1$ atleast! This has a potential of going 50x from 1$ as well but we discuss that later when the time comes✍🏻

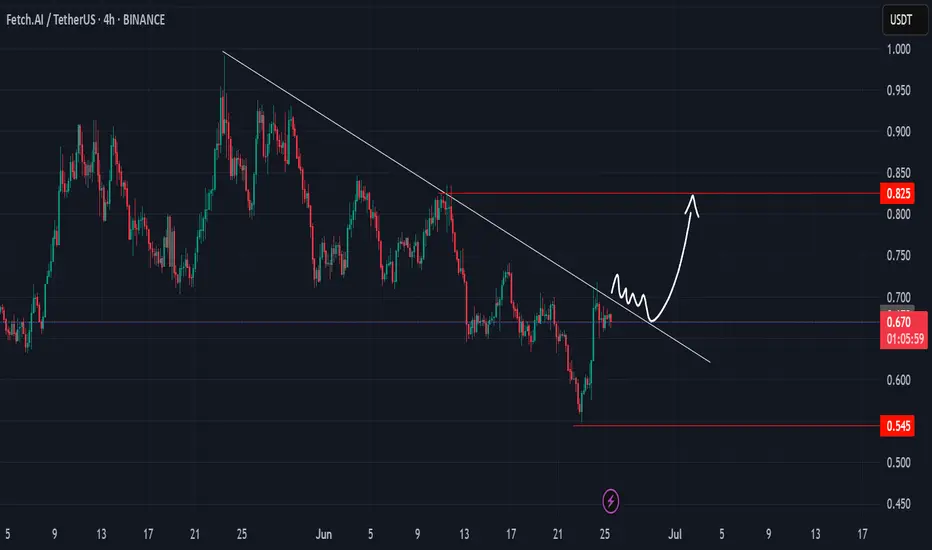
#FET/USDT Preparing for a Major Rally ?#FET
The price is moving within a descending channel on the 1-hour frame and is expected to break and continue upward.
We have a trend to stabilize above the 100 moving average once again.
We have a downtrend on the RSI indicator that supports the upward break.
We have a support area at the lower boundary of the channel at 0.655, acting as strong support from which the price can rebound.
We have a major support area in green that pushed the price upward at 0.650.
Entry price: 0.665
First target: 0.688
Second target: 0.716
Third target: 0.750
To manage risk, don't forget stop loss and capital management.
When you reach the first target, save some profits and then change the stop order to an entry order.
For inquiries, please comment.
Thank you.

FET/USDT Breakout Imminent? Preparing for a Major Rally!
🧠 Key Pattern: Descending Trendline Breakout
On the daily chart (1D), FET/USDT (Fetch.AI) has been consolidating under a strong descending trendline since its late 2024 highs. Currently, price action is coiling tightly just below this resistance, signaling a potential explosive breakout.
The price is trading near $0.72, right below the trendline — is this the calm before a major move?
🔍 Technical Analysis Overview
📉 Previous Downtrend Structure:
After peaking above $2, FET underwent a prolonged correction phase marked by lower highs and lower lows.
Sellers dominated for months, but the momentum is now shifting.
📈 Current Setup:
FET is forming a series of higher lows since March — an early sign of bullish reversal.
Volume is showing slight increases, which often precedes breakout attempts.
✅ Bullish Scenario (Breakout Rally)
If the price breaks and closes above the descending trendline (~$0.75–$0.78):
1. Initial Resistance: $0.818 → minor overhead supply zone.
2. Confirmation Level: $0.904 → breakout validation zone.
3. Major Upside Targets:
$1.225 → psychological resistance & previous consolidation level.
$1.599 & $1.809 → Fibonacci extension targets from prior impulse.
$2.147 – $2.195 → potential retest of the previous high.
📌 Upside Potential: Over +150%, if breakout is confirmed with strong volume and sustained momentum.
❌ Bearish Scenario (Rejection & Pullback)
If the price gets rejected from the trendline:
Possible pullback to $0.65, the recent higher low support.
Breakdown below this could extend the move toward $0.55 or even $0.47.
Major support: $0.345 → long-term demand zone.
📉 A failed breakout (fakeout) is possible if volume does not support the move.
📊 Trading Strategy Suggestions:
Breakout Entry: Above $0.78 with stop-loss below $0.70.
Retest Entry: Wait for a pullback to confirm support at the trendline after breakout.
Volume Confirmation is Critical — avoid chasing without strong bullish candles.
🧠 Narrative Bonus:
Fetch.AI remains one of the top AI-related projects in the crypto space. As the AI narrative resurfaces, a technical breakout could align with renewed fundamental attention — creating the perfect storm for a rally.
📌 Conclusion:
FET/USDT is positioned at a highly critical technical and psychological level. A confirmed breakout could initiate a large bullish wave, while rejection could drag the price lower. Manage your risk wisely and watch for volume cues.
#FETUSDT #FetchAI #BreakoutSetup #CryptoTrading #AltcoinRally #TechnicalAnalysis #DescendingTrendline #CryptoSignals #AIcoins

$FETUSDT Support level. NYSE:FET just broke out of a falling wedge, which is a bullish sign.
It’s now holding above the 80-day EMA, a solid support level.
If this breakout holds, we could see a strong move toward $0.988, which is about a 43% increase from current levels.
Keep an eye on it.
DYRO, NFA

$FET Breakout Targeting 41% GainNYSE:FET has broken out of its descending channel on the 8H chart with strong momentum.
If it holds above the breakout zone $0.66–$0.68, we could see a move toward $0.92, a potential 41% upside.
Watch for a successful retest to confirm the breakout.
DYRO, NFA

#FET/USDT#FET
The price is moving within a descending channel on the 1-hour frame, adhering well to it, and is heading towards a strong breakout and retest.
We are seeing a rebound from the lower boundary of the descending channel. This support is at 0.634.
We have a downtrend on the RSI indicator that is about to be broken and retested, which supports the upward trend.
We are looking for stability above the 100 moving average.
Entry price: 0.661
First target: 0.684
Second target: 0.720
Third target: 0.754

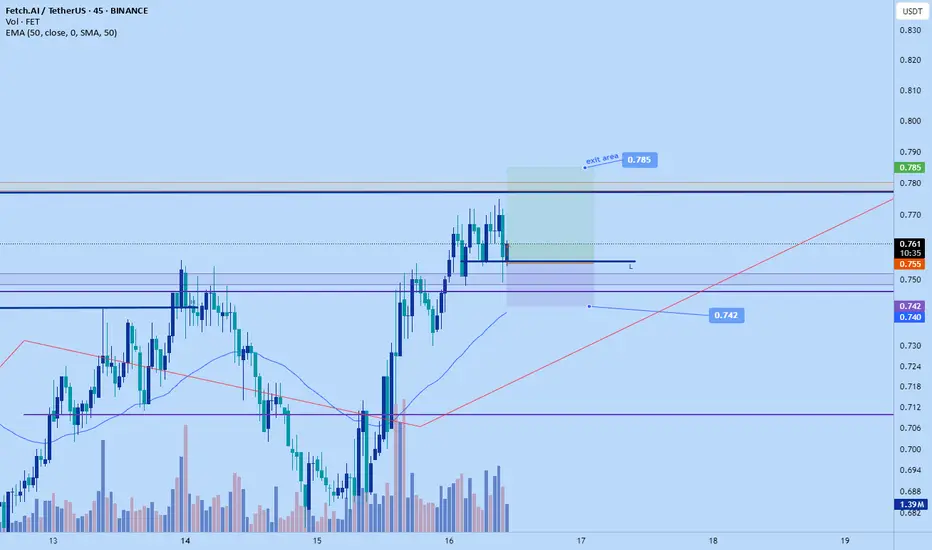
Fet pump to $0.785 todayWent long on FeT
Target area: $0.785
Stop: $0.742
Roughly 2 RR
If pull back to entry it be good to enter as if you just seeing will probable only able to get 1 RR
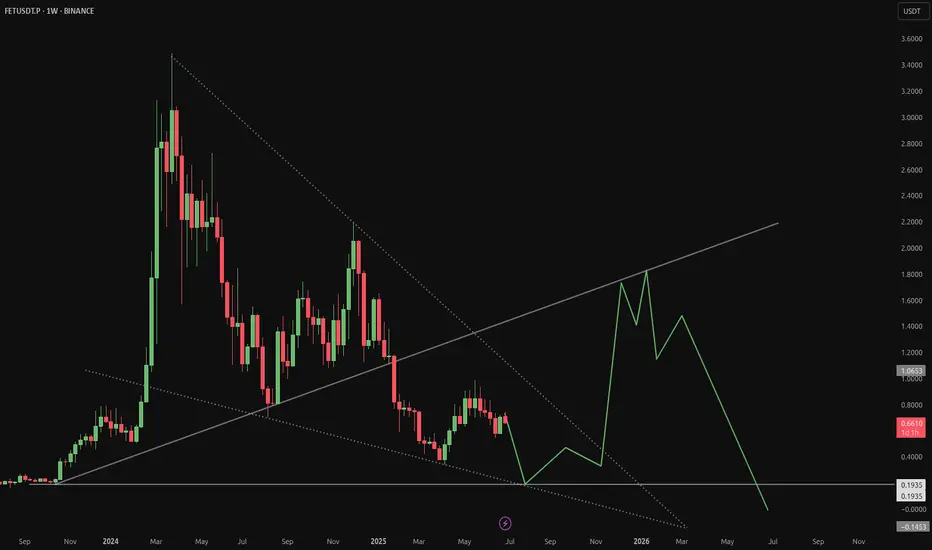
FET weekly view and lookout FET doesn't give much weekly indicators but there can be a channel assumed in which the upper end (channel top) is a current resistance indication of parabolic rises in the future and the lower end (channel bottom) a support indication.
if we follow the channel top towards end of 2025, a price of roughtly $5 can be assumed. of course trajectory and upside are volatile and with major news the channel top might be even breached. since BINANCE:FETUSDT already has a more than doubling of it's price top compared to 2022, it's hard to guess where we go from here.
I'd assume it'll respect the bottom trendline a few times before making its next big move up. Especially since it's recent partnership with agix and ocean protocol and the still not really happened AI craze of the AI sector in crypto (comparatively speaking).
maybe the 4h gives more indications in my next post.

FETArtificial Superintelligence Alliance
Fetch.AI is a decentralised digital world in which useful economic activity takes place. This activity is performed by Autonomous Agents.
Everything is clear on the chart.
I wish everyone abundant profits.
Like and follow
for more.

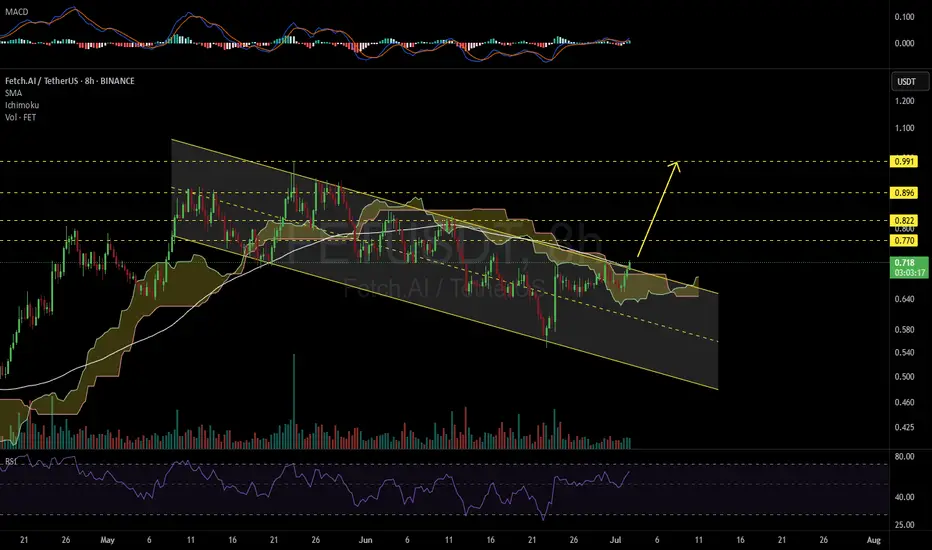
FETUSDT 8H#FET 8H chart is looking promising.
It has broken out of the Ichimoku cloud, and is currently trading above both the descending channel resistance and the SMA100.
If the current candle closes above the channel, we can expect the following targets:
🎯 $0.770
🎯 $0.822
🎯 $0.896
🎯 $0.991
⚠️ As always, use a tight stop-loss and apply proper risk management.
$FET BULLISH TO $6+ MAY HAVE STARTEDNYSE:FET BULLISH TO $6+ MAY HAVE STARTED:I am looking for a candle shift above the blue line to confirm this uptrend.
Take profit once price is above the inducement level and wait for reversal down to our SECOND BUY RANG. This might take FET up $6 and above.
GOODLUCK #FET