FET god candle soon?!FET looks like it's deep in a complex correction, with Wave C now in play. The potential pullback zones could hit 0.382 , 0.5 , or 0.618 , depending on your risk tolerance. Once this retracement completes, brace yourself for a monster move—Wave 3 alone could unleash a god-tier candle, ripping through $1,000+ with serious force!
FETUSDT trade ideas

Fetch AI AnalysisFetch AI is doing a pretty good inverted head and shoulders pattern. As a big investor of FET I feel like we're going to hit $1.53 as long as we're not below $1.37.

FETUSDTFETUSDT is in strong bullish trend.
As the market is consistently printing new LHs and LLs.
currently the market is retracing a bit after last LL, which is also the 50% Fib retracement level and local support as well. if the market successfully sustain this buying confluence the next leg down could go for new LL.
What you guys think of this idea?

FET Power Play: Riding the #AI Surge!I'm taking this bet here. It seems reasonable after the NFP data and unemployment rate.
I expect it to continue trending, and I'll use this along with GETTEX:TAO to gauge #AI strength. Let’s see how it plays out!
It has a clear invalidation point. I should have entered a bit lower at the trending MA, but it is what it is. The data is in our favor, and the conditions still look good for the #AI sector. Let’s see how this unfolds!

FETUSDTFETUSDT is trading in strong bearish trend and consistently printing LL LHs. and is about complete ABCD pattern at strong daily resistance level. Recently the price is broken the important support zone and now retesting the broken level, which is also the 50% Fib retracement level.
If the buy momentum continues the next target could be 1.2500
What you guys think of this idea?


FETUSDT-LONG IDEAFETUSDT is broken the trendline on daily time frame now its showing a good potential movement toward upside as there is a buyside liquidity above the targeted high could be good setup

FET COIN SWING LONG OPPORTUNITY - AI CRYPTO MARKETAI technology is booming alongside the semiconductor industry, as we saw with massive new all-time highs yesterday (17/10/24). I believe the AI sector within the crypto market will quickly benefit from this trend.
FET recently broke its diagonal structure and is currently sitting within the weekly demand zone.
I believe we are ready for a takeoff, aiming for a swing trade that could bring us to new all-time highs.
Both the daily and weekly demand zones are currently supporting the price. I received LTF (lower time frame) confirmations and have bought a spot position as well as opened a swing long position.


Fet Rsi DivergenceA bullish signal on the RSI indicator signals that the price did not move in sync with the RSI; the price moved low, but the RSI moved less. This bullish divergence is an indication of strengthening momentum as show in the Fet chart. A bearish signal on the RSI indicator signals that the price and RSI are not in sync.
The price formed a higher move than the RSI. This bearish divergence is an indication of weak momentum.

Price action on #FETCH.AI#FETCH.AI has been trading within an 8 weeks channel up and rebounded it's price on the 1D MA50. Moreover we can also notice that the orderblock acted also as a support and helped the price climb higher. Now we are targeting a higher high in the coming days as a confirmation to our uptrend. Extra information gives us the RSI which indicates a good buy opportunity in the (sales) zone. Our target is 2.524$ level 0 of the fib retracement.

FET Update - 15.10.2024 / Long Idea 1d: moving on the upside off, there is a liquidity target behind the key high.
4h: upward order flow here as well, went into buyer imbalance.
Observe risk management !

FET usdtFET HEAD AND SHOULDER BUlish 14% to 1.7
Note: All currencies will break the resistance after Bitcoin breaches $66,000

FETUSDTHead and shoulders return pattern occurs and retest.At the same time btc pair has po3 deviation lvl.There is war escalation in middle east so be careful.

FETUSDT-LONG IDEA FETUSDT recently broke its trend line making consecutive higher highs and higher lows and also the retracted back to 0.5 fib level potential upside move can be expected. do your own analysis before taking the trade.

Expect to climb if it cracksBINANCE:FETUSDT
The correction can continue up to the price of 1.1 and then start to rise from here or break the trend line and climb up to the price of 2.2-2.5.

FETUSDT: Ready to Smash Resistance! FETUSDT: A Second Chance at Breaking Resistance!
FETUSDT has recently faced challenges with an unsuccessful breakout from a head and shoulders pattern, but it's now making another attempt to break through major resistance. This presents a compelling opportunity for traders looking to enter the market. As FETUSDT approaches this critical resistance level, a successful breakout could signal the start of a bullish rally.
For those looking to capitalize on this potential move, consider entering the trade once the resistance is confirmed as broken. Remember to implement a stop loss to manage risk effectively, ensuring you protect your capital.
FETUSDT Currently trading at $1.44
Buy level: Above $1.488
Stop loss: Below $1.22
TP1: $1.77
TP2: $2
TP3: $2.6
TP4: $3.5
Max Leverage 3x
Follow Our Tradingview Account for More Technical Analysis Updates, | Like, Share and Comment Your thoughts

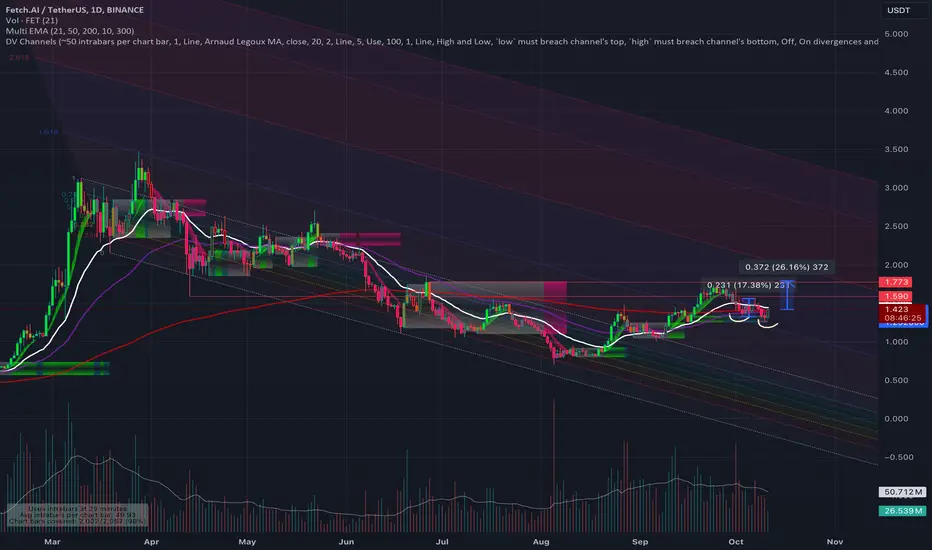
FETUSDT - Something is cooking upFET has just made a double bottom finding support on falling fibonacci channel 1.618 trend-line. Expecting somewhere around 25% rally to 1.77 levels.
FET looking for breakout, but BTC looks pessmisticFET clean chart. Broke out of long term trendline, re-tested horizontal level twice and looking for a break out of the trend line re-test slope.
However, BTC looking suss so it remains to be seen whether we respect this bounce from 1.266 horizontal level. Otherwise we're looking at break down past 1.266, and test the diagonal trendline around at 90c. We just need BTC to behave a bit better but because of all this talks of Uptober, it's likely to stay crabbing in a sideways market for a bit longer IMHO. 9.9 times out of 10, when we expect something big to happen in the market, it doesn't. There's just too many narratives around BTC halving and pattern repeats itself for the 4th time yadi yada, the market won't just let the retail have it that easy.
Note to self: I should counter-trade these big events and will have more luck. Food for thought

FETUSDT TRADE IDEA- FETUSDT bullish trend.
- Bullish BOS.
- Formed Sell side liquidity right above FVG.
- Entry modules OB+FVG+SSL.
- Check the chart.

Long Fetch AI/UsdtReasoning:
-Datadash brought to my attention, it was featured in the last dash report closer to the lows,
-Broken free of two diagonal resistances
-retesting the resistance of a reverse head and shoulder as support
-Above 21, 50, 100, 200 day moving average
-above bull market support band.
-Many of these potential support levels are converging on the same price range from $1.5-1.35
-BTC has broken above BMSB and may have just created a MSB that could lead it to new highs.
-An immediate indicator of momentum would be the 21day moving average, nick from data dash frequently references this one for swing trades in the time frame i am familiar with.
- the support zone from 0.7 to 1.0 is a long term resistance turned support, and Fetch has bounced strongly from there.
-Showing many similarities and a possible repeat of the move it had from March 2021 to sept/Oct 2021 with a double peak wherein the second is slightly higher to retest the upper bound of its long term channel.
-I plan on being very aggressive with entry and allowing a large loss percentage wise in my trading account if i am wrong because of the confluence of so many factors listed above. I'm also young and my account value is not particularly large relative to a professional trader. I can make the money back in a short period of time with my day job.
MACRO
-SPY at ATH and generally markets run up into elections, before experiencing their correction
-The bear case is that
BTC is not able to maintain MSB or above BMSB
Fetch breaks below relevant MAs and the support region it SHOULD have created by breaking above its reverse H&S pattern
I will attempt to conjure up a Trailing stop loss based on momentum indicators like the 21DMA or even longer frame ones depending on my risk/pain tolerance.
My entry and exit strategy really needs work but i will attempt to remove emotion from the exit portion of this trade. Entries still unkown ATP.
HARDSTOP at 1.335 under all MAs
I would have included More TImeframe views as well as the btc chart but i dont have a premium plan yet

FET Long Position (Bull Market Anticipation)Market Context: FET is demonstrating a shift in market structure, indicating the potential for an upward trend. As a strong AI-related asset, it is poised for the next leg up in the current bull market. We expect one final shakeout below the previous fake low, providing an optimal entry point for a long-term position.
Trade Setup:
Entry: Around $1.15.
Take Profit:
First target: $1.70
Second target: $2.00
Third target: $3.20
Stop Loss: Daily close below $0.95.
This setup allows us to capitalize on potential upward momentum while maintaining a manageable risk. #FET #Crypto #AI
