FET/USDT Breakout Imminent? Preparing for a Major Rally!
🧠 Key Pattern: Descending Trendline Breakout
On the daily chart (1D), FET/USDT (Fetch.AI) has been consolidating under a strong descending trendline since its late 2024 highs. Currently, price action is coiling tightly just below this resistance, signaling a potential explosive breakout.
The price is trading near $0.72, right below the trendline — is this the calm before a major move?
🔍 Technical Analysis Overview
📉 Previous Downtrend Structure:
After peaking above $2, FET underwent a prolonged correction phase marked by lower highs and lower lows.
Sellers dominated for months, but the momentum is now shifting.
📈 Current Setup:
FET is forming a series of higher lows since March — an early sign of bullish reversal.
Volume is showing slight increases, which often precedes breakout attempts.
✅ Bullish Scenario (Breakout Rally)
If the price breaks and closes above the descending trendline (~$0.75–$0.78):
1. Initial Resistance: $0.818 → minor overhead supply zone.
2. Confirmation Level: $0.904 → breakout validation zone.
3. Major Upside Targets:
$1.225 → psychological resistance & previous consolidation level.
$1.599 & $1.809 → Fibonacci extension targets from prior impulse.
$2.147 – $2.195 → potential retest of the previous high.
📌 Upside Potential: Over +150%, if breakout is confirmed with strong volume and sustained momentum.
❌ Bearish Scenario (Rejection & Pullback)
If the price gets rejected from the trendline:
Possible pullback to $0.65, the recent higher low support.
Breakdown below this could extend the move toward $0.55 or even $0.47.
Major support: $0.345 → long-term demand zone.
📉 A failed breakout (fakeout) is possible if volume does not support the move.
📊 Trading Strategy Suggestions:
Breakout Entry: Above $0.78 with stop-loss below $0.70.
Retest Entry: Wait for a pullback to confirm support at the trendline after breakout.
Volume Confirmation is Critical — avoid chasing without strong bullish candles.
🧠 Narrative Bonus:
Fetch.AI remains one of the top AI-related projects in the crypto space. As the AI narrative resurfaces, a technical breakout could align with renewed fundamental attention — creating the perfect storm for a rally.
📌 Conclusion:
FET/USDT is positioned at a highly critical technical and psychological level. A confirmed breakout could initiate a large bullish wave, while rejection could drag the price lower. Manage your risk wisely and watch for volume cues.
#FETUSDT #FetchAI #BreakoutSetup #CryptoTrading #AltcoinRally #TechnicalAnalysis #DescendingTrendline #CryptoSignals #AIcoins
FETUSDT trade ideas

$FET Breakout Targeting 41% GainNYSE:FET has broken out of its descending channel on the 8H chart with strong momentum.
If it holds above the breakout zone $0.66–$0.68, we could see a move toward $0.92, a potential 41% upside.
Watch for a successful retest to confirm the breakout.
DYRO, NFA

#FET/USDT#FET
The price is moving within a descending channel on the 1-hour frame, adhering well to it, and is heading towards a strong breakout and retest.
We are seeing a rebound from the lower boundary of the descending channel. This support is at 0.634.
We have a downtrend on the RSI indicator that is about to be broken and retested, which supports the upward trend.
We are looking for stability above the 100 moving average.
Entry price: 0.661
First target: 0.684
Second target: 0.720
Third target: 0.754

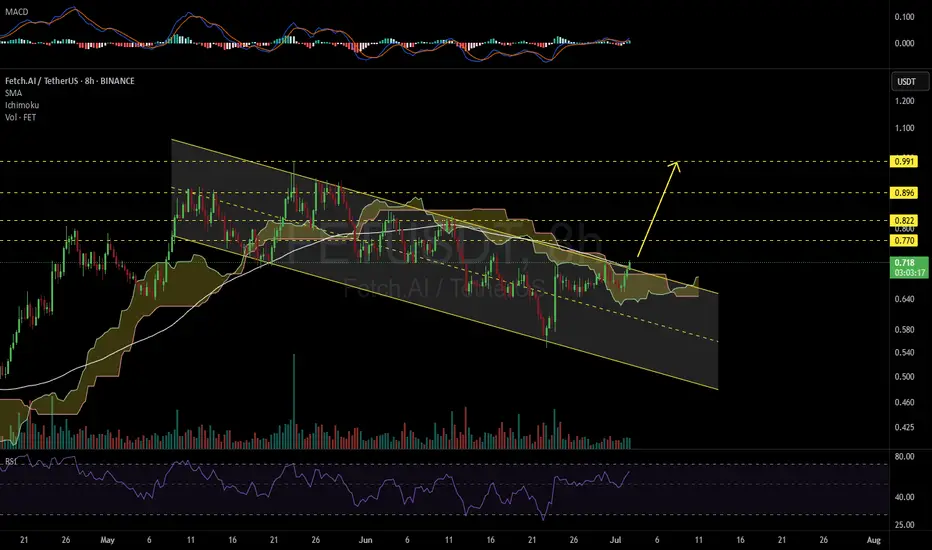
FETUSDT 8H#FET 8H chart is looking promising.
It has broken out of the Ichimoku cloud, and is currently trading above both the descending channel resistance and the SMA100.
If the current candle closes above the channel, we can expect the following targets:
🎯 $0.770
🎯 $0.822
🎯 $0.896
🎯 $0.991
⚠️ As always, use a tight stop-loss and apply proper risk management.
$FET BULLISH TO $6+ MAY HAVE STARTEDNYSE:FET BULLISH TO $6+ MAY HAVE STARTED:I am looking for a candle shift above the blue line to confirm this uptrend.
Take profit once price is above the inducement level and wait for reversal down to our SECOND BUY RANG. This might take FET up $6 and above.
GOODLUCK #FET

FET: Spot Long 24/06/25Trade Direction:
FET: Spot Long
Position Strategy:
-Risk approx 1% spot
- Layered bids down to 0.636 with first filled here at market 0.692
- Avg entry if all are filled will be 0.668
Reason for Entry:
- Strong multi-timeframe support confluence:
- 3D breaker block
- 3D fair value gap
- Weekly fair value gap
- OTE retracement
- 3D candle close is extremely bullish at support
Trade Notes:
- This is a swing spot play
- Will reassess if full fills hit and structure changes

FET BINANCE:FETUSDT.P
A comprehensive update for FET$ (Artificial Superintelligence Alliance) until June 2025:
Recent developments and funding:
$55M Funding: TRNR (parent company of Fetch.ai (Fetch.ai) ) closed a funding round with participation from institutions such as ATW Partners and DWF Labs, with shareholder protection features:
Financing is built at a price 20% higher than the current market price. 😜
- Protection against NYSE:FET price drop: An escrow mechanism that covers up to a 50% drop in the coin price while shareholders retain unlimited upside gains.🥰
- Plans to increase funding to $500 million in the future.😎
Current market performance:
- Current price: ~$0.6886 (as of June 20, 2025).
- Market value: ~$1.9 billion.
Recent Volatility: 56% down from previous high ($3.47), with a 4% gain over the past week.
Technical developments and alliances:
- New Alliance (ASI Alliance): Fetch.ai (Fetch.ai) has merged with SingularityNET and Ocean Protocol to form an alliance focused on decentralized AI, strengthening the technical architecture and expanding use cases.
- New products: Launch of ASI-1 Mini (Intelligent Language Model) to support independent tasks.
- Partnerships: Collaborate with C4E to integrate AI agents into smart energy solutions.
Short-term technical analysis:
Resistance at $0.835, support at $0.61.
RSI at 43.29 (neutral) with temporary sell dominance.
Positively influencing factors:
- Growing demand for AI tokens: especially with the development of technologies such as autonomous economic agents.
Treasury Growth: TRNR plans to hold a large reserve of NYSE:FET , which could boost its value as the price rises.
Upcoming events: Environment 2025 conference in October 2025, which may announce new partnerships.
Risks and challenges:
High volatility: Depends on cryptocurrency market fluctuations and AI trends.
Potential dilution: Issuing new shares to finance operations may affect the price if the market does not rise.
Regulations: Waiting for SEC approval to register shares.
Investment recommendations:
- Short term: Profit from volatility through the dollar cost averaging (DCA) technique.
- Long term: Invest based on the alliance’s technical capabilities and breadth of use cases.
Areas such as smart energy and smart cities.
Risk: Never invest more than you can afford to lose, especially with long-term expectations (such as $100) that are still uncertain.
💎💎 Conclusion:
Demonstrates strong and powerful potential supported by strategic FET alliances and institutional funding.
Although it is still exposed to market fluctuations, the medium-term boom portends a much greater long-term boom in the artificial intelligence sector.
Please focus on long-term technical aspects, especially energy and smart cities.

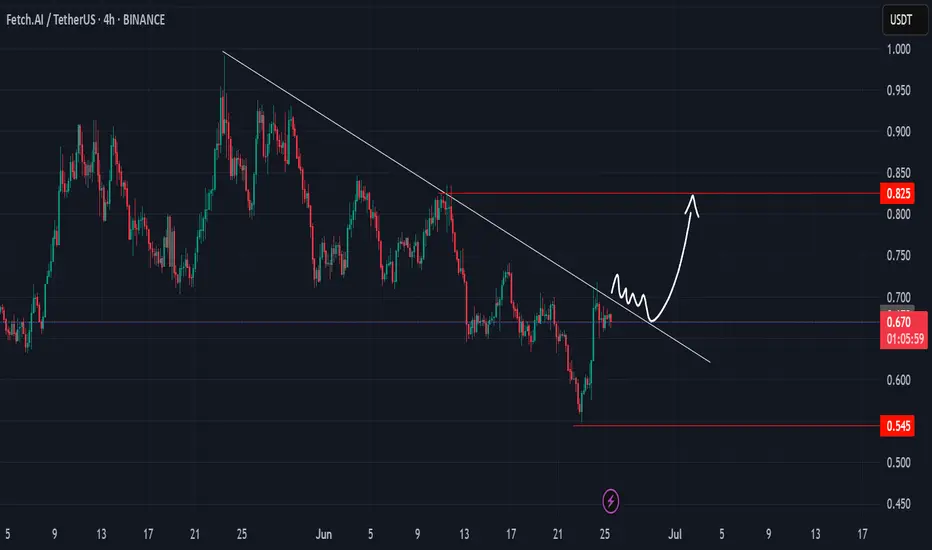
$FET 4Hr Time frame DUMP before PUMP? $1 Recovery!FET/USDT – 4H Time Frame Analysis
Pattern Formation: A rounding top is clearly visible, suggesting weakening bullish momentum and potential trend reversal.
Trend Structure: Price is forming lower highs and lower lows, confirming a bearish trend.
Key Zones:
Supply Zone: $0.85 – $0.975
Demand Zone: $0.35 – $0.45
Neckline Support: Price is approaching a critical neckline level. A break below this could trigger strong downside movement.
Weekly FVG & Fib Confluence:
Below the neckline lies a weekly Fair Value Gap (FVG).
The 0.618 Fibonacci retracement aligns with this zone, forming a golden pocket — a key support area.
Scenario 1 – Bullish Reversal:
If price holds above the golden pocket, a bounce could push it back toward psychological levels (e.g., $0.70 and $0.80)
Scenario 2 – Bearish Continuation:
If price fails to hold the FVG/GP zone, this invalidates bullish setups.
Expect a breakdown targeting the $0.35–$0.45 demand zone.

FET: Long 18/06/25Trade Direction:
FET Long
Risk Management:
- 0.5% risk
Reason for Entry:
- Total Market Cap holding key H4 support
- Oversold on multiple time frames
- Recent bullish news of potential ceasefire talks (Iran/Israel)
- HTF Double Bottom
- Daily Orderblock
Additional Notes:
- Will look to hedge short if market gives me a reason to do so ~106k
- Practically this long is mostly built around total bouncing on support. Its a critical level to hold and it makes the most sense for a bounce, targeting at least 0.5 mid range on total. Were cooked imo if it loses this level and fails to reclaim.
- High risk, said that alot these past few days but trading this is high risk.
- IMO kind of last area to bounce before we full on nuke.

Artificial Superintelligence (FET): Looking For Buy Entry 2We are shifting our focus currently to the 200EMA, where we are expecting the price to reach that area this week; after that, we will be looking for a proper breakout from that region.
In total we still got those 3 entry points we've been aiming for since last time so we wait patiently, not rushing.
It does not matter which entry will be triggered; once we see that, we will be opening a decent R:R position (more info once we reach certain zones).
Swallow Academy

FetchAI New All-Time High —656% Profits Potential MappedSupport here is well defined, it is a long-term situation. Resistance in late 2023 and early 2024; resistance in late April 2025; support in early May and mid-June. This is the red line on the chart.
In early 2024 there was a small rounded bottom pattern below this long-term support line. After resistance was conquered a major bullish wave appeared, more than 400%.
In early to mid-2025 a big rounded bottom pattern appeared below this long-term support line. Below support it is resistance; it has been conquered as resistance and now FETUSDT trades above. This opens the doors for massive growth, really massive.
This chart setup is calling for a new all-time high. You can find several targets mapped on the chart.
» 221% is an easy target, easy profits; high certainty-high probability. This is around $2.30.
» $3.77 is a shy new all-time but I believe this is also high probability. This target gives 426% profits potential.
» The standard 2025 all-time high projection sits around $5.42. From current price, this gives a total of 656%. If we take the same target and use the April bottom as the startup point, we get 1,471%. This would be the total growth of a bullish wave that peaks at $5.42 in late 2025, but there can be more.
Prepare for the best, hope for the best.
The best is yet to come.
Namaste.

FET – Channels Aligning for Potential MovesNYSE:FET is navigating a broadening channel on the daily timeframe 📈, while the 4-hour view reveals an emerging ascending channel.
Both structures are hinting at growing momentum and potential volatility ahead.
Eyes on these levels — the next chapter for NYSE:FET could be written here! 🌟

FET LONG (ANALYST TOKEN BREAKER)FET Long
📦 Entry Zone: $0.789
🎯 TP1: $0.837
🎯 TP2: $0.891
🎯 TP3: $0.942
🎯 TP4: $0.992
❌ SL: $0.740
🧠 Strategy:
✅ Use low leverage (10x suggested for this challenge)
✅ Risk only 2–5% per trade
⚠️ Stick to the plan — no chasing trades.
Discipline = Consistency 💹

HOW TO:Major Update Weis Wave with Speed Index Signals and TypesThis is an information video about the 6 new features of Weis Wave with Speed Index - Signal v6.0 and Weis Wave - Wave Types v3.0.
These versions will release at end of this week or next week.
Available to answer any of questions that you might have!!!
Enjoy!

FET Correction Bottom Confirmed —Buy OpportunityThe next All-Time High for FETUSDT in late 2025 or early 2026 can reach between $5.42 or $8.56, giving us more than 1,600% profits potential from the current price. This is taking $8.56 as the next All-Time High. Let's get that part out of the way because I want to show you the end of the current correction. I am using the linear scale so it won't let me show you higher targets on the chart.
There was a resistance level in April 2022 as the bear market developed. This resistance was confirmed again in February 2023. It took 270 days, or 9 months, before this resistance level was conquered (broken). As soon as it broke, it was tested as support (Feb. 2024) and then a major rise. This major rise completed a long-term bullish cycle and after a bullish cycle a correction always develops.
How far down can the correction reach?
How low can prices go?
The correction started in March 2024 and is active until this present day. Obviously, the strongest resistance price range in the history of FETUSDT will need to be tested again but as support.
Now, FETUSDT bottomed last week and this bottom happened at the same level where the April 2022 and February 2023 resistance was found. As the action approached this level, volume started to go up. The next week, this week, we have a bullish candle and this is very likely the end of the correction; the bottom is in.
I just wanted to let you know that this level will hold because it was a strong resistance in the past. A resistance level once conquered turns into support.
As prices are now, it is the best possible time to enter; buy, go LONG.
This is a friendly reminder. I am wishing you tons of success and huge profits in this bull market that is just about to develop. It will be a bull market that will change the world. The world is already changing, but this bull market will close the deal. By the time it is over, Cryptocurrency will have taken over the world.
New money. The rich nouveau.
Namaste.

$FET Ascending Triangle Incoming PUMP? 1 Hour Time FraNYSE:FET 1Hr Time Frame
📝 Technical Analysis:
FET is currently forming an ascending triangle pattern, a typically bullish continuation structure. This pattern is developing after a clear retest of the demand zone between $0.7038 and $0.7390, which previously acted as a strong support area.
✅ Key confirmations:
- Two clear rejections from the lower boundary of the ascending triangle, suggesting strong buying interest.
-A break of the previous bearish trendline, shifting market sentiment from bearish to neutral/bullish.
-Volume consolidation seen in the lower portion of the chart aligns with the tightening price action – often a precursor to breakout.
📊 Price Action Insights:
- The next potential retracement is expected around the Golden Pocket (0.618–0.65 Fib zone), which aligns with both the ascending triangle support line and demand zone – this confluence adds strength to the level.
- A breakout above the triangle's resistance, with confirmation, would present a long opportunity.
- Fair Value Gaps (FVGs) on the 4H timeframe are visible overhead at:
$0.7873 – $0.8061
$0.8401 – $0.8470
These serve as profit-taking targets for any bullish breakout trades.
📊 Volume Profile:
Using the anchored Volume Profile:
- High volume node is seen around $0.9141–$0.9889 – indicating historical resistance where price may slow down.
- Low volume node (volume gap) exists in the mid-region, implying a potential fast move through this zone if the triangle breaks upward.
❌ Invalidation Criteria:
This bullish setup is invalidated if:
- Price breaks below the ascending triangle support, followed by a loss of the swing low and demand zone below $0.7038.
This would likely lead to a continuation of the prior downtrend.
🧠 Conclusion:
The setup currently favors bulls, provided the ascending triangle holds. A confirmed breakout above resistance opens the path toward the identified FVG zones. However, risk management is crucial around the support area as a breakdown would negate the bullish structure.

FET | — No Longs Until LowerNYSE:FET is showing weakness after failing to reclaim the $0.80 level, which now acts as invalidation for any bullish setups. Price continues to grind below a key FVG resistance, with no clear breakout.
Plan:
🔻 No Long Setup While Below $0.80
• Bearish bias as long as price remains below reclaimed resistance
• Watching for potential move into lower FVG zones
• No interest in longs unless we see a sweep of key liquidity
🟩 Main Buy Zone: $0.30 (Weekly FVG)
• High-conviction area for long positioning if reached
• Deep liquidity pocket with HTF demand — ideal for spot entries
🎯 Reclaim of $0.80 = Invalidation of Bearish Bias
• Clean weekly close above flips structure bullish again
📌 Let the market flush first. No reason to catch a knife — play from strength, not hope.

TradeCityPro | FET: Bullish Weakness Near Key Support Zone👋 Welcome to TradeCity Pro!
In this analysis, I’ll be reviewing the FET coin — one of the popular projects in the AI space.
✔️ This project’s token currently holds a market cap of $1.75 billion and ranks 48th on CoinMarketCap.
⏳ 4-Hour Timeframe
On the 4-hour chart, we can see an uptrend in place. However, in its latest leg up to 0.923, the trend has weakened significantly and lost momentum.
💥 After getting rejected at 0.923, the price saw a deep correction down to 0.718 and failed to form a higher low — a clear sign of weakness in the bullish trend.
🔍 The 0.718 level is a crucial support, and breaking below it could trigger a long-term short position targeting 0.639.
✨ A confirmation for this short setup would be an RSI drop into the oversold zone along with increased selling volume. For now, sell volume is low and offers no confirmation yet.
🔔 On the long side, if the 0.764 level is broken, we can consider that 0.718 has held as support, allowing for a potential long entry.
🧩 In my view, even if this trigger activates and the price moves higher, it’s likely to form a lower high or retest the 0.923 level without breaking it. A breakout beyond 0.923 seems unlikely for now.
📈 For the long setup, RSI confirmation would come with a break above 42.05. As market volume is still declining, we’ll need to wait for increased buy volume to strengthen the bullish case.
📝 Final Thoughts
This analysis reflects our opinions and is not financial advice.
Share your thoughts in the comments, and don’t forget to share this analysis with your friends! ❤️

FET/USDTOnce the resistance of the falling wedge pattern for NYSE:FET is broken, the first target will be $3.

$FET is about to re-enter my buy green zone. Quick update on this coin:
The consolidation appears to have found its bottom, and the bullish divergence has played out as expected.
We’re currently seeing a slight cooldown on the daily timeframe, which is healthy after the recent move.
If NYSE:FET enters my green buy zone, it could offer a strong long entry opportunity.
As always, make sure to DYOR, especially during these uncertain times for altcoins.
#FET #CryptoUpdate #Altcoins #TechnicalAnalysis #BullishDivergence #CryptoTrading #BuyZone #CryptoMarket

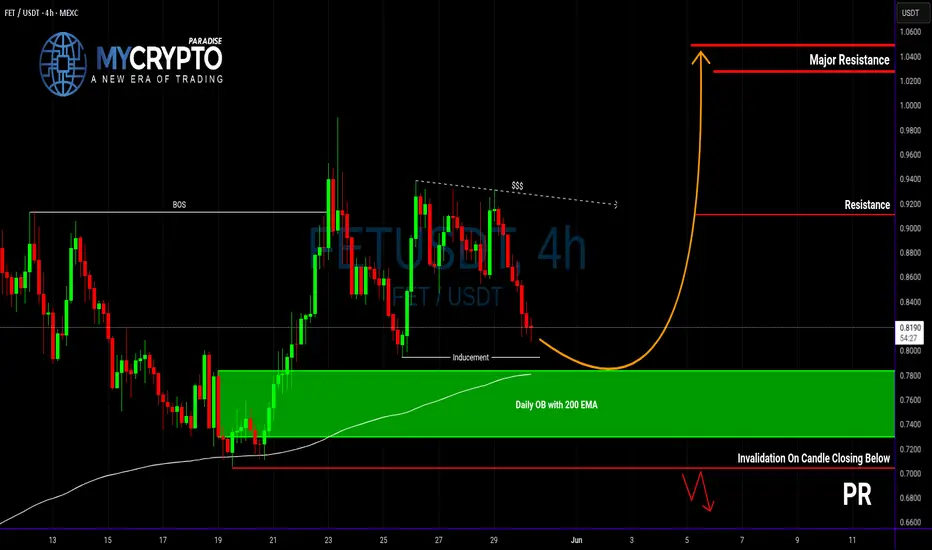
FET at a Make-or-Break Level... Will It Bounce or Break Down?Yello Paradisers, are you watching FET closely right now? If not, you might miss a textbook high-risk, high-reward setup that could play out very soon—just like we’ve been anticipating in our previous updates.
💎FETUSDT is currently respecting a bullish market structure, and price action is aligning for a potential inducement grab.
💎If this inducement occurs, and we start to see bullish confirmation signals from the Daily order block, backed by the 4H 200 EMA, then the probability of a strong bounce increases significantly. From a risk-reward perspective, this zone is shaping up to offer a solid long entry with clean invalidation.
💎But here’s the other side of the coin: if the price breaks down through the order block and closes a candle below our invalidation level, the bullish bias will be completely invalidated. In that case, patience becomes the strategy, and we’ll be waiting for more convincing and clearer price action to realign with a new setup.
🎖Strive for consistency, not quick profits. Treat the market as a businessman, not as a gambler.
MyCryptoParadise
iFeel the success🌴
Fet to LongFet is trading in an upward channel. one can open long position.
Entry: 0.8000
Target price 1:0.93
Target price 2: 1.0500
Stoploss :0.7550
DOYR
