Fetch AI (FET) is NOT done yet!FETUSDT successfully broke out of a Broadening Wedge continuation pattern. According to this pattern, the next price target for FET is located at $4. Do you agree? Let me know in the comments!
FETUSDT trade ideas

FETUSDTmy entry on this trade idea is taken from a point of interest below an inducement.. I extended my stoploss area to cover for the whole swing as price can target the liquidity there before going as i anticipate.. just a trade idea, not financial advise

Fetch AI FET | TOP SIGNAL?On the Logarithmic chart FET looks topped out for now reaching resistance and ready to pull back heavily.
If so the AI hype could take a back burner for a while untill we get another catalyst.
I could be wrong!
NFA

FETUSDT forming Bearish Divergence after a Huge Bullish Rally Trend Reversal can be seen if FET closes below 2.1 as Bearish Divergence can be seen at Daily Timeframe. This is not a financial Advice please do your Own Research.

Fet not looking too shabby at the momentOther AI coins will follow, potential for a leg up here with the break out.

fetusdtSupport and press the rocket to cheer me up
Observe the ten percent loss limit
Stay away from Bitcoins
Feel free to buy and sell and post your comments

FETUSDTmy entry on this trade idea is taken from a point of interest below an inducement.. I extended my stoploss area to cover for the whole swing as price can target the liquidity there before going as i anticipate.. just a trade idea, not financial advise

What was the trigger for the FET/USDT boost ?Here is an Ichimoku reading of the FET/USDT. We can clearly see that once the chikou span had got above its obstacles then the price boosted. That could strongly happen on a lot of cryptocurrencies that currently have their chikou span getting above its obstacles. It might be a good idea to buy. *MIGHT*.

FET price discoveryNYSE:FET is at an ATH. Checkback at previous ath right now.
Next target is the next fib. extension.

FETUSDTFETUSDT is trading in bullish flag pattern (Continuation pattern) which indicate that it will be bullish.
We can attempt to buy from specified level , its projected price will be 5.20.

FET - Bullish ScenarioIf FET is to continue bullish from here - the next target that I am seeing is $4.52.
Beyond that...$7.28.
This coin has had a ridiculous run!

FETUSDT.PHello Trader BINANCE:FETUSDT.P
bullish flag area in the large time frame range of its 3H-1D area. long postition can be taken from now on
take profit 26%
stop loss 6%
Please add a comment and Positive feedback and constructive criticism are important to authors and the community.
Disclamer: Not Financial Advice

FETUSDTWe might get a right-Angled and descending broadening pattern here as continuation, next target for me to take some profits is the 4.3-4.5 Dollar level.

FET It's a bullish priority#FET/USDT
While this local ascending channel is intact on weekly timeframe👀
It's a bullish priority📈

FET weekly analyzeGreetings everyone,
FET has experienced a significant correction of over 50% after a major pump and is currently in a resting phase. As shown in the chart, FET is experiencing a pullback to the broken pivot in the weekly timeframe, and we can anticipate it to find support and rebound between 0.18-0.25. It may be advisable to wait for this area to establish a new long position. Our analysis suggests that in the next round, FET has the potential to reach the price range of 0.81-1$.
We also recommend monitoring FET/BTC as it is approaching the support area in the daily timeframe. It may be prudent to buy in the spot around the pivot while keeping an eye on the price levels.
Please note that investing in cryptocurrencies comes with significant risks. It is always wise to conduct your research and consult with a financial advisor before making any investment decisions.

Another Bullish Wave About To Start Soon 👉 Perfect Bull Flag Formed At The Chart By The Clear ABC Corrective Pattern And The Price Bounced From The 2.52$ PRZ As a Wave C Low ,Expect a Breakout From The Trend Line Toward a 3.5$ As a Next Target Soon

Fet Fet is taking liquidity only from market before another leg up. Now it has taken previous high liquidity and created trendline liquidity. And also left behind three poi for long oppertunity. But first poi is strong becase it lies in 0.38-0.35 of fibb. Other two pois can been used for dca.

FETUSDTFETUSDT is currently in a bullish trend.
Price is forming a bullish flag pattern, indicating a potential continuation of the uptrend.
The pair is finding support at the 50% Fibonacci retracement level, adding confluence to the bullish bias.
What you guys think of this idea ?

FET long-term plan
AI hype has started again. Important AI cryptos are AGIX, OCEAN and FET. If you know any other one, please comment and share information.
Fetch.ai aims to enable a decentralized economy where autonomous agents can collaborate and transact efficiently without relying on a centralized authority.
I know that many of you may buy FET at much lower prices but in my opinion, this level is still interesting for a long-term hold.
In weekly time-frame, FET is breaking the neckline and the rally will continue.
With medium market cap of $400M at the current price, my targets are $2.5, $4.5 and $9.
------------- Information on FET -----------
FET (Fetch.ai) is a decentralized digital currency and blockchain project. It aims to develop a decentralized infrastructure for autonomous economic agents (AEAs) to perform various tasks, such as data sharing, AI learning, and machine-to-machine transactions. This infrastructure is designed to facilitate the efficient exchange of data and services between different AI systems, IoT devices, and other digital entities.
Disclaimer:
This analysis is based on my personnal views and is not a financial advice. Risk is under your control.

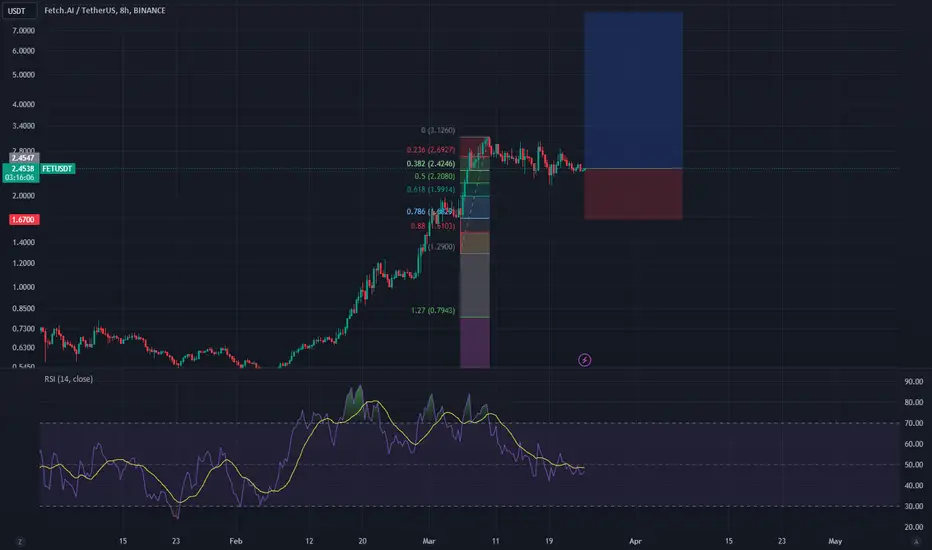
Fetch A.I.: A Rising Star in the Crypto SkyFetch A.I. has impressed in recent weeks with extreme growth: The coin has surged approximately 400% since February 2024, far outperforming many other altcoins. Naturally, it's not realistic to expect this price momentum to continue at the same pace. However, we remain highly bullish on Fetch A.I. and anticipate prices around $8. The presented trading idea offers an excellent Risk-Reward Ratio (RRR) of around 7:1, making the purchase of Fetch A.I. a strong long-term investment for crypto portfolios.
Below, you'll find an overview of the key features of this coin.
Key Features:
Decentralized Autonomous Organization (DAO): Fetch.ai is governed by a DAO that promotes community decisions and developments.
Open-Source Platform: Developers can leverage the Fetch.ai platform to create their own AI-based applications and services.
Interoperability: Fetch.ai is compatible with other blockchains to facilitate seamless interactions between different systems.
Utility Token (FET): The FET token serves as fuel for the Fetch.ai network, enabling the utilization of its various functions.
FET 23/03/2024 PWO-WO levels are strong resistances we must pass to aim for higher prices. The price can go to fill imbalances for more buyer. or it can consoidate here and then break those levels. We'll see.

FET is preparing for takeoff?? patience and faith.
.
BINANCE:FETUSDT
.
We are going to see some goods ones.

FETUSDT is looking Bullish as it is making a bull flag on TFA bull flag formation typically occurs as a temporary pause or consolidation within an uptrend, characterized by a downward sloping flagpole followed by a parallel consolidation channel, resembling a flag. This pattern often signifies a continuation of the previous uptrend, suggesting that FETUSDT could experience further price appreciation in the near term.
