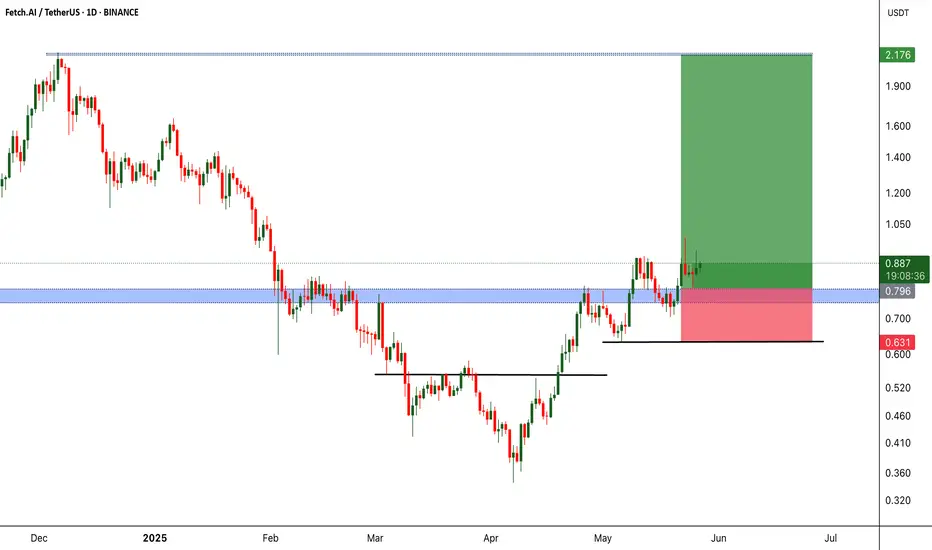
FETUSDT Major Resistance Cracked, Eyes on Sky!BINANCE:FETUSDT has recently broken out from a significant resistance level that previously acted as a strong barrier. After this breakout, the price action displayed a textbook retest of the former resistance—now turned support which held firm, confirming the bullish move.
This successful retracement signals strength in the current uptrend and opens the door for potential continuation towards higher highs. The market structure is showing signs of higher lows and increasing momentum, which could fuel a strong rally in the near term.
While the setup looks promising, it’s essential to emphasize risk management. Always use a stop-loss to protect your capital and manage your position sizing according to your trading plan. The crypto market can be volatile, and smart risk control separates long-term winners from short-term chasers.
All eyes are now on NYSE:FET for its next move. If momentum continues, we could witness a significant upward leg. Stay sharp and let the trend be your guide!
BINANCE:FETUSDT Currently trading at $0.88
Buy level : Above $0.8
Stop loss : Below $0.63
Target 1: $1.1
Target 2: $1.4
Target 3: $2.1
Max leverage 3x
Always keep stop loss
Follow Our Tradingview Account for More Technical Analysis Updates, | Like, Share and Comment Your thoughts
FETUSDT trade ideas
The key is whether it can find support near 0.846 and rise
Hello, traders.
If you "Follow", you can always get new information quickly.
Have a nice day today.
-------------------------------------
(FETUSDT 1D chart)
The M-Signal indicator on the 1M chart is abnormal, so the key is whether it can hold the price.
If the price is maintained above the M-Signal indicator on the 1M chart, it is highly likely that the upward trend will continue in the medium to long term.
Accordingly, we should check whether it can be supported and rise around 0.846.
If it fails to rise, the support range is expected to be around 0.424-0.534.
-
When the rise begins,
1st: 1.194
2nd: 1.556
Responses are required depending on whether there is support around the 1st and 2nd above.
The 1.194 point corresponds to the support and resistance range in the candle arrangement.
-
Thank you for reading to the end.
I hope you have a successful transaction.
--------------------------------------------------
- This is an explanation of the big picture.
(3-year bull market, 1-year bear market pattern)
I will explain more details when the bear market starts.
------------------------------------------------------

$FET has successfully broken🚀 FET Weekly Breakout Update – Eyes on the Next Leg!
NYSE:FET has successfully broken out of the falling wedge structure, a strong bullish reversal pattern. Price is currently hovering near the breakout level, preparing for a potential retest.
📍 Key zone to watch: $0.68–$0.72
This area aligns with the 0.618–0.5 Fibonacci levels and should act as strong support during any pullback.
📈 If the retest holds, next targets are:
🎯 Target 1: $1.259
🎯 Target 2: $1.677
Momentum is building — a bounce from the demand zone could trigger a new impulse wave upwards.

High TF Fet SetupI’ll start filling my spot bags around $0.58.
The high timeframe bottom is in, and a beautiful bullish structure is taking shape.
This is one of those moments where the setup does the talking.
Would be a shame to let it slip by...

#FETUSDT A red resistance band, crossing which at the red arrow point can lead to further good growth.
It is also clear that with a possible breakdown of the green support line,
there can be a good decline.
$FETUSDTHere's a clearer and more polished version of your statement:
My projection for FET is that it will rise to around $1.569 before facing any significant correction. After this correction, I expect the price to resume its upward rally.
Not a financial advice. Trade at your own risk!

$FET has formed an ascending triangle pattern!NYSE:FET has formed an ascending triangle pattern!
After getting rejected from the $0.93–$0.95 resistance zone, price pulled back but it's holding above this lower trend-line support and this 100EMA.
If this support holds, we could see a move back toward the resistance zone, and maybe even a breakout above it.
DYOR, NFA

#FET/USDT#FET
The price is moving within a descending channel on the 1-hour frame, adhering well to it, and is heading for a strong breakout and retest.
We are seeing a bounce from the lower boundary of the descending channel, which is support at 0.814.
We have a downtrend on the RSI indicator that is about to be broken and retested, supporting the upward trend.
We are looking for stability above the 100 moving average.
Entry price: 0.823
First target: 0.866
Second target: 0.912
Third target: 0.957

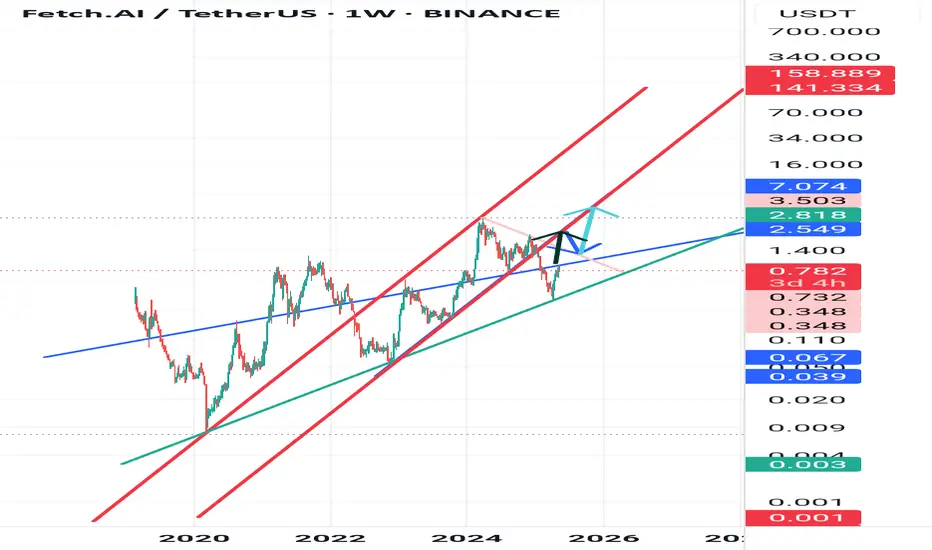
FET ROADMAPTo me the view is pretty clear.
* The purpose of my graphic drawings is purely educational.
* What i write here is not an investment advice. Please do your own research before investing in any asset.
* Never take my personal opinions as investment advice, you may lose your money.

$FET/USDT 2H Setup$FET/USDT 2H Setup
Breakout above trendline + RSI recovery = bullish signal!
- Entry: $0.7373
- SL: $0.7064
- Target: $ 0.7889 / $0.9154
Clean 5R+ setup. Momentum is building fast! 🚀
DYRO, NFA

Buy Trade Strategy for FET: Tapping into AI-Powered Blockchain GDescription:
This trading idea focuses on FET, the native token of Fetch.ai, a platform that combines artificial intelligence (AI) and blockchain to enable autonomous economic agents. FET is central to facilitating transactions, smart contracts, and data sharing within a decentralized, machine-learning-driven ecosystem. With the rapid global interest in AI technologies and decentralized automation, Fetch.ai positions itself at the intersection of two of the fastest-growing tech sectors. Its real-world use cases—ranging from smart cities to supply chains and finance—highlight its long-term growth potential.
Despite these promising fundamentals, it’s important to remember that the crypto market remains highly volatile. Regulatory shifts, evolving investor sentiment, and broader tech trends can all impact FET’s market performance. Investors must stay informed and exercise strong risk management practices.
Disclaimer:
This trading idea is for educational purposes only and does not constitute financial advice. Trading cryptocurrencies like FET involves substantial risk, including the potential loss of your entire investment. Always conduct your own research, carefully assess your financial situation, and consult with a licensed financial advisor before making investment decisions. Past performance is not indicative of future outcomes.

#FETUSDT #4h (Bitget Futures) Falling wedge breakout and retestFetch just regained 100EMA support and looks good for bullish continuation from here.
⚡️⚡️ #FET/USDT ⚡️⚡️
Exchanges: Bitget Futures
Signal Type: Regular (Long)
Leverage: Isolated (4.0X)
Amount: 5.0%
Current Price:
0.7863
Entry Zone:
0.7806 - 0.7504
Take-Profit Targets:
1) 0.8561
1) 0.9244
1) 0.9926
Stop Targets:
1) 0.6897
Published By: @Zblaba
NYSE:FET BITGET:FETUSDT.P #4h #Fetch #AI fetch.ai
Risk/Reward= 1:1.2 | 1:2.1 | 1:3.0
Expected Profit= +47.3% | +83.0% | +118.7%
Possible Loss= -39.6%
Estimated Gaintime= 1-2 weeks

FET Approaching Breakout Zone – Momentum Building🚀 NYSE:FET – Breakout Watch
FET is now testing a key horizontal resistance near $0.81± — a pivotal level to flip for bulls 🔥
If this zone turns into support, we could see a breakout pump kick in with strength 📈
Momentum is gradually building, and this setup has all the signs of a high-energy move ahead 💥
👀 Stay sharp — breakout traders will be eyeing this zone closely!

FETUSDT : Massive Opportunity or Fakeout Trap?Yello Paradisers, have you been watching FET lately? If not, now is the time to pay close attention—because this setup could be gearing up for a serious move, and missing it might mean missing one of the cleanest opportunities this month. Let’s break it down before it’s too late.
💎FETUSDT is currently displaying a bullish market structure on the higher timeframes, signaling growing strength beneath the surface. Even more compelling is the fact that it has just formed a classic falling wedge pattern—a powerful reversal setup—paired with a bullish divergence. This combination significantly increases the probability of a bullish breakout from current levels.
💎Right now, price is sitting right on a key support zone, which is reinforced by the 200 EMA. This confluence of support gives added confidence to the setup and boosts the probability of an upside move. The risk-to-reward ratio from this zone is also highly attractive, making this one of those clean opportunities that traders should never ignore. The bullish outlook remains valid as long as price holds above our invalidation zone.
💎However, if the price breaks down and closes below this invalidation level, then the entire bullish idea is off the table. In that scenario, it’s wiser to stay patient and wait for stronger, more reliable price action to develop before re-entering the market. There’s no need to rush a trade when better setups are always around the corner.
Discipline, timing, and execution will always separate the professionals from the crowd. Stay focused, Paradisers—the market rewards those who move with purpose, not panic.
MyCryptoParadise
iFeel the success🌴

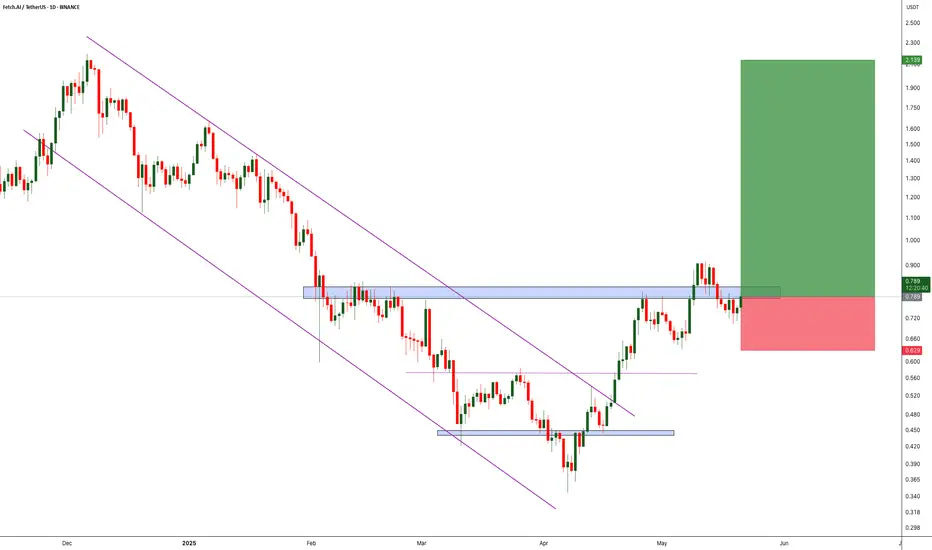
Eyes on FET – The Calm Before the Bullish Storm?BINANCE:FETUSDT previously broke out of a clean descending channel, flipping the trend and shifting into a bullish structure. Since the breakout, the price has been forming consistent higher highs and higher lows — a clear sign of growing momentum. Right now, it’s testing a local resistance zone. A strong breakout above this level could trigger a significant move to the upside, potentially setting the stage for a new bullish leg. Keep an eye on volume confirmation and price action at the resistance.
As always, manage your risk carefully — smart stop loss placement is key in volatile markets. Let the trend be your friend, but don’t forget your seatbelt!
BINANCE:FETUSDT Currently trading at $0.8
Buy level : Above $0.8
Stop loss : Below $0.63
Target : $2.1
Max leverage 3x
Always keep stop loss
Follow Our Tradingview Account for More Technical Analysis Updates, | Like, Share and Comment Your thoughts
FET: AI Leader#FET made a strong bounce from its early April low, signaling bullish potential for the long term and setting up for another possible rally toward a new ATH.
$0.344 is the stop-loss. Passing $0.914 confirms strength, and $2.2 breakout confirms a major bull-run.
#ASI

#FET/USDT#FET
The price is moving within a descending channel on the 1-hour frame, adhering well to it, and is heading for a strong breakout and retest.
We are experiencing a rebound from the lower boundary of the descending channel, which is support at 0.696.
We are experiencing a downtrend on the RSI indicator, which is about to break and retest, supporting the upward trend.
We are looking for stability above the 100 Moving Average.
Entry price: 0.721
First target: 0.779
Second target: 0.817
Third target: 0.863

#FET/USDT#FET
The price is moving within a descending channel on the 1-hour frame, adhering well to it, and is heading towards a strong breakout and retest.
We are experiencing a rebound from the lower boundary of the descending channel, which is support at 0.695.
We are experiencing a downtrend on the RSI indicator that is about to be broken and retested, which supports the upward trend.
We are heading towards stability above the 100 moving average.
Entry price: 0.730
First target: 0.765
Second target: 0.810
Third target: 0.850

Fet rename to ASI and flyHello everyone
Today I focus in fet chart and analysis this coin
As you can see dynamic trend ,Prevented from doing more growth0/90~0/92
Short term(less then 2months)2/2~2~5
Mid term(late in the year)5/5~7
Thank you everyone to see and think my opinion
With respect to all
Fetch your Future with FET!Here is the FET M.Profile
FET/USDT has shown strong strength over the past sessions, forming a clear upward structure supported by consecutive higher value areas and rising POCs. After a period of low activity and tight consolidation between $0.72–$0.76, a strong breakout occurred with aggressive buying around the $0.78–$0.80 range. This expansion is now being validated by healthy volume nodes and POC shifts moving upward. The current zone around $0.86–$0.89 is developing value higher, indicating strong buyer control. As long as FET holds above the previous VAH around $0.84, bullish momentum is intact, and we could see a push toward psychological resistance at $0.90 and then $0.93. However, any drop below $0.84 may test back toward $0.80 where demand previously stepped in. This is a classic trending auction build-up — favoring long bias on pullbacks.
My doodle suggests this is the most best chart to bee seen in terms!

7 reasons why people may still struggle to make money in crypto Why people may still struggle to make money in #crypto
1. ** #Market Volatility**
- The cryptocurrency market is highly volatile, with prices fluctuating dramatically. This can lead to significant losses if investments are not timed well.
2. **Lack of Information**
- Insufficient information can hinder investment decisions, making it difficult to identify profitable opportunities.
3. **Fraud and Scams**
- The crypto space is rife with scams and fraudulent schemes. It's crucial to be able to distinguish between legitimate projects and scams.
4. **Lack of Long-term Perspective**
- Many investors focus on short-term gains, which can lead to impulsive decisions and losses, rather than holding for the long term.
5. **Emotional Trading**
- Emotional reactions to market changes can lead to poor decision-making, such as panic selling or chasing after trends.
6. **Regulatory Uncertainty**
- Ongoing regulatory changes can impact the market and create uncertainty, affecting investment strategies.
7. **High Transaction Fees**
- Transaction fees can eat into profits, especially for smaller trades.
Conclusion
Investing in cryptocurrency requires careful research, a clear strategy, and an understanding of the risks involved.

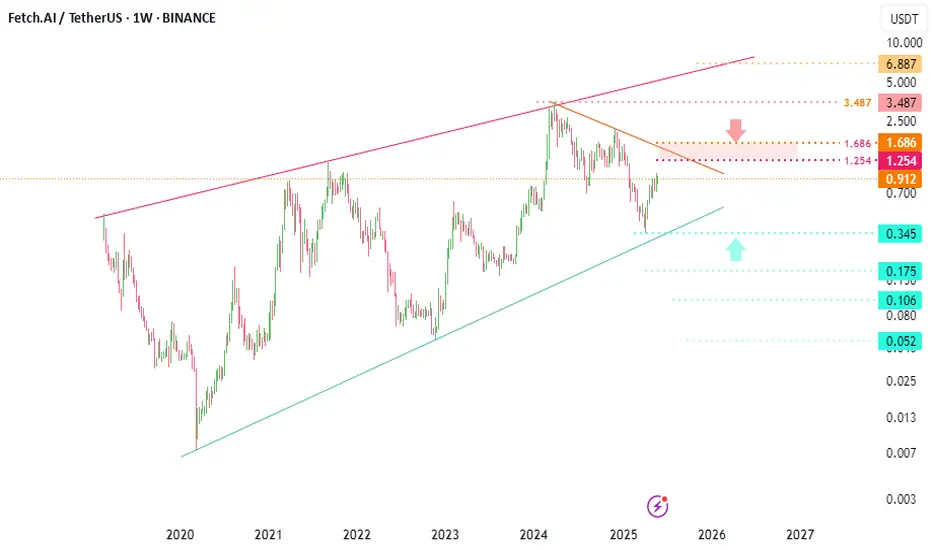
FET/USDT – Daily Technical AnalysisFET/USDT – Daily Technical Analysis
On the daily chart , FET has key weekly support at $0.340 and weekly resistance at $2.00. After a strong upward move, the price has now reached the top of its descending trendline, which may lead to a potential short-term correction.
This correction could extend down to the daily support level at $0.50, which is around 20% below the current price.
However, if the price manages to break above the daily resistance at $0.80, it would signal bullish continuation, with a short-term target at $1.00.
🟢 Support Levels:
$0.50 (daily support – potential correction target)
$0.340 (weekly support – major long-term level)
🔴 Resistance Levels:
$0.80 (daily resistance – key breakout level)
$1.00 (initial bullish target after breakout)
$2.00 (weekly resistance – major long-term barrier)

