$FET FetchAi Liquidity Zones My current thoughts on FET are that we sweep liquidity in green, unless the above supply level is confidently flipped. We have a rounding off top (3rd attempt to break this level) with weakness showing.
Liquidity, untapped, remains below in green if it cannot push past this resistance area soon.
Another great opportunity to accumulate for the long term if we get green imo.
V
FETUSDT trade ideas

FET/USDT Elliott Wave CountFET/USDT Weekly chart , Elliott Wave Count.
.................................................................................................................
We are not registered or licensed in any jurisdiction whatsoever to provide investing advice or anything of an advisory or consultancy nature.
and are therefore are unqualified to give investment recommendations.
Always do your own research and consult with a licensed investment professional before investing.
This communication is never to be used as the basis of making investment decisions, and it is for entertainment purposes only.

FET Sitting on TrendlineNext hours will be decisive for FET coin. It's sitting on important trendline. A break below the trend, will confirm a possible pull back till 0.4 area. A reject of the trendline, could means a continuation. I will wait for some moves before entering

#Fet 4h possible run, in my opinionI think fet will follow this trend, i made this early but had no time to post so if btc stays like this fet will reach .70 soon.
Not financial advice

✴️ FetchAI Fast 50% Jump In The Making ($40K Bitcoin?)FetchAI (FETUSDT) just broke EMA100 as resistance and is starting to gain in bullish momentum.
I mentioned that this pair moved first in early 2023, one of the strongest, and its breakout revealed what was coming to the rest of the Crypto-market.
Now, many Altcoins aren't looking that beautiful, people still have their doubts about Bitcoin and what is likely to happen next. FetchAI can help you clear those doubts if you are part of that group, this chart is saying "massive strength".
We have a low 10-June followed by a higher low in August (based on session close), this is a repeating pattern all across the market. We see this pair moving forward and that's exactly what the rest of the market will do.
Here I am mapping a short-term move but this isn't likely to be all.
Almost 7 months of correction, it has to end at some point.
We are in a bullish trend, after the correction is over a higher high comes next.
✔️ Can't wait to see how it all develops... Positive!
✔️ Can't wait to see Bitcoin hitting above $40K... Easy!
Namaste.

🚨 Trade Alert: FET/USDT (3-5x)🚨 New Trade Alert 🚨
✅ FET/USDT (3-5x)
📉 LONG Entry Zone: 0.484 - 0.5134
⛔️ SL: 0.4588
🔒 Breakeven Move: When it moves close to TP2
🎯 Take Profit:
Short Term: 0.52 - 0.525 - 0.53 - 0.54 - 0.55
Mid Term: 0.56 - 0.58 - 0.60 - 0.62 - 0.65
📝 Ensure you set entry orders to balance the trade's entry and aim to secure 30% of profits within the first two targets. Once profits are gained, adjust the stop orders to match the entry points or break-even levels.
⚠️ Disclaimer: Historical earnings cannot assure future outcomes. Is there a potential for risk? Certainly. The entire financial market is susceptible to uncertainties; any underlying factor or abrupt shift in market sentiment could overturn the current market trends and lead to losses. Refrain from undertaking undue risks that might jeopardize your financial stability. You are under no obligation to engage in this trade; kindly avoid the trade if you disagree with the trade analysis.
GIS TRADING®


FET possible Buy zones Potential areas to buy are shown as green bundles, We are waiting for a decrease in price according to the market trend.


FETUSDTFETUSDT is in bearish trend.
Printing LH and LL.
Bearish divergence also shown in RSI.
We wait and watch for the breakout of last LL.

FETUSDTThis A.I leader is about to breakout and go beast mode
Now trading above upper band which is the super BULL level

Fetch Bearish patternFetch.Ai prices will fall as there is a bearish wedge formation. BINANCE:FETUSDT

FET/USDT Distibution Phase. Need retesting to continue upward !!💎 FET has certainly captured the market's attention with its notable performance. At present, FET is experiencing consolidation within the supply zone. Typically, consolidation at higher levels can indicate a distribution phase, suggesting a potential downturn for a corrective test at the demand levels between $0.308 and $0.277.
💎 This observation comes from the fact that FET has not yet undergone a retesting phase following its breakout above the supply area. Should the asset retrace to these demand levels, a significant bounce could be anticipated, probability of FET toward the target supply zones and beyond.
💎 However, should FET revisit the demand zone without showing signs of a strong rebound—failing to reject lower prices—it could signal a loss of the demand area. Such a development would indicate bearish momentum for FET, opening the door for a possible descent to lower demand levels and potentially revisiting the key support area.


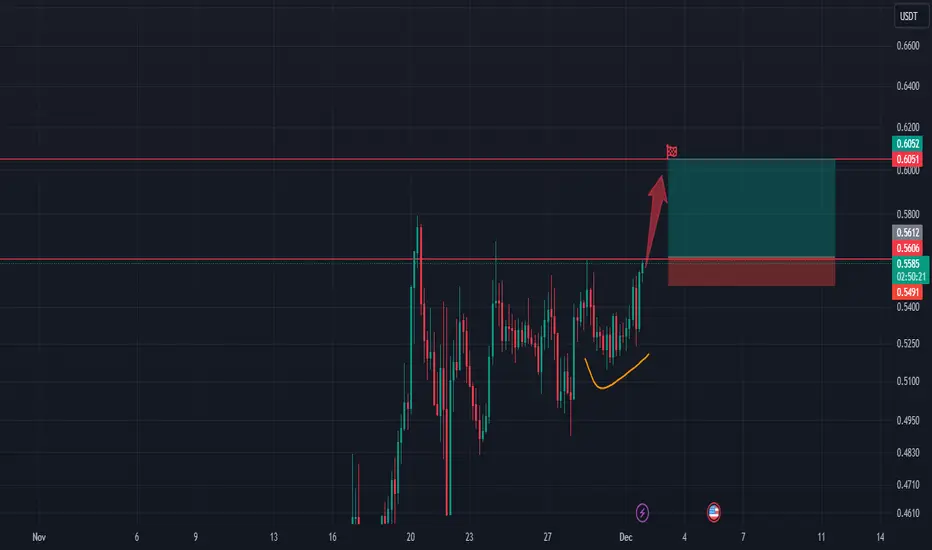
FET/USDT Had a Good Run | 👀🚀 What's Next Possible Move?💎 Yello, Paradisers! Turn your attention to FETUSDT – it's currently exhibiting an upward momentum within an ascending channel, hinting at a potential adjustment in response to a nearing supply zone.
💎 Recently, Fetch.AI has been steadily climbing within this channel. Yet, we might witness a shift or correction in the near future. It's crucial to acknowledge that FET is nearing a pivotal resistance level at $0.6061.
💎 Just past this resistance lies a notable supply zone, identified by an untouched Order Block (OB). If FET dips below the support level of $0.50, we anticipate a move towards the demand zone, as detailed in our analysis.
💎 Upgrade your trading strategies for Fetch.AI with ParadiseFamilyVIP. Dive into more comprehensive insights on FET and other promising cryptocurrencies, refining your crypto trading techniques

FET/USDT potential shift? ? 👀 🚀 FET Today analysis💎 Paradisers, turn your attention to FETUSDT! We've observed its trajectory as it faces rejection from the resistance level, hinting at a heightened likelihood of a bullish surge from the Bullish OB.
💎 In recent history, FETUSDT managed to break free from a descending trendline, charting an upward course. At present, after facing rejection at the 0.3902 resistance level, the odds are leaning towards a bullish resurgence from the Bullish OB level.
💎 Additionally, the asset's strong momentum above the ema100 further amplifies the bullish narrative. However, be cautious: a breach below the .2806 level could signal a potential downward shift. Stay vigilant and strategize accordingly

FETUSDT 4h time frame analysisFETUSDT looks mega bullish.
AI narrative drags the price higher.
The price is at the resistance now , but it has tested it already many times
Trade the breakout
entry , stop loss and target are shown on the chart
Let's go!
The Setup Is Bullish📥The Main Pattern Is Triangle Which Is a Sign of New Bullish Movement, I a Expect Breakout The Trend Line In Near Future
👉Targets Are 0.55$ And 0.65$

Going to 1!!!!Seems like NYSE:FET will be continuating the bullish trend! about 0,6 soon will take some days to 1 will not be quick, so patience.
My personal target for long term: $4

💡Trade Idea #FET/USDT:After this clean breakout #Fetch.AI pumped by +156%. I see an upcoming potential divergence by using different indicators and I believe that it's time to cool it off. Crazy rally.

$FET New Trend In The Market What NYSE:FET is showing it looks like seller are coming into the market and buyer are living the market . If u find this helpful please like and follow

FETUSDT realize massive profits 169% 🔥🔥🚀🚀 #FETUSDT
Spot VIP 🔥🎯
BoooooooM 🚀🚀
All Targets: done✅
Entry price: 0.2157$✅
Price reached : 0.5797$ ✅
Profit: 169.49% ✅🚀🚀🤑
🚀 Breaking News: FET/USDT Soars to Unprecedented Heights with a Staggering 169% Surge in the Spot Market! 📈
In a spectacular turn of events, the digital currency FET/USDT has witnessed an extraordinary surge, catapulting an astonishing 169% in the spot market. This meteoric rise has captivated the attention of traders and investors alike, marking a historic milestone for FET enthusiasts.

Double Bottom W on the 4HThis should mean that FET is ready to run possible 0.75 in play. Invalidation 0.50
