FET Broke Out of long consolidation📈 NYSE:FET has broken out of a prolonged consolidation phase! 🚀 Keep a close eye on these key areas in the days ahead as the momentum builds. Exciting times ahead for #FET! 💥🔍 #Crypto #Trading #BullishTrend
FETUSDT trade ideas

Fet getting ready Move Towards 0.50$Seems Like fet Ready To Advance towards 0.50 Formed ^ Breaking Descending Channel In daily Tf Incase Of Successful Breakout expecting Move Towards 0.50$ In Coming Weeks

Two points to buy | Bounce from supportFetch BINANCE:FETUSDT is downing to the support zones at 0.18 and 0.135
It's trading at 0.197x now
Those zones are good to buy
Wait a next move

#Fet usdtWhat Is Fetch.ai (FET)?
Founded in 2017 and launched via IEO on Binance in March 2019, Fetch.AI is an artificial intelligence (AI) lab building an open, permissionless, decentralized machine learning network with a crypto economy. Fetch.ai democratizes access to AI technology with a permissionless network upon which anyone can connect and access secure datasets by using autonomous AI to execute tasks that leverage its global network of data. The Fetch.AI model is rooted in use cases like optimizing DeFi trading services, transportation networks (parking, micromobility), smart energy grids, travel — essentially any complex digital system that relies on large-scale datasets.

FETUSDTFETUSDT is trading in bearish parallel channel and reached at very strong demand zone. In past this demand zone shown very fine bullish reaction. Currently the price is also giving respect to declining trendline. Once the price is able to break declining trendline it will be a nice bullish run.

FETUSDTHello Traders,
As we can see there is a huge dump in FET but for noe it comes to the trade and we can open a long position from and we can expect a bullish move from here.

FET/USDT for Middle-Term GrowthFET/USDT, the trading pair representing Fetch.ai against Tether (USDT) on the Binance Spot exchange, has shown interesting potential for middle-term movement. As we examine the historical price data and market dynamics, several key points emerge:
1. Middle-Term Uptrend**: Over the past few months, FET/USDT has displayed a discernible uptrend, indicating growing interest from investors and traders. This bullish bias suggests that the market sentiment has been positive, with increasing demand for Fetch.ai, the native token of the decentralized artificial intelligence platform.
2. Strong Support Levels**: During this middle-term period, FET/USDT has formed robust support levels at various price points. These levels have proven significant as they attracted buying interest and prevented substantial price declines. Traders closely monitoring the market should pay attention to these support zones, as any breach could indicate a potential trend reversal.
3. Resistance Levels to Overcome**: Despite the uptrend, FET/USDT has encountered resistance at specific price levels. These resistance barriers have impeded further upward movement, leading to consolidations and corrections. As traders evaluate potential entry and exit points, these resistance levels are crucial indicators to consider.
4. Volatility and Trading Volume**: The middle-term analysis has observed intermittent spikes in volatility and trading volume for FET/USDT. Such periods of increased activity might be driven by news events, project developments, or broader market sentiment shifts. Traders should be cautious during these phases as market conditions may change rapidly.
5. Market Sentiment and Fundamental Analysis**: Middle-term movement in FET/USDT is likely influenced by both market sentiment and fundamental factors. Positive project developments, partnerships, and technological advancements could act as catalysts


📉FETCH.AI --> 0.21$ then 0.18$ 📈BINANCE:FETUSDT
COINBASE:FETUSD
Hello Traders, please check out my previous ideas.
If the price stabilizes above the red area, the short scenario won't be fulfilled.
targets are on the chart.
optimum stop-loss is above the 0.2561 level.
✌💥If you are satisfied with my analytical content, please share my ideas💥✌
✍🐱👤Otherwise, make sure you leave comments and let me know what you think.🐱👤✍
🤑🍾Thank you for your support. I hope you will gain profit by following my analyses.🍾🤑
CrazyS✌

FET/USDTwhen I tweeted this I aped into NYSE:FET and sold at 500% profit in spot position even though it pumped 900%
I was going to ladder back in thinking the cup and handle pattern will play out but we have formed a descending channel pattern now and I am extremely bullish on NYSE:FET due to #AI not being a narrative anymore but it is also a category now, as long as this team continues to build they will receive my support.
Sitting currently at around $219M MC can easily pump to around $4.5B MC, so I will be laddering back in by DCA and everytime it comes to the bottom of the channel I will add!

FALLING WEDGE & IMPORTANT TREND LINE 🏋HI😍❤️
It is expected that if the (FALLING WEDGE) line break, the (RED) trend line will be supported and move UP 🤔

FET shortFET broke trough the support level. Asset broke trough the ascending trendline. Bearish movement to support level at 0.213 is possible.

FETUSDT 1DCan #FET pass this heavy resistance? I'll bullish when it breakout the resistance cluster. This coin is in my watchlist.

FET Trading Plan, July 16th – 22nd, 2023• Since it broke out of the Descending Wedge, FET is ranging between 0.21 – 0.255 USD.
• Considering that the TOTAL3 chart indicates a bullish breakout, my bias remains bullish.
• On July 14th, FET hit the upper boundary of a 1H demand zone and bounced. Until a confirmed break out of the range high, a return to the range lows is still likely.
• I am posting two short-term trade ideas. However, my mid-term target for FET is 0.395 USD based on the breakout target from the Descending Wedge.
Trade Idea No. 1:
• Entry: 0.22 (4H demand zone)
• SL: 0.21
• Target: 0.254
• R: R: 1:3.4
Trade Idea No. 2:
• Entry: 0.2547 (range breakout after retesting as support)
• SL: 0.2415 (Range low).
• Target: 0.395
• R: R: 1:10.6
$FET, 2D Buy hitting on yesterday close by the UCTS indicator.NYSE:FET
2D Buy hitting on yesterday close by the UCTS indicator.
Slowly the market turning bullish across the board.


$FETNYSE:FET is currently trading in a range, GP/support at 0.2$.
it has a big resistance at 0.236$ which is POC,GP and may lows,
0.236$ needs to be reclaimed for continuation to the upside.

FET shortFET broke trough off the lower boundary of ascending channel. Asset broke trough the support level. Bearish movement to support level at 0.205 is expected to happen.


fet usdt tf 1 hour .As i am sharing fet long idea . mark my word when ever fet touch this price open long position everything entry tp and sl mentioned in the idea . and thanks me later


FET Breakout ImminentLong awaited breakout imminent for FET
Will the AI narrative continue this year?

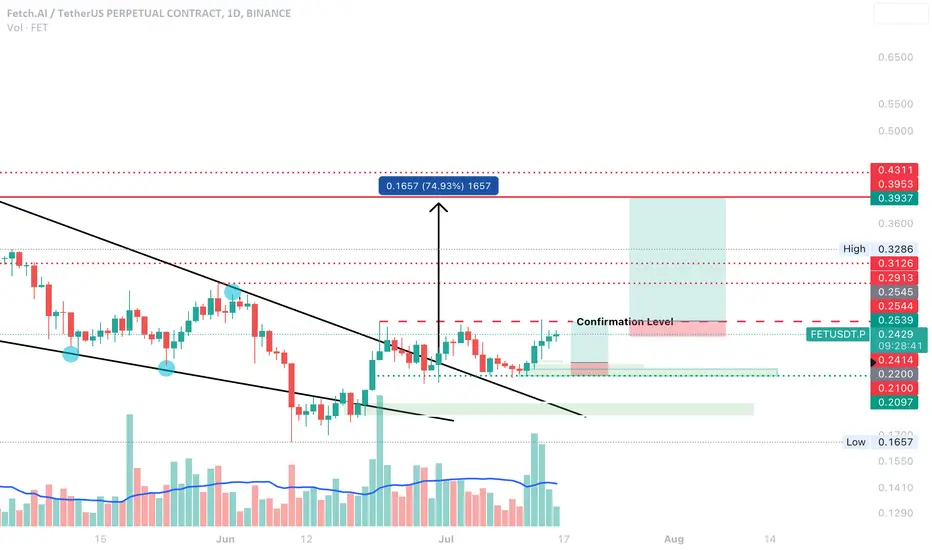
FET – Falling Wedge breaks Out to create Bull Flag
Please Read my previous FET idea for more context.
For now, it looks as if FET broke out of the Falling Wedge, and it is forming a Bull Flag.
Falling Wedge target: 0.422 USD
Bull Flag Target: 0.31 USD
Both targets have confluence with daily resistance level and can serve as TPs.
Final confirmation is when FET breaks above 0.2544 USD. You don’t have to wait for 0.25 to take the trade.
Trade Idea No.1:
Entry: 0.235 USD (approximately, break out of the Bull Flag)/
SL: 0.2040 USD
Target: 0.4223 USD
TP: 0.31, 0.4223 (leave some on the table)
R: R: 1:6
Trade Idea No. 2:
Entry: 0.254
SL: 0.2238 (below the Flag’s resistance line)
Target: 0.41
TP: 0.31, 0.4223 (leave some on the table)
R: R: 1:5.94
