FETUSDT trade ideas

FET – Descending Wedge Breakout• FET broke out of the upper trendline of the Wedge.
• Final confirmation is above the previous wick at 0.2544 USD.
• The Wedge’s target is 0.3866.
• I expect a lot more from FET.
• Please read my previous FET Idea for more context.
NFA.
What do you think? Please share in the comments.
Best wishes to all.

Fetch journey massive gains?!!👀 🚀FET today analysis💎FET is exhibiting signs of a potential upward shift. It's currently trading within a channel pattern, creating a series of lower highs and lower lows.
💎We're anticipating a breakout in the upward direction, which could signal a bullish trend.FET is trading in a high-demand area, which further bolsters the potential for an upward move.
💎Another key observation is the impending crossover with the 50-day Exponential Moving Average (EMA). If FET can maintain its momentum at this level, it could potentially alter the market dynamics.
💎In the dynamic world of crypto, staying informed and adaptable is key. Stay tuned for more updates and enjoy your trading journey!

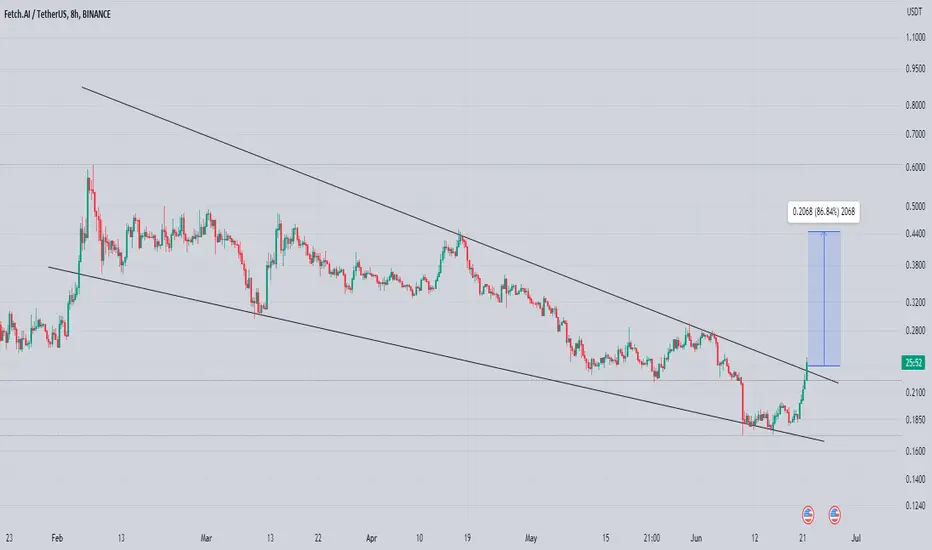
FET – Possible Reversal PatternTLDR:
• FET is reentering a Falling Wedge pattern. FET is testing the support trendline ATM. If the test is successful, it is a possible long opportunity with a close invalidation and great R: R.
Background:
• Fetch AI is in a correction since February 2023.
• This correction is taking the shape of a Falling Wedge reversal pattern.
• FET was on the cusp of a breakout on June 1st but couldn’t make it (see my previous FET idea).
• On June 10th, FET lost the support trendline, but it reclaimed it shortly after and it is now testing it for support.
• Should the retest be successful it could be an amazing entry with a close invalidation and huge reward.
My Trade Ideas:
1. Long upon a successful retest of the trendline
• Entry: 0.2 USD
• SL: 0.185 USD
• Target: 0.43 USD
• TP: 0.24, 0.31, 0.43. Leave a moon bag.
• R: R: 1:15
2. Long upon a successful break out of the wedge
• Entry: 0.24 USD (break out of the wedge)
• SL: 0.23 USD (approximate number, below the last daily candle)
• Target: 0.43 USD
• TP: 0.31, 0.43. Leave a moon bag.
• R: R: 1:10
NFA.
What do you think? Please share in the comments.
Best wishes to all.

Finally Fet Breaking Another bullish Pattern Breaking Falling Wedge In H8 Timeframe Incase Of Successful Breakout Expecting 70 - 75% Bullish Bullish Wave
Wait for Confirmed breakout for entry
🔥 FET Bullish Reversal Trade: Patience!FET has been trading bearish for months. As of a couple of days ago, BTC saw a huge break out which will likely take alts with it. This trade assumes that FET, an early 2023 winner, will move up together with BTC.
I'm waiting for the break out through the top diagonal resistance. Once a daily candle has closed above said resistance, we're entering from around that level. Target at the 2023 top for the highest risk-reward. If you're more risk averse, consider taking (partial) profits around 0.30 or 0.40

FET possible Roadmap until June 2023This is the monthly chart of FET.
As you know, we had AI hype in Jan, and FET is one of the AI coins. The hype has just started, and 2023 will be an excellent year for this narrative.
The best buy zone for this correction would be ~$0.114-$0.183; you can accumulate FET in Q2 for the final run with a target above ~$2 in Q3.
Patience is key here, don't rush to get into the trade, wait patiently, and enter at the "right" time.
Please hit the boost button if you agree.
Thanks

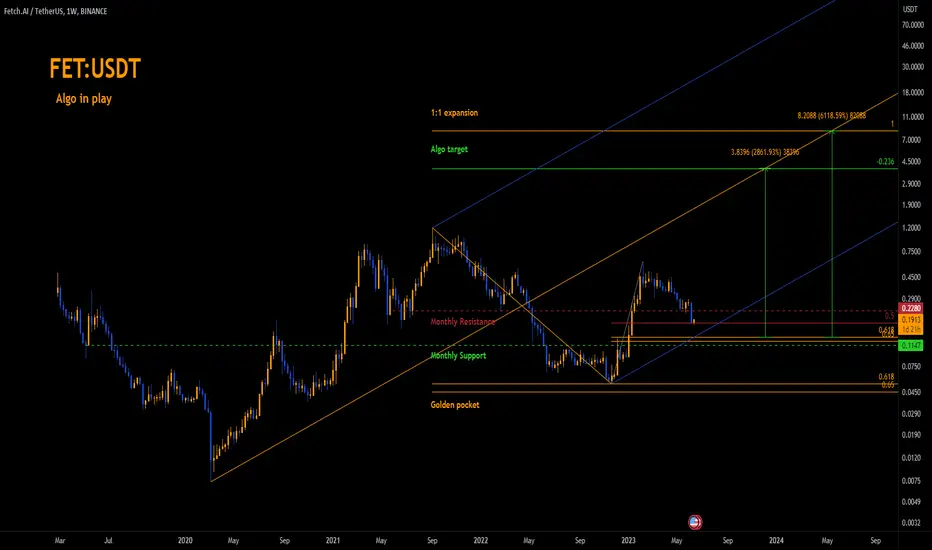
FET:USDT - Algo target: $3.90, targets 1900% to +6100%, epic R:RFetch.AI had a perfect reaction at the golden pocket so the algos should be behind it targeting $3.90. A mean reversion trade is in play with 80% odd of hitting the target, currently at around +10x. Price has reacted at the local 0.5 fib so there's potential for this to be the local low but there's still a chance to dip to the golden pocket. There's an insane R:R for these trades.
Key points:
Pitchfork Mean Reversion for Modified Schiff hit
Pitchfork Mean Reversion for Original still in play (+10x from here with 80% odds)
Algo target at $3.90
1:1 of the swing range projected from the low gives a target of $8.2
Currently above monthly support
Currently below monthly resistance
0.5fib entry R:R = 220R & 369R
0.618 entry R:R = 345R & 745R
The trade:
Entry 1: Here, or close as possible to the 0.5fib (currently 0.1910)
Entry 2: 0.618fib @ 0.135
Entry 3: add to position if there's a reaction and retrace at gold zone
Target 1: $3.90
Target 2: $8.28
Target 3: median line touch - may happen before other targets
Stop 1: just below the pervious low at the 0.5fib @ 0.17
Stop 2: just below the 0.65fib @ 0.1221
Stop 3: set based on fibs from additional entries
Risk management: the stop loss is a significant drawdown @ about 8% so compensate for this by entering with a smaller position (risk no more than 2% of account balance for the drawdown)
If given the opportunity with additional .618 retracements add to position & move stop to new .707.
D.Y.O.R. DO NOT BLINDLY TAKE THESE TRADES.
Never Trust. Verify. PLEASE DO YOUR OWN ANALYSIS.
This is not financial advice. These are just my observations.
Technical Analysis is not about being right, it's about increasing your odds.
Be prepared to be wrong. Risk management is key. Capital preservation above all else.
update FETUSDTWe may be in a sub-corrective fourth wave that goes sideways, and then a fifth wave will follow
Note: the analysis fails if the price rose above the L area 2.911 usdt

Fetch AI (FET) Possible Double Bottom• Lately it seems that the AI narrative is gaining traction again. Fetch could be one of the crypto assets that stands to benefit from said hype.
• Fetch has been in a downtrend since February 8th, and it looks like it is forming a double bottom with multiple bullish divergences.
• FET’s double bottom neckline is at the 0.285 USD level . Breaching the neckline and testing it as support could be a long trigger.
• Although FET’s chart in and on itself seems to support a bullish reversal it is advisable to keep an eye out on Bitcoin. Bitcoin faces resistance at the 28,000 – 28,500. If it can flip the 28K level to support, I think that Fetch is good to go. IMO, most alts, FET included, are not strong enough to disregard Bitcoin and just go up.
• Keep an eye on the RSI. IF it breaks out of the channel, it could be an indication that there is momentum behind the move up.
My Trade Idea:
• Entry: 0.285
• SL: Previous candle low. If you have confidence in Fetch, you can give it more space. Personally, I am not 100% sure about this so I will keep the SL tight.
• Targets: 0.31, 0.35, 0.385, 0.43
NFA
Feedback will be appreciated.
Best wishes to all.

fet.ai short termwe have 2 hrs till the 4hr candle closes in this time i look to test local resistance before rejecting
short term long position of 5%

FetchAI (#FETUSDT): Downtrend Intact, Potential Correction Ahead💎 #FetchAI (#FETUSDT) recently broke below the downtrend trendline, signaling a continuation of the downtrend. The current price sits at the 161.8% Fibonacci support, indicating a potential for a pullback. A correction could lead #FETUSDT back to the trendline breakout point near $2.4, coinciding with the VolumeProfile resistance.
💎 Sellers currently dominate the market, and only when the supply area turns into a demand zone should we consider buying opportunities. Until then, we should be prepared for a possible downtrend continuation, with a potential 7% drop to the 261.8% Fibonacci support.

Two floors of the peak and Fly!As you look at MA20. And followed by the pattern of two bottoms of the peak. With the breaking of the resistance and the neck line. The upward trend will continue

#FET🔰#FET - Crypto - Binance
🟩 BUY TRADE !
🛒 Good Entry Between : C.P - 0.240
🔸 Falling Channel Is founded
🔸 Falling trend has broken and tested in 4H candle.
🔸 After Achieving 1st target (5%), Move stop lose to entry.
🔸 Stop Lose Mentioned in the drawing.
🔸 Stop loss after the close of the 4-hour candle.
—
TDAWLY ©

Fet povFet really has strong support and at the top of the white line a place of interest. keep in mind the ALT season is just around the corner so I would suggest a DCA at two levels then if the Altcoin season catches us in that range...then its go time. but if it decides to break then we will see the upside of things...
use DCA , low leverage and risk management
this is not an investment advice just a point of view

🔥 FET Bullish Divergence: Huge Upside PotentialFET was one of the major winners of the first few months of 2023, but has been severely lacking over the last months. However, after FET reached daily oversold levels on the RSI recently, it caught my attention.
At the moment I'm seeing a strong bullish divergence on the chart, which could be an indication of a reversal. I'm waiting for the price to close above the 0.266 levels, since it seems like a strong resistance. Once we're above there, we can look for long opportunities.
Risk-averse traders might want to take partial profits at 0.285 and 0.345, or even move the stop to break even at the very least.

Fet Looks Ready To Reclaim 0.60$Seems Like Ready For Upside Continuation Over All Forming Descending Channel Now Breaks Counter tl Expecting Move towards 0.60$ In coming Weeks

FET falling wedge pattern#FET formed falling wedge pattern on 4H timeframe!
Keep an eye on it and wait for proper confirmation

Rotation back to AIFET putting in a possible double bottom with bullish RSI divergence on all pairs
With NVDA guiding +50% higher revs on AI, money likely rotates back into the AI names

Fetch.ai Buy SignalThis Triangle need to break
support and resistance you can see if break from down
good times to buy fetch

Fetch.ai SignalThis Triangle need to break
support and resistance you can see if break from down
good times to buy fetch

Fetusdt , technical analysis Fet can grow well from here. To be more sure, wait for it to reject 27.

fet next movedo you see what i'm seeing. fet weekly stochastic is reset next target is top ofn the channel 900% move with very tight stop loss!
